Is Your Current Emerging Market Strategy Overexposed to These 3 Factors?
Adapting to a new paradigm in emerging market investing
Executive Summary:
- Since the end of the financial crisis, emerging market equities have not kept pace with U.S equities. We identified three factors that are affecting emerging market performance
- We believe investors should seek to reduce their exposure to these three factors by favoring GDP weighted emerging market country allocations over market cap weighted allocations
- We believe investors may benefit from a more complete China allocation within their emerging market strategy
MAY 7, 2015 – U.S. equities have experienced a remarkable turnaround since the worst point of the financial crisis in March 2009. Over this same period, emerging market equities did not perform as well as their U.S counterparts. We believe there are three significant factors that weighed on emerging market performance that may persist into the future. Based on our analysis we identified a solution that can potentially mitigate these factors. We believe this solution can provide attractive performance compared to other emerging market investment vehicles that are not specifically tailored to meet the new paradigm in emerging market investing.
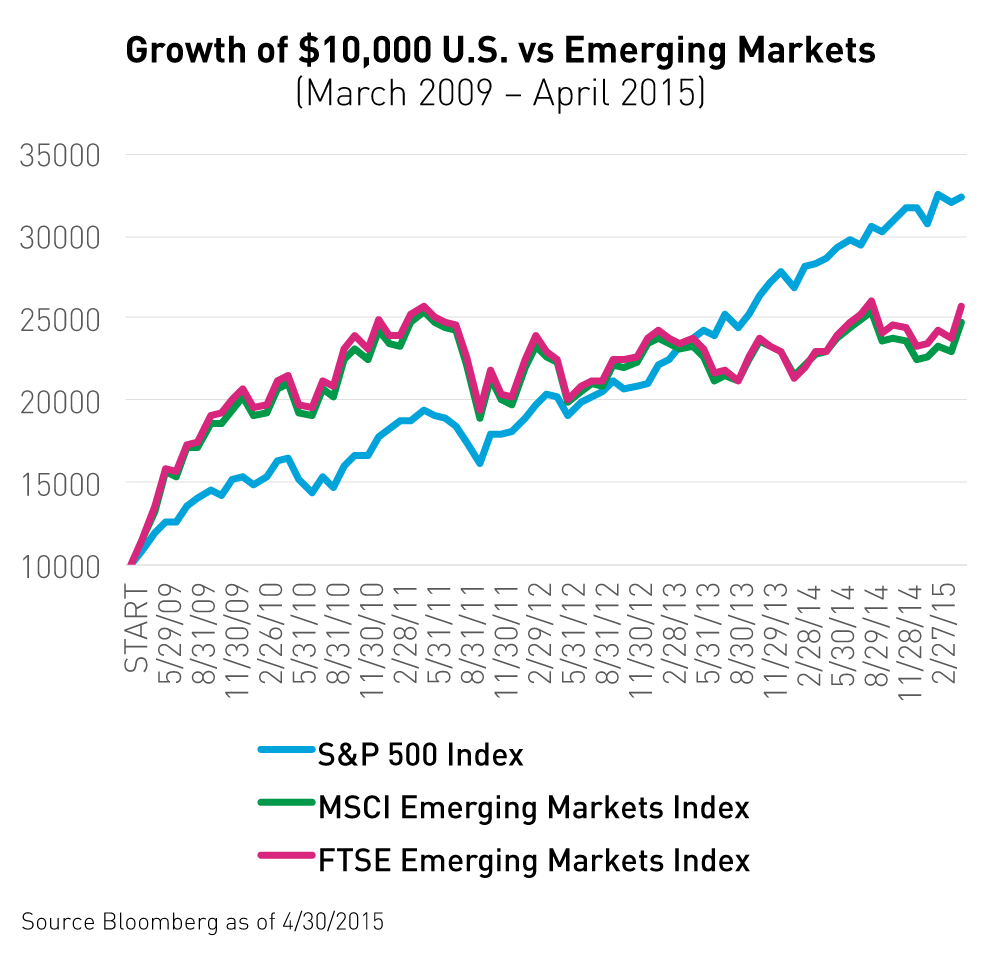
U.S. equities measured by the S&P 5001, have returned 252% from March 1st, 2009 through April 30, 2015. Over the same time period emerging markets, measured by the FTSE Emerging Market Index2 and MSCI Emerging Market Index3 returned 165% and 156% respectively.
FACTOR 1: U.S Dollar Strength & The Potential Federal Reserve Rate Hike
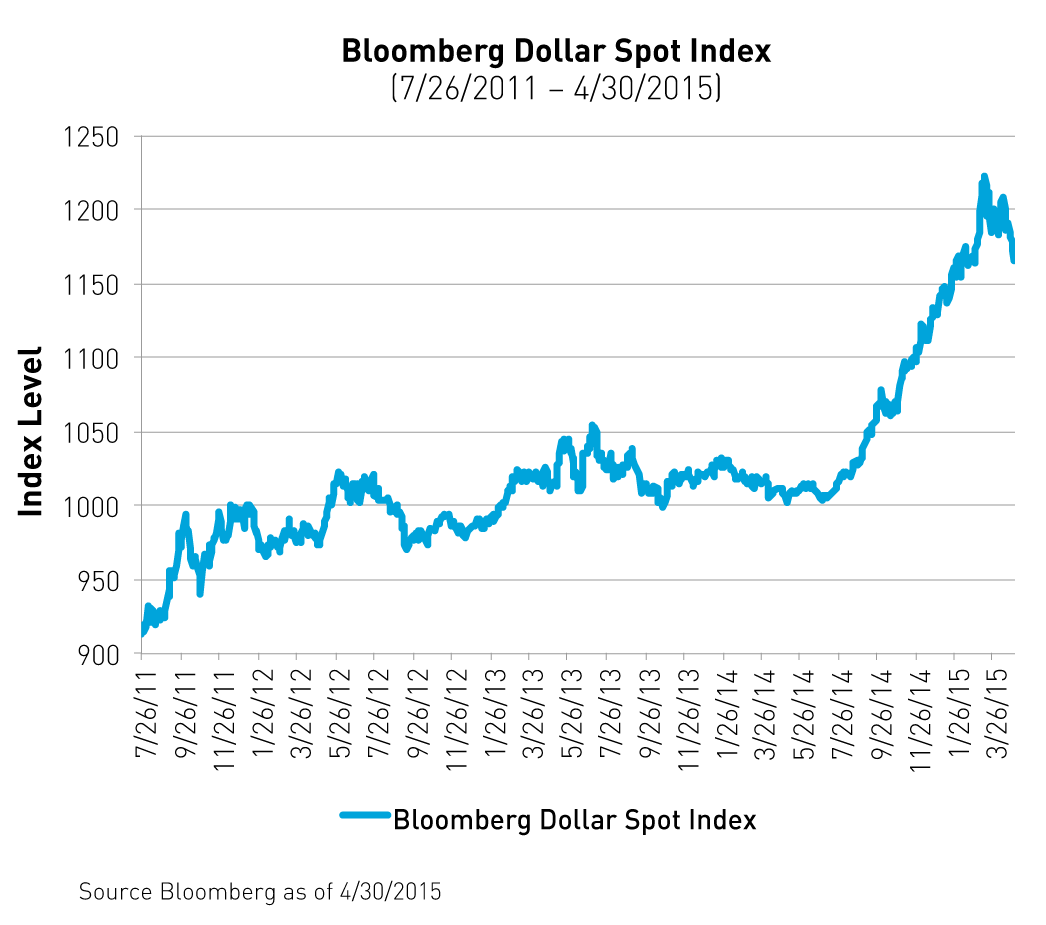
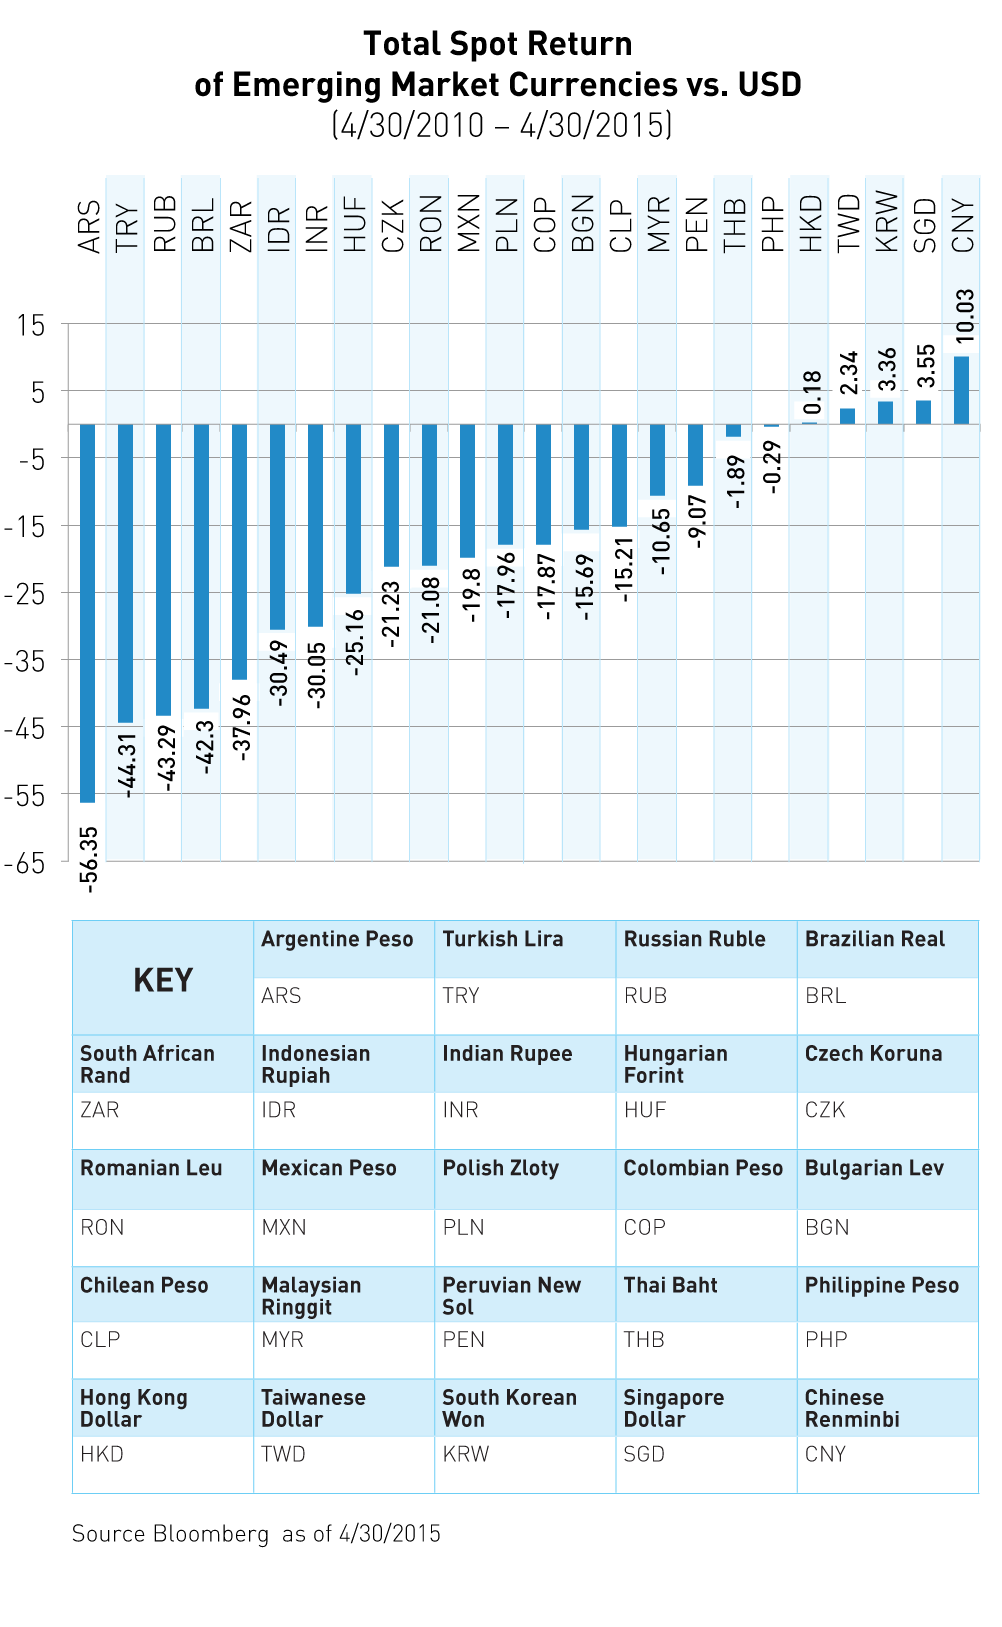
Since its five year low on July 26, 2011 through April 30, 2015, the Bloomberg Dollar Spot Index4 returned 28.95%. While the dollar has strengthened, some individual emerging market (EM) currencies have depreciated significantly as illustrated by the second chart below. This foreign exchange exposure hurt market cap weighted EM indices due to their overweight to several of the worst performing currencies. The specter of a potential rate hike from the Federal Reserve could exacerbate this situation because when rates rise in the U.S. the dollar typically strengthens.
FACTOR 2: Increased U.S. Energy Production
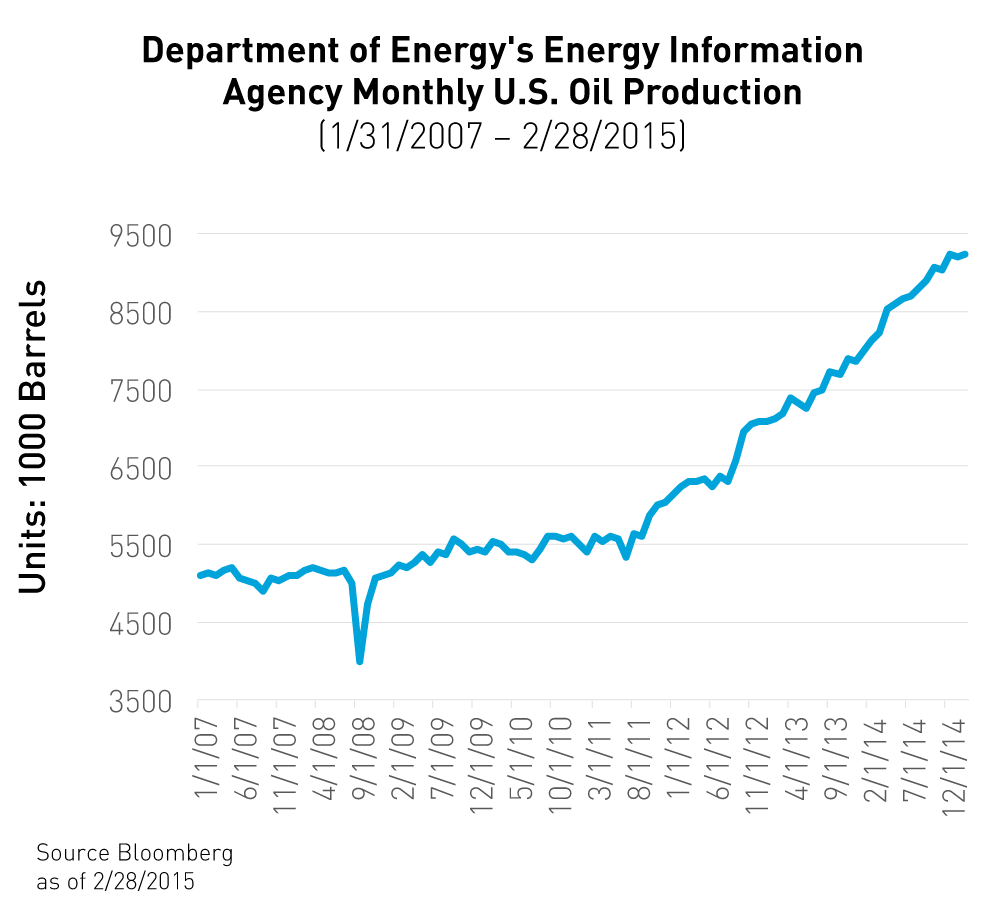
Increased U.S. energy production is a contributor to the collapse in global oil prices. Lower oil prices hurt the economies and stock markets of many emerging market exporters such as Brazil, Mexico and Qatar. The trickle down effect of lower prices on these economies has been severe. Market cap weighted emerging market indices have high weights to these countries.
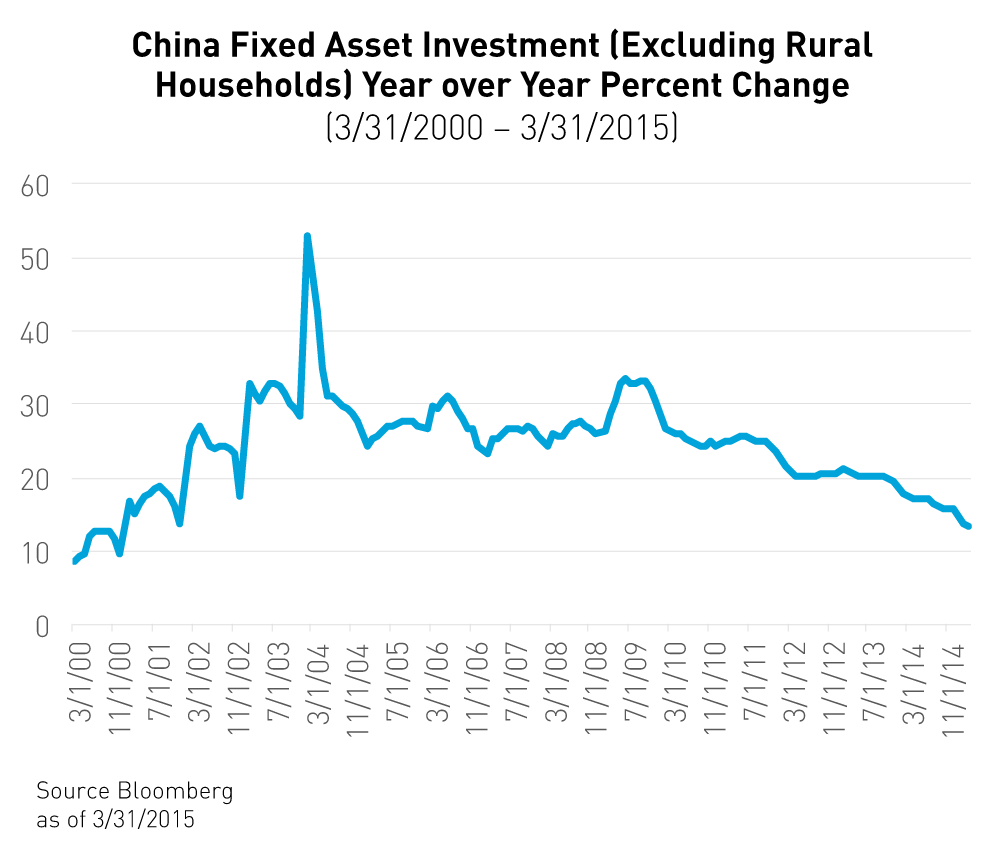
FACTOR 3: China’s Slowing Fixed Asset Investment
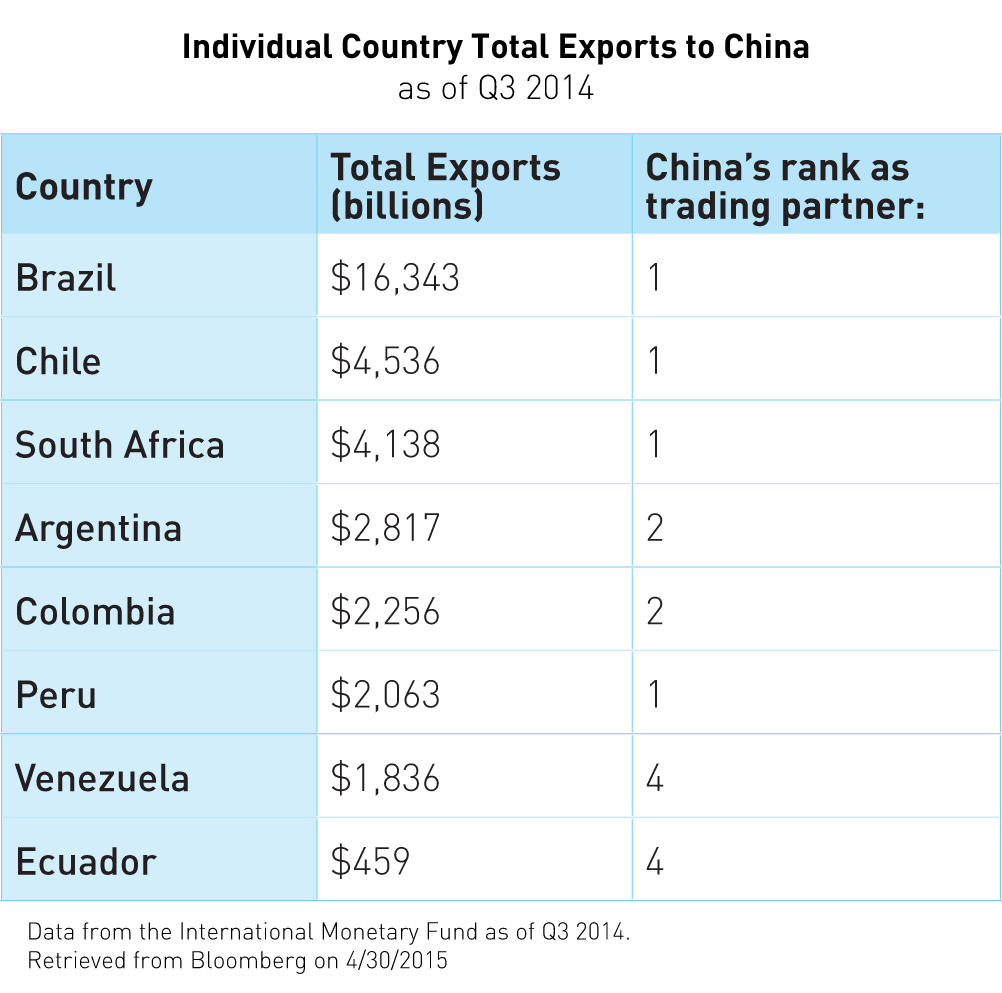
China’s rate of fixed asset investment has been slowing in recent years. Fixed asset investment (FAI) is an economist’s term for building assets that are held for ten years or more. If China is building at a slower rate, less commodity inputs are needed. China is the largest trading partner for many emerging market countries that rely on it to buy their commodity and natural resource exports. If China’s FAI continues to slow, investors can expect a negative knock on effect for these countries. Market cap weighted indices have large exposures to emerging market countries that depend on China to buy their resources.
South Africa: a Surprising Exception to the New Emerging Market Paradigm
According to our thesis, we believe South Africa should perform poorly because it is heavily exposed to the three factors we outlined above. Quite surprisingly, South Africa has performed well compared to many other EM countries over the past five years. The reason for this outperformance can be attributed to Naspers– the largest listed company on the Johannesburg Stock Exchange. Naspers is a giant South African media conglomerate that was an early investor in Chinese internet giant Tencent. From April 30, 2010 to April 30, 2015, Naspers returned 307%5 driven by the strong performance of Tencent’s stock on the Hong Kong Stock Exchange6. Over this time period Naspers contributed 20% of the MSCI South Africa Index’s 43% return7. South Africa is an exception to our thesis because nearly half of its return was actually driven by Tencent– a company that trades 6,600 miles away in Hong Kong.
How can investors adapt to the new emerging market paradigm?
Investors who believe that the current trends in emerging markets are apt to continue must now become more discerning with their emerging market allocations. Investing into generic broad based market-cap weighted strategies may no longer be sufficient to achieve desired returns. We believe emerging market investors should either invest selectively through targeted country exposures, or pursue a GDP weighted solution that more accurately allocates to countries' based on their economic importance.
GDP weighted funds are ideal for investors who prefer to maintain a broad EM strategy that does not eliminate complete country exposures. GDP weighting can reduce exposure to countries like Brazil, who have suffered from currency volatility and weak commodity prices, and provide an overweight to countries like India and China that have more developed capital markets.
Investors may also consider looking for alternative drivers of emerging market growth that have been excluded from older market-cap weighted emerging market indices. We have identified two major potential growth opportunities within the emerging markets that stem from China. These two opportunities are Chinese internet and technology companies, and mainland Chinese equities listed on the Shanghai and Shenzhen stock exchanges.
Many Chinese technology companies decide to list in the United States in order to attract a greater international investor base. Due to their U.S. listing they are excluded from the majority of emerging market indices even though they derive most of their revenue from China. U.S. listed Chinese companies have returned 16.3% year to date as of 4/30/2015.8
Historically the mainland stock exchanges have been cordoned off from investors outside of China. Over the past two years China has accelerated the opening up of its economy by expanding its Renminbi Qualified Foreign Institutional Investor (RQFII) program that allows foreign investors to move a set amount of money in and out of the mainland markets. China also implemented the historic Shanghai-Hong Kong Stock Connect Program, which allows for investors to trade stocks between Shanghai and Hong Kong. These reforms coupled with an increase in brokerage account openings by Mainland Chinese investors have caused the mainland markets to soar since the second quarter of 2014. The Mainland Chinese markets are up 33.8% year to date as of 4/30/2015.9
While the strong U.S. dollar, increased U.S. energy production, and decreased fixed asset investment in China have taken some of the luster out of emerging market investing, savvy investors can still find plenty of potential opportunities within emerging markets. We believe a GDP weighted approach to broad based emerging market investing paired with a China allocation that includes Chinese tech companies and mainland listed Chinese equities may better position investors for success in the new emerging market paradigm.
- S&P 500 Index: includes 500 leading companies and captures approximately 80% coverage of available large–cap U.S. equities.
- FTSE Emerging Markets Index: provides investors with a comprehensive means of measuring the performance of the most liquid companies in the emerging markets
- MSCI Emerging Markets Index: is a float-adjusted market capitalization index that consists of indices in 21 emerging economies
- Bloomberg Dollar Spot Index: tracks the performance of a basket of ten leading global currencies versus the U.S. dollar.
- Naspers returns from Bloomberg as of 4/30/2015. According to MSCI Naspers was the largest constituent of the MSCI South Africa Index as of 3/31/2015
- Source: Thomson Reuters, “Shares in South Africa's Naspers break key level as Tencent bet pays off” 4/13/2015
- MSCI South Africa Index returns from Bloomberg as of 4/30/2015. MSCI South Africa Index: is designed to measure the performance of the large and mid cap segments of the South African market. With 51 constituents, the index covers approximately 85% of the free float-adjusted market capitalization in South Africa.
- U.S. listed Chinese securities represented by the FTSE China N Share All Cap Capped Index: Consist of companies incorporated outside the PRC, traded on the NYSE, the NASDAQ ,or NYSE MKT, and controlled by Mainland Chinese entities
- Mainland Chinese securities represented by the FTSE China A 600 Index represents the performance of the mainland Chinese market that is available to A share investors, and international investors via the QFII scheme.