What are Carbon Credits? Carbon ETF FAQ
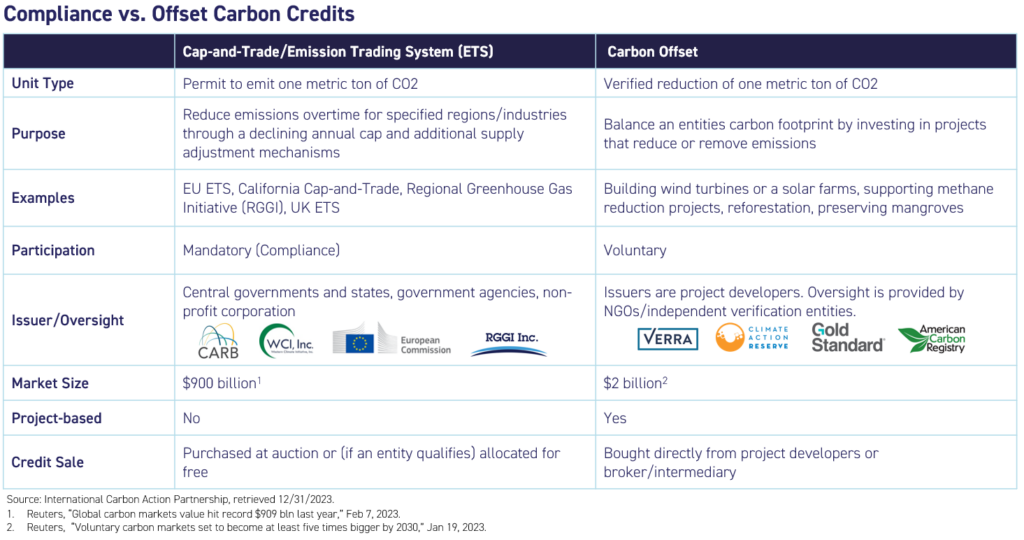
What is the difference between carbon allowances and carbon offsets?
Carbon allowance – Mandatory (compliance) internal emissions reductions
Sometimes referred to as carbon credit, represents the legal right to emit one metric ton of carbon dioxide or equivalent greenhouse gas. These allowances are issued by the government to companies and organizations participating in a mandatory national or international carbon cap-and-trade markets, i.e., European Union, California, United Kingdom, and Northeastern US Regional Greenhouse Gas Initiative (RGGI). Depending on the specific market or trading system, carbon allowances are either purchased by regulated emitters, often by auction or allocated for free based on forecast carbon emissions. Compliance entities mandated under these programs typically fall under industries such as industrial facilities, electricity generators and importers, natural gas suppliers, and transportation fuel suppliers.
Carbon Offset – Voluntary outsourcing of emissions reductions
An offset credit is generally outside of an emission trading system or can be imported into an ETS. It also represents one metric ton of carbon dioxide or equivalent greenhouse gas (GHG). However, it is generated by a reduction in emissions made by a voluntary project designed specifically for that purpose. Typical carbon offset projects include building wind turbines or a solar farm, supporting methane reduction projects, planting a tree, or preserving forests.
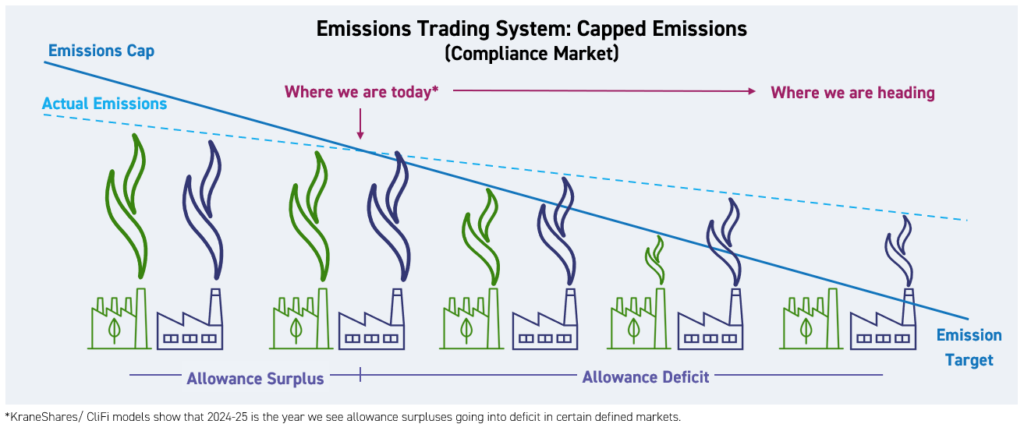
How does an emission trading system (ETS) work?
Also known as a cap-and-trade program, an ETS is a market designed to reduce pollution in our atmosphere by putting a price on emissions as well as a limit. The regulatory authority in the regional jurisdiction sets a cap on greenhouse gas emissions across a given industry or the entire economy. The total amount of the cap is split into allowances, each permitting a company to emit one metric ton of carbon dioxide or carbon dioxide equivalent. Regulators then auction the allowances to companies. The cap gets stricter over time, decreasing the overall greenhouse gas emissions for the region and mitigating climate change.
The trade part is a market for companies to buy and sell allowances that let them emit only a certain amount of carbon dioxide and has supply and demand set the price. Companies that cut their pollution faster can sell allowances to companies that pollute more, or they can hold them for future use. This market system, informally called a carbon market1, gives companies flexibility. It increases the pool of available capital to make further emission reductions, encourages companies to cut pollution faster, and rewards innovation.2
Who are the entities that participate in an ETS?
Example ETS: California Cap and Trade
- Emitters: compliance entities under transport, buildings, industry, and power sectors that generally emit 25,000 or more metric tons of CO2e annually; amounts to roughly 450 entities
- Capital market participants: investment funds, financial institutions/firms, etc., which help create the markets, provide liquidity, and offer risk transfer (speculation)
Top Buyers: Chevron, Marathon Petroleum Company, Southern California Gas Company, Valero Marketing and Supply Company, BP Products North America
Sector coverage differs across markets and continues to expand as these programs mature.
What sectors and emissions scope are covered under an ETS?
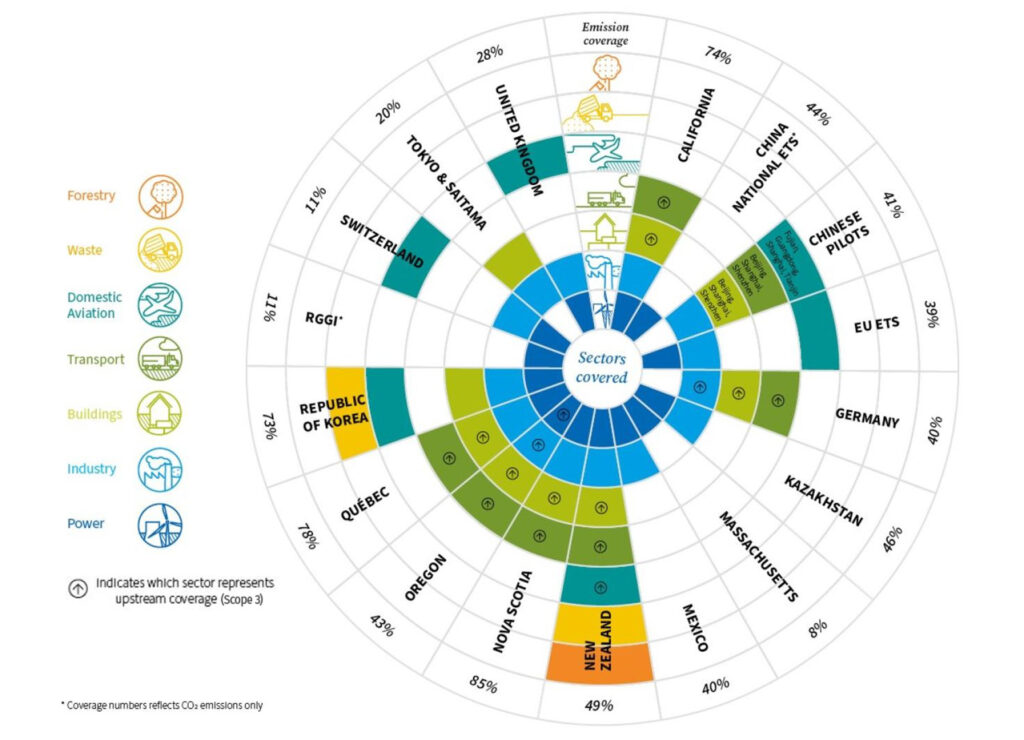
Scope 1, 2, and 3 (i.e., where the emissions originate from) are concepts used in the Voluntary market, though are universal enough concepts that we can compare that to Cap-and-Trade regulatory market coverage. Typically, cap and trade programs regulate emissions directly at the source where the gases are emitted (similar to Scope 1). Regulating at the source is effective because the regulated entities have direct control over their fuel sources/abatement options. The European Union, the United Kingdom, and the Northeast Regional Greenhouse Gas Initiative (RGGI) all regulate at the source. Some markets do regulate the embedded or indirect upstream and/or downstream emissions (Scope 3). Upstream regulation includes the implied emissions from natural resource extraction (e.g., where oil is first commercialized by extractors) regardless of whether they’re burned. Downstream regulation focuses on the other end of the supply chain, which would account for the end user/consumers. An example of downstream is emissions from the use of an entity’s sold products (e.g., combustion of gasoline, diesel fuel, or natural gas by the fuel suppliers’ customers) to account for the individual consumers’ emissions. California regulates a mix, including upstream for buildings and transport, point source for industry and in-state power generation, and imported electricity at the point of first delivery onto California’s electricity grid. The above diagram shows sector coverage with an arrow where upstream coverage is included.
See the end of the FAQ for full definitions of the different scope emissions.
Where can I find pricing data and market/policy updates on carbon allowances?
Our weekly blog, Climate Market Now, provides updates on price movement, regulatory news, and pricing data. Subscribe Climate Market Now for our weekly email.
Bloomberg’s CO2E function provides carbon prices (allowances and offsets), relevant energy indicators, related news and reports, and additional market tools. With a Bloomberg Anywhere account, users get access to tools like a Fuel Switching Monitor, EU ETS Hedging Calculator, EU ETS Market Stability Reserve Model, auction data, and more. See our Carbon Investing Bloomberg User Guide for more details on accessing data on carbon futures.
In addition to Bloomberg, carbon allowance auction data for each program can be found below:
- European Union: The European Energy Exchange (EEX), the marketplace for European Union allowance (EUA) auctions, publishes annual auction data under their EUA Emission Spot Primary Market Auction Reports. EUA auctions are held throughout the week.
- California: The regulator, the California Air Resource Board, publishes auction data for California carbon allowances (CCAs). See here for historical auction notices, results and proceeds reports. A summary table of historical auction prices can also be found on the webpage by clicking on Auction Settlement Prices and Results Summary. Note, California auctions are jointly held with Quebec under the Western Climate Initiative (WCI), on a quarterly basis.
- United Kingdom: The Intercontinental Exchange (ICE) Futures Europe hosts UK allowance (UKA) auctions, which are held every two weeks. Historical auction results can be found on ICE Reports Center.
- Regional Greenhouse Gas Initiative (RGGI): Potomac Economics, an independent market monitor, monitors the performance and efficiency of the RGGI CO2 allowance auctions and the secondary CO2 allowance market. The market monitor releases reports immediately following each RGGI CO2 allowance auction and following each quarter on the secondary market. RGGI quarterly auction data is available on the Market Monitor Reports page.
What is the investment objective of the KRBN ETF?
The KraneShares Global Carbon ETF (the “Fund”) seeks to provide a total return that, before fees and expenses, exceeds that of the S&P Global Carbon Credit Index (the ‘‘Index’’) over a complete market cycle. KRBN is benchmarked to S&P Global Carbon Credit Index, which offers broad coverage of cap-and-trade carbon allowances by tracking the most traded carbon credit futures contracts. The index introduces a new measure for hedging risk and going long the price of carbon while supporting responsible investing.3
What is the process of constructing the portfolio for KRBN?
KRBN tracks the S&P Global Carbon Credit Index, which was developed in partnership with Climate Finance Partners (CLIFI), the funds sub-advisor. The Index Provider (S&P Indices) determines the components and the relative weightings of the components in the Index.
The Index is designed to track the liquid, investable segments of the global carbon allowances market using relevant futures contracts. The Index includes only carbon credit futures that mature in December of the next one to two years and that have a minimum average monthly trading volume over the previous six months of at least $10 million. The Index weights eligible carbon credit futures based on their average monthly trading volume during the relevant six-month period, subject to a 5% minimum weight per regime and a 65% maximum weight to any one of the following geographic regions: (1) Europe, the Middle East and Africa, (2) the Americas, and (3) the Asia-Pacific. In addition, no single carbon credit futures contract expiring in a particular year will receive an allocation of less than 5% or more than 60% at the semi-annual rebalancing or annual reconstitution of the Index.
Adding new markets:
As the global carbon credit market grows, additional carbon credit futures may enter the Index, and the Fund may invest in such additional carbon credit futures if they have a minimum average monthly trading volume over the previous six months of at least $10 million.
Which cap and trade systems make up the S&P Global Carbon Credit Index, and how are the different regions weighted?
KRBN tracks the S&P Global Carbon Credit Index, which is comprised of the European Union Emissions Trading System (EU ETS), the California Cap and Trade (CCA), the Regional Greenhouse Gas Initiative (RGGI), the United Kingdom Emissions Trading System (UK ETS). and the Washington state Cap and Invest (WCA). The base weights that are rebalanced annually are as follows:
- EU ETS: 60%
- CCA: 25%
- RGGI: 5%.
- UKA: 5%
- WCA 5%
Why does KRBN utilize futures and not the underlying carbon credits?
The futures included in the S&P Global Carbon Credit Index are the most liquid, transparent, efficient, and exchange-cleared way to take a position in compliance carbon markets without giving up any of the impact or price discovery features. For reference, the five main carbon market futures' total trading volume was $800bn in 2024.
Further, the futures and physical markets move in lockstep. They are not two different markets but simply two elements of the same market, entirely interconnected as part of one liquidity ecosystem. The aggregate futures position is backed by a part of the physical "bank," and the price of auctions is as much a signal to futures markets as the futures prices are a signal for auction prices. The futures are where the continuous market pricing is achieved, with auctions being periodic. Through both positions, investors help support price discovery and make markets increasingly tighter, making polluting more expensive and incentivizing the decarbonization of various economies, which is the very purpose of the cap-and-trade programs.
For a more detailed analysis of investing in futures versus physical carbon allowances, see our research paper here.
Explanation of futures and the futures market.
Futures contracts are financial derivatives that oblige the buyer to purchase some underlying asset (or the seller to sell that asset) at a predetermined future price and date. A futures contract allows an investor to speculate on the direction of a security, commodity, or financial instrument, either long or short, using leverage. Futures are also often used to hedge the price movement of the underlying asset to help prevent potential losses from unfavorable price changes.
How does KRBN fit within a portfolio?
We spent time with a select group of institutional investors to discuss why they allocate to KraneShares' carbon ETFs and the merits of carbon investing as part of a robust investment portfolio. This exercise identified five primary portfolio applications for carbon allocations, including performance, diversification*, inflation hedge, climate/impact benefits, and an energy transition tool. Read our “Carbon Allocation in Practice: 5 Real Examples from Institutional Portfolios” analysis here.
How does KRBN align with climate action and sustainability investment goals?
Compliance carbon can offer a pure exposure to climate action and align with impact investment goals. The markets have one purpose: to reduce carbon emissions within the economies in which they operate. By participating in these markets, investors help accelerate price discovery, add liquidity, and make the markets more efficient and effective. As carbon prices rise, polluters are incentivized to decarbonize their business operations or incur higher costs to source allowances. These higher prices also drive fuel switching and more capital investment in green innovations.
What drives tracking error with KRBN and the benchmark?
The fund invests in the index strategy and in collateral through money markets. The index makes an assumption that money market yields can be run on 100% of the investment, which is not replicable in the real world. This creates some drag, especially in a high-yield environment. However, the index provider is working on improving this. Additionally, there was a difference in the pricing data used by the index and our fund, where prior to December 2022, the index was using OPIS futures pricing while the fund was based on the settlement price. The difference between these prices was very minimal but did contribute to a slight performance variation, and the index has since been updated to use the same pricing. Over the longer period, tracking is also affected by the compounding of trading/operational costs and management fees, which is normal, albeit it shows up more on less liquid, more expensive, and high-performing products.
When measuring tracking, it is important to use the fund NAV, not price, as the NAV is struck from the same marks as the index and to annualize results.
Why does the fund maintain a position in collateral and currency management?
Futures positions are maintained with margin. This means that the fund is only required to post a certain amount of capital when taking a position. This is then increased or decreased daily with the performance of the future position. As a result, the fund maintains the remainder of the cash and invests in short-dated, high-quality instruments. Further, the fund also manages to the index by ensuring that the currency exposure is in line with the markets it is invested in.
Why does the fund utilize a Special Purpose Vehicle (SPV)?
The SPV in KRBN is ‘standard’ for US commodity funds/ETFs. Historically non-security funds, such as those that hold commodities or futures contracts, were set up often through partnerships or as a 1933 Act fund. However, these fund structures issue K1/investment trust structures, which can be unfavorable for shareholders. As a result, the industry allows for ETF/mutual funds with such holdings to structure as traditional 1940 Act funds (i.e., the standard rulemaking that does not require a K1/based on 1099).
The fund achieves 100% exposure via futures within the Subsidiary; however, it never holds more than 25% of assets in the Subsidiary (limitation is imposed by the Internal Revenue Code of 1986), and the remaining assets are held in low-risk, short duration bonds, e.g., treasuries. This positioning provides 100% exposure to KRBN, while earning risk-free rates.
For international investors, keep in mind that the strategy can pay a distribution and therefore its impact will differ depending on your jurisdiction and tax regimes.
How does an investor gain access to the KRBN, KCCA, and KEUA ETFs?
The ETFs are US exchange traded funds that are listed on the New York Stock Exchange. Individual shares of the Funds can be bought and sold throughout the trading day like other publicly traded securities through a broker-dealer on the Exchange.
The minimum size is one share. The price of an individual Fund share is based on market prices, which may be different from its NAV. As a result, the Funds' shares may trade at a price greater than the NAV (at a premium) or less than the NAV (at a discount). Most investors will incur customary brokerage commissions and charges when buying or selling shares of the Fund through a broker-dealer. You can find daily performance data here.
Does KRBN provide a K1 for tax purposes?
No. KRBN will be reported on your 1099.
*Diversification does not ensure a profit or guarantee against a loss.
Definitions:
- Scope 1 emissions: direct GHG emissions owned or controlled by a company (i.e., operational emissions from fuel combustion in boilers, furnaces, vehicles)
- Scope 2 emissions: indirect GHG emissions associated with the company's purchase of electricity, steam, heat, or cooling
- Scope 3 emissions: indirect GHG emissions from the company's supply chain and product lifecycle
Citations:
- United Nations Climate Change, https://unfccc.int/process-and-meetings/the-convention/glossary-of-climate-change-acronyms-and-terms#c
- EDF, "How cap and trade works", https://www.edf.org/climate/how-cap-and-trade-works
- A Global Price For Carbon Emissions, IHS Markit, April 2020
r-ks-sei