


4 Reasons To Look East For Dividends
2023 could be shaping up to be the year of the dividend as investors grapple with higher US Treasury yields that are not going down anytime soon. However, not all dividend markets are created equal. Below are four reasons to look to Asia for dividends.
The KraneShares S&P Pan Asia Dividend Aristocrats Index ETF (Ticker: KDIV) brings S&P’s famous “Dividend Aristocrats®” methodology to Asia. The Fund’s index, the S&P Pan Asia Dividend Aristocrats Index, selects companies in both emerging and developed Asian economies that have increased their dividends every year for at least the past seven years.
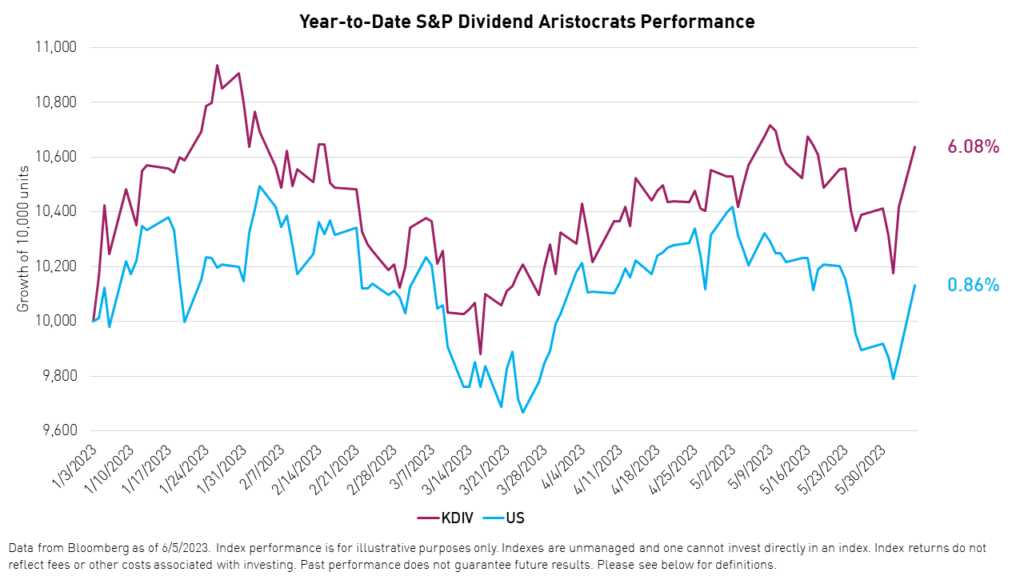
1. Momentum
The Fund is already producing results and has outperformed the S&P 500 Dividend Aristocrats Index, which tracks dividend growers in the US, so far this year, gaining +6.08% versus only 0.86% for its US counterpart, as of June 2, 2023.
Please click here for KDIV standard performance.
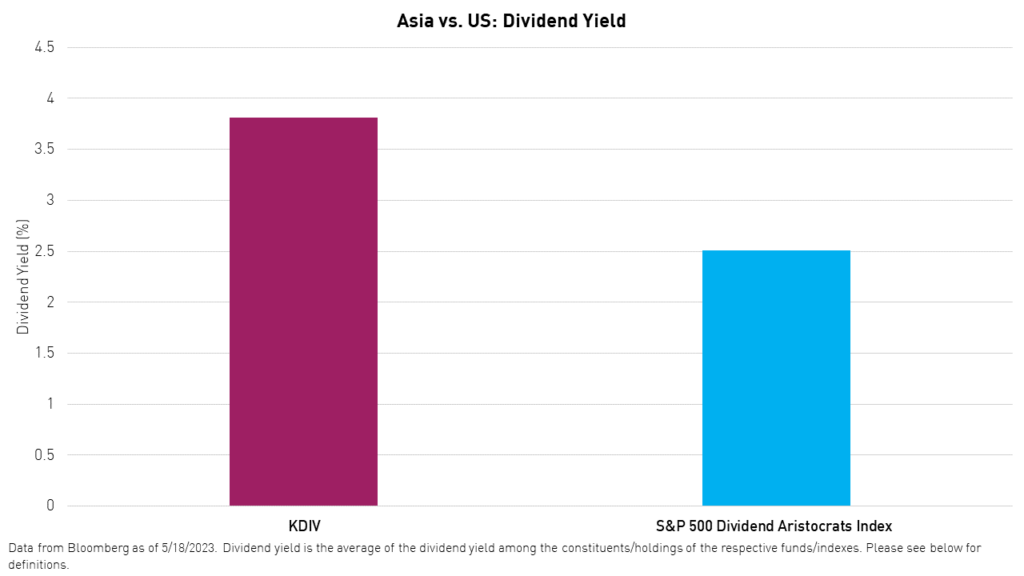
2. Yield
Pan Asia Dividend Aristocrats also currently offer a higher dividend yield, on average, than their US counterparts.
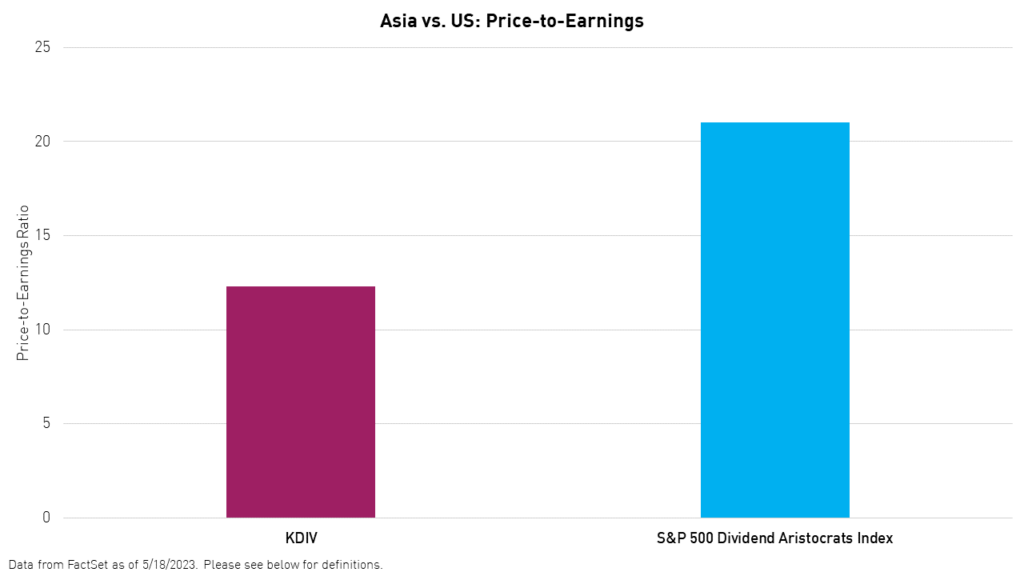
3. Valuation
The Pan Asia Dividend Aristocrats are currently trading at nearly one half of the multiple of their US counterparts, on average.
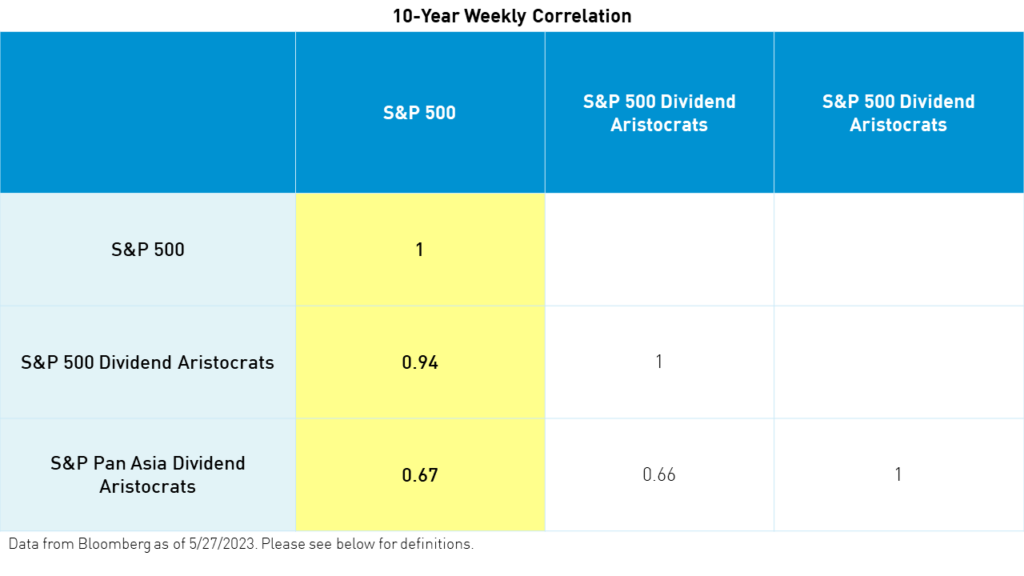
4. Correlation
Asia Dividend Aristocrats have also exhibited relatively low correlations to the broad US equity market and US Dividend Aristocrats, which may present additional portfolio benefits over the long term.
Definitions:
S&P 500 Dividend Aristocrats Index: The S&P 500 Dividend Aristocrats Index measures the performance of S&P 500 companies that have increased their dividends every year for the last 25 consecutive years. The index treats each constituent as a distinct investment opportunity without regard to its size by equally weighting each company. The index was launched on May 2, 2005.
S&P Pan Asia Dividend Aristocrats Index: The S&P Pan Asia Dividend Aristocrats Index measures the performance of constituents within the S&P Pan Asia Broad Market Index (BMI) that have followed a policy of consistently increasing dividends every year for at least seven years. The index was launched on April 14, 2009.
S&P 500 Index: The S&P 500 Index is widely regarded as the best single gauge of large-cap U.S. equities. There is over USD 9.9 trillion indexed or benchmarked to the index, with indexed assets comprising approximately USD 3.4 trillion of this total. The index includes 500 leading companies and covers approximately 80% of available market capitalization. The index was launched on March 4, 1957.
S&P Pan Asia Broad Market Index (BMI): The S&P Pan Asia BMI is a sub-index of the S&P Global BMI and a comprehensive benchmark including securities from developed and emerging Asia. The index was launched on December 31, 1997.
Dividend Yield: The percentage of a company’s share price that said company pays out in dividends each year.
Price-to-Earnings Ratio (P/E): A measure of whether a company is over or under-valued. P/E is calculated as a company’s price per share divided by its earnings per share.
Earnings Per Share (EPS): The total revenue of a company divided by the number of shares outstanding.
Correlation: Correlation is a statistic that measures the degree to which two securities move in relation to one another. Correlations are shown here as the correlation coefficient, which is a value that must fall between -1 (inverse correlation) to 1 (absolute correlation).