
Applying Defined Outcome Strategies Where They Count: China Internet
Introduction
The ETF industry continues to expand and innovate with new strategies. One of the latest trends has been the rising popularity of defined outcome strategies, which use options to set a floor or “buffer” to the downside by reducing potential upside, over a specified period, usually one or two years. Historically, these strategies were exclusively available through structured products offered by banks. While the first buffered ETF was listed back in 2016, launches of these products gained significant momentum starting in 2023, and assets under management (AUM) have climbed to over $40 billion.1
Most defined outcome ETFs focus on US equities, allowing investors to add downside protection to their core portfolios. In this way, they are used as a potentially higher-yielding alternative to cash or a less volatile way to access an asset class. But that is not the only way to use defined outcome strategies. They can also yield outsized risk-adjusted results compared not only to cash but also to equities when applied to the right markets at the right time.
The Case For Defined Outcome Strategies in International Markets
Year-to-date (YTD), the S&P 500 Index has already returned 7.56%,8 meaning that a hypothetical defined outcome strategy for the broad US stock market launched at the beginning of the year with a 20% performance cap would offer significantly less potential upside to investors today.2 Many popular defined outcome strategies were launched last year, meaning there is even less potential upside for investors today, at least within their current outcome periods.
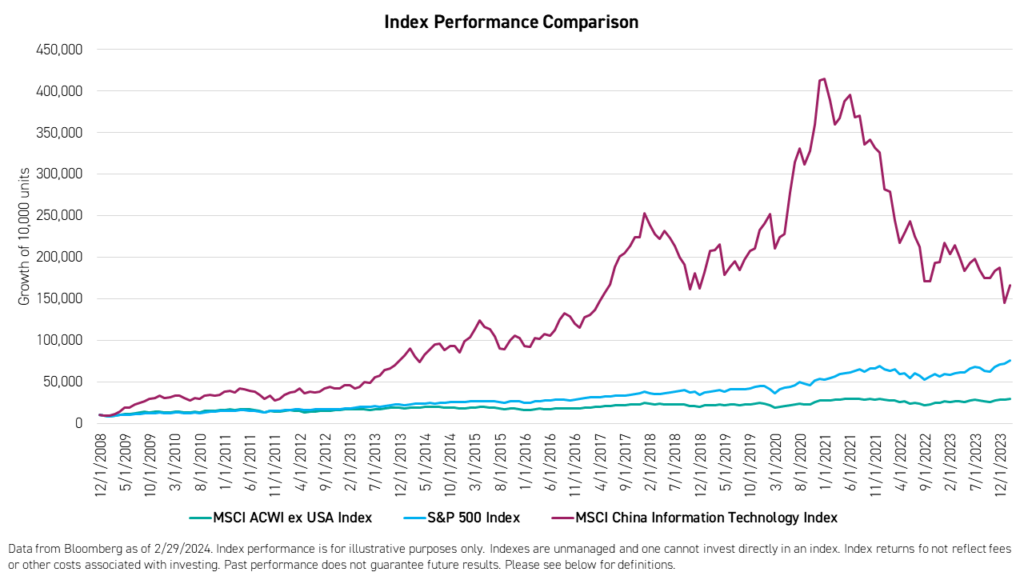
We believe international markets, especially China, offer more potential benefits to investors using defined outcome strategies. Many of these markets have lagged the S&P 500 in recent years with significant volatility. Meanwhile, China's internet & technology sector outperformed the S&P 500 since the Global Financial Crisis (GFC) in 2008, albeit with higher volatility. Despite challenges, we believe these markets have significant upside potential that should not be ignored.
How do investors harness this growth potential while weathering volatility? We believe that defined outcome strategies may be the answer.
The KraneShares 100% KWEB Defined Outcome January 2026 ETF (Ticker: KPRO) and the KraneShares 90% KWEB Defined Outcome January 2026 ETF (Ticker: KBUF) provide exposure to China’s internet sector, represented by the KraneShares CSI China Internet ETF (Ticker: KWEB), which has historically been more volatile compared to US equity markets. We believe that defined outcome strategies are well suited for China’s internet sector because China’s internet equities have high upside potential from currently low valuation levels and, despite this potential, have experienced steeper drawdowns compared to both broad US equities and US internet equities.
KPRO offers a 100% downside buffer with a 22.69% upside cap, before expenses and fees. Meanwhile, KBUF offers a 90% downside buffer with a 41.20% upside cap, before expenses and fees.
China Internet: High Potential Upside & High Volatility
The S&P 500 Index’s current weighted average price-to-earnings ratio (P/E) is 25.2, whereas KWEB’s is only 17.4 despite its focus on growth industries. The Dow Jones US Internet Composite Index, which is comparable to KWEB’s index in the US market, has a P/E of 30.7.
UBS recently raised its year-end price target for the S&P 500 to 5,400 from its target of 5,150 in January.6 Despite being one of the highest estimates on Wall Street, it implies an upside of only 5.6% from the index’s closing price on March 11th.7 Meanwhile, KWEB returned +8.7% in one month in February, the fifth-best monthly performance for the fund out of the past 36 months.7
As the charts below demonstrate, KWEB has provided a wide range of potential 2-year outcomes since its launch in July of 2013. These include a maximum gain of +137% compared to the S&P 500’s 105%. With KWEB’s price currently at a low point but increasing, we believe the Fund has the potential to meet or even exceed the performance caps within our defined outcome strategies, which are already higher than most US-referenced defined outcome ETFs.*
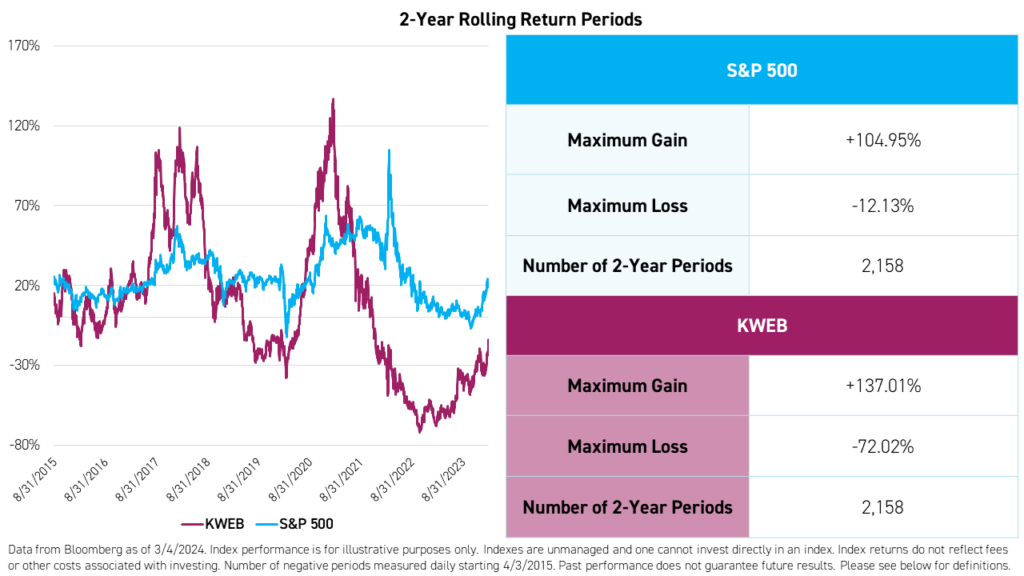
Please click here for KWEB standard performance, top 10 holdings, and risks.
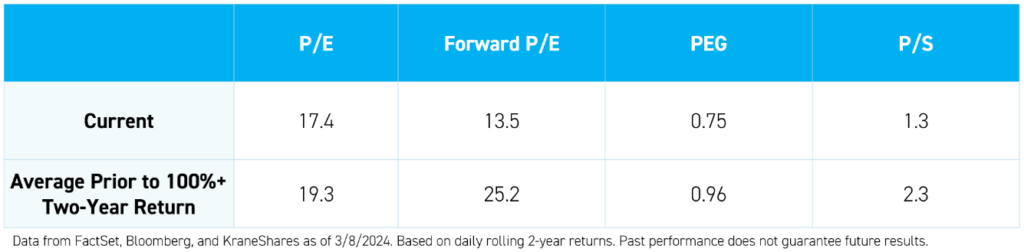
Since its inception, there have been 67 two-year periods, measured daily, in which KWEB has provided returns of more than 100%. The average starting P/E ratio for those periods was 19.3, higher than KWEB’s current P/E ratio of 17.4. The same trend can be observed using other valuation ratios, including Forward P/E, price-to-earnings-to-growth (PEG), and price-to-sales (P/S).
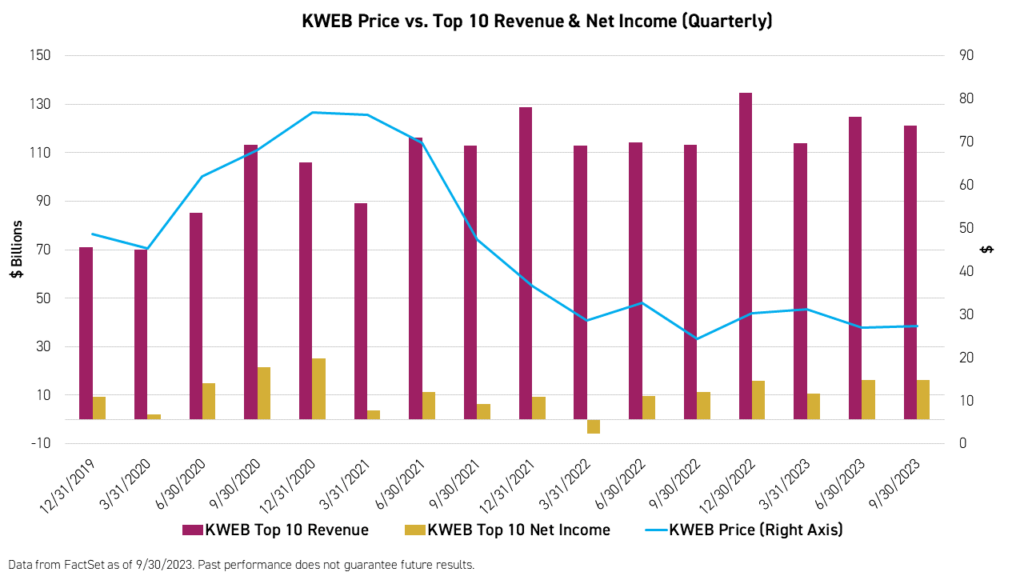
Furthermore, we believe that most of the drawdowns in KWEB over the past three years have not been fundamentally driven. KWEB’s holdings continue to increase their revenues, and the top ten holdings are profitable.
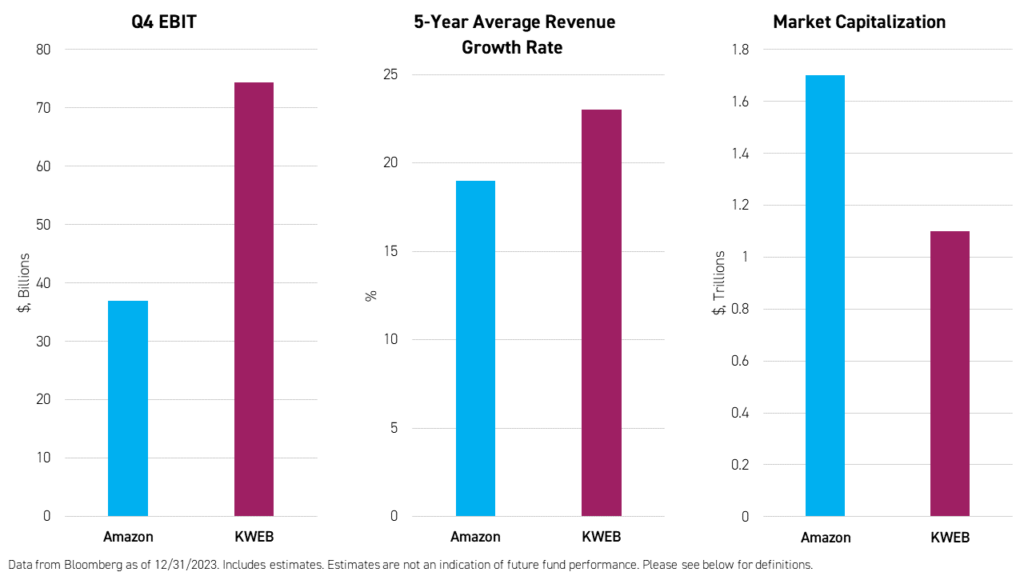
Despite representing over 30 companies with higher average 5-year revenue growth rates and average earnings before interest and taxes (EBIT) than Amazon, all of the companies in KWEB are only worth 65% of Amazon, a difference of $600 billion in market capitalization.
It is also important to note that the secular growth trend behind KWEB remains intact. China’s internet penetration rate still has higher to go at only 74%3 compared to 93%3 in the United States. At the same time, China’s retail web sales totaled over $2 trillion in 2022,4 compared to just over $1 trillion in the United States.5
Conclusion
Why not apply defined outcome strategies where they count? We believe using a defined outcome strategy to invest in China’s internet sector is more attractive than using the strategy to invest in US stocks, represented by the S&P 500 Index, because China’s internet sector has higher volatility and higher upside potential, even within the confines of a defined outcome strategy.
The Funds have characteristics unlike many other investment product and may not be suitable for all investors. For more information regarding whether an investment in the Funds is right for you, please read the Funds' prospectuses including "Investor Suitability Considerations".
Citations:
- Data from Bloomberg as of 3/4/2024. Includes US-listed ETFs with self-identified “buffers”.
- Based on selected strategies with high AUM levels.
- Data from Statista and the World Bank as of 12/31/2022.
- Data from China Internet Watch as of 12/31/2023. Figures converted from Chinese RMB to USD.
- Data from U.S. Census Bureau as of 12/31/2023.
- Reuters U.S. Markets. “UBS lifts S&P 500 year-end target to 5,400, highest among top global brokerages,” Reuters. February 20, 2024.
- Data from Bloomberg.
- Data from Bloomberg as of 3/11/2024.
*Based on an approximation of the average current cap offered by selected US-markets-focused defined outcome strategy ETFs.
Term Definitions:
Price-to-Earnings Ratio (P/E): The price-to-earnings (P/E) ratio measures a company's share price relative to its earnings per share (EPS). Often called the price or earnings multiple, the P/E ratio helps assess the relative value of a company's stock. It's handy for comparing a company's valuation against its historical performance, against other firms within its industry, or the overall market.
Price-to-Earnings-to-Growth Ratio (PEG): The price-to-earnings-to-growth ratio (PEG) is a stock's price-to-earnings (P/E) ratio divided by the growth rate of its earnings for a specified period. The PEG ratio is used to determine a stock's value while also factoring in the company's expected earnings growth, and it is thought to provide a more complete picture than the more standard P/E ratio.
Forward Price-to-Earnings Ratio (P/E): The forward price-to-earnings (P/E) ratio measures a company's share price relative to its predicted earnings per share (EPS). The Forward P/E ratio for the fund is not a forecast of the fund's future performance.
Price-to-Sales Ratio (P/S): The price-to-sales (P/S) ratio is a valuation ratio that compares a company’s stock price to its revenues. It is an indicator of the value that financial markets have placed on each dollar of a company’s sales or revenues.
Earnings Before Interest & Taxes (EBIT): Earnings before interest and taxes (EBIT) indicate a company's profitability. EBIT is calculated as revenue minus expenses excluding tax and interest. EBIT is also called operating earnings, operating profit, and profit before interest and taxes.
Revenue Growth: The rate of increase in the compensation a company receives for the sale of goods and/or services.
Market Capitalization: The total market value of a company's shares outstanding.
Index Definitions:
S&P 500 Index: The S&P 500 Index is widely regarded as the best single gauge of large-cap U.S. equities. There is over USD 9.9 trillion indexed or benchmarked to the index, with indexed assets comprising approximately USD 3.4 trillion of this total. The index includes 500 leading companies and covers approximately 80% of available market capitalization. The index was launched on March 4, 1957.
MSCI All Country World Index (ACWI) ex USA: The MSCI ACWI ex USA Index captures large and mid-cap representation across 22 of 23 developed markets, excluding the United States, and 24 emerging markets. With 2,310 constituents, the index covers approximately 85% of the global equity opportunity set outside the US. The index was launched on January 1, 2001.
MSCI China Information Technology Index: The MSCI China Information Technology Index captures large and mid-cap representation across China H shares, B shares, red chips, and P chips. Currently, the index includes Large Cap A and Mid Cap A shares represented at 20% of their free float adjusted market capitalization. All securities in the index are classified in the Information Technology sector as per the Global Industry Classification Standard (GICS). The index was launched on September 15, 1999.