Emerging & Global Markets Catch Up With Reality
By Anthony Sassine, CFA, Robin Zheng, and Henry Greene
Executive Summary
- Global markets are catching up with the reality of a new normal. The decade-long US bull market is coming to an end, and interest rates are higher. As the world adjusts to this environment, we believe the outlook for emerging markets (EM) and China is improving.
- China's equity markets may continue to differentiate themselves from global equity markets in the coming quarters because the country is currently easing monetary and fiscal policy and entering a recovery phase.
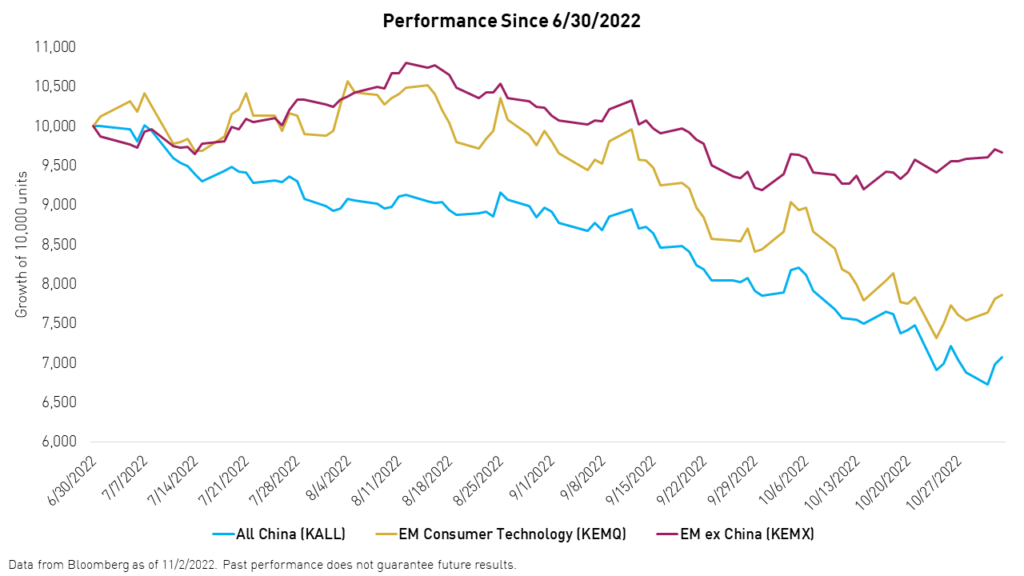
- Broad emerging markets (EM) excluding China have outperformed EM consumer technology and broad China since the end of Q2. We believe this could be due to the value-oriented nature of broad EM and the fact that markets had priced in a worst-case scenario in EM earlier in the year.
- From June 30, 2022, to November 1, 2022, the KraneShares MSCI Emerging Markets ex China Index ETF (Ticker: KEMX) returned -2.87% compared to the KraneShares Emerging Markets Consumer Technology ETF (KEMQ) and the KraneShares MSCI All China Index ETF (Ticker: KALL), which returned -21.65% and -29.86% for the period, respectively.
For standard performance, risks, and other fund information, please click KEMX, KEMQ, KALL.
Introduction
It has been evident for months that global markets were heading toward a new economic regime. We have cautioned about a potential end to the impressive US bull market of the past ten years in previous commentaries. Recent developments show that markets are starting to catch up with reality.
We believe the new normal will look more like the older (pre-Global Financial Crisis) normal with shorter economic cycles of expansion and contraction. However, first, we need to get through the current cycle. The US Fed’s unprecedented aggressive rate hike cycle to battle inflation has brought demand in some critical sectors to an abrupt stop. It has also caused the US dollar to rally to record levels versus global currencies, causing imbalances for countries worldwide.
Given this backdrop, the outlook for emerging market equities is mixed. China is a standout globally because of where the country currently stands in its economic cycle, though its equity market performance has mostly tracked other global markets so far this year. Other major emerging market (EM) economies are more impacted by the US rate cycle and slow down.2 However, unlike the US, negative news seems to be reflected in most EM asset prices and earnings projections. Meanwhile, the outlook for the US and European Union (EU) looks more uncertain going into 2023. We believe investors may start appreciating the value presented by emerging markets and China as fears over inflation settle and/or the US Fed softens its hawkish stance.
We believe that China should be its own asset class in an emerging markets allocation, and we developed KALL and KEMX to allow investors to right-size their China allocation within a broader EM portfolio. Investors can use these two funds to customize their China allocation on their own or, for financial advisors only, follow our Krane Model Portfolio: the Krane Dynamic Emerging Markets Strategy, which dynamically allocates capital between KEMX, KALL, and cash based on widely used fundamental, valuation, and technical signals. Please click here to learn more.
Global Markets Overview
The third quarter of 2022 ended on a worrying note. Global markets retreated significantly during the last two weeks of the quarter following an elevated inflation print and an accompanying 75 basis point hike from the US Federal Reserve. Both events began to take a toll on investor sentiment. Markets received a boost as the Bank of England announced the resumption of bond purchases and the UK government cancelled planned tax cuts, rapidly reversing former Prime Minister Liz Truss' budget plan and avoiding a liquidity crisis.
Toward the end of the third quarter, investors became optimistic that the Fed may reverse its hawkish stance. However, the robust US unemployment numbers announced at the end of the month poured cold water over this possibility. While new job posts declined recently, surveys indicate that corporates have yet to plan significant layoffs.
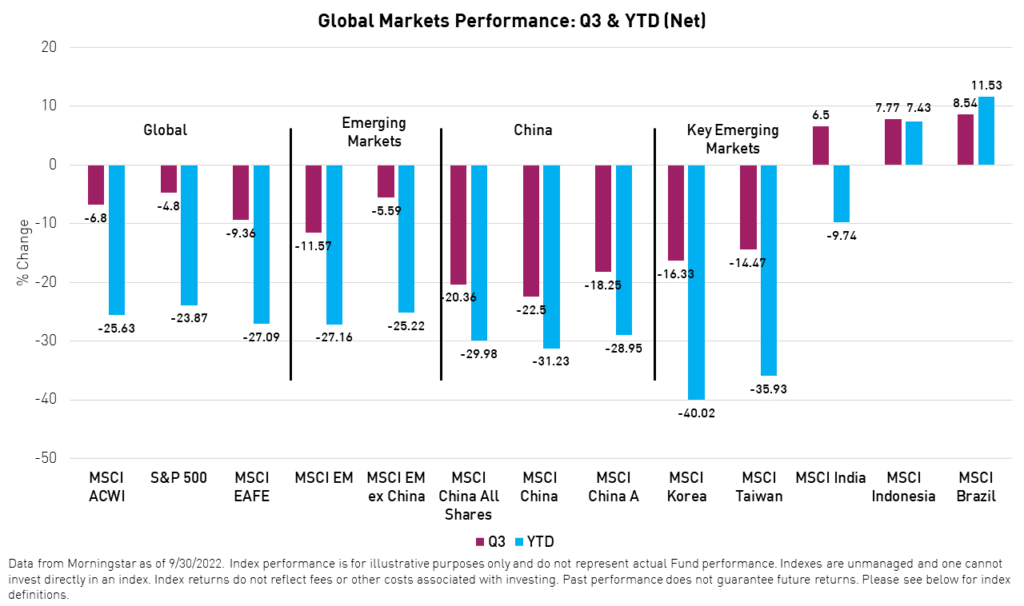
The S&P 500 Index declined -4.84% during the third quarter of 2022, outperforming other developed markets, which declined -9.36%, and emerging markets, which fell -11.57%, as measured by the MSCI Emerging Markets Index. International markets declined during the third quarter, the US dollar's strength acting as an additional stressor for asset prices.
At the end of the quarter, the Bloomberg Dollar Index Spot (DXY) closed at the 112 level,2 slightly below the peak of a multi-decade high. Current DXY levels have not been seen since 2001.2 We believe a rapid rise in the US dollar is negative for emerging market investors because it can translate to higher rates and lower earnings. A record-high US dollar may weaken the fiscal position of fragile EM counties, especially importers and those that have issued debt denominated in US dollars.
China & EM ex China Performance Review
The picture in emerging markets is mixed. Commodity-exporting countries like Brazil, Indonesia, and Saudi Arabia continued to shine in 2022, benefiting from elevated oil, metals, and other commodity prices. Korea, which tends to be more in sync with the US economic cycle and market compared to its emerging Asian peers, declined by -14.5% as inflation continued to bite, leading to more rate hikes.2 Also, the prospect of slowing global growth and continuing lockdowns in Mainland China weighed heavily on technology exports and the Korean shipping industry. Taiwan is also heavily dependent on global trade and saw a similar equity market decline in Q3. Lastly, the chip industry is being dragged into the geopolitical spat between the US and China, effectively depriving many global chip companies of a significant market.
On the other hand, India was on an island during the third quarter, rising 6.50%2 in dollar terms, helped by solid second-quarter GDP growth of 13.50%.2 The impressive growth was partly due to a low base effect in 2021, when GDP contracted by over -20% in the first quarter due to the shuttering of businesses in response to a wave of COVID infections.3
China Performance Review
China is a standout market globally due to where the country currently stands in its economic cycle. While most major economies are raising rates to fight inflation, China continues to cut rates and stimulate growth, which reinforces the view that corporate earnings have bottomed. After having made some progress thanks to a reopening in May and stimulus measures since the beginning of the year, China's equity market lost some steam due to renewed fears over real estate price declines, continued geopolitical tensions, and, most recently, lockdowns. Both offshore companies, represented by MSCI China, and onshore companies, represented by the MSCI China A Index, suffered further from a rising US Dollar. The MSCI China Index declined by -22.50% and the MSCI China A Index declined by -18.32% in dollar terms during the third quarter of 2022.
On the bright side, green shoots are starting to appear, potentially paving the way for a swift recovery and the realization of the government's long-term objectives. First, we have seen very little internet regulation over the summer, confirming a possible end to reforms.4 Second, the China Securities Regulatory Commission (CSRC) and the Securities Exchange Commission (SEC) have signed a statement of protocol allowing the Public Company Accounting Oversight Board to conduct full audit reviews of US-listed Chinese companies, which should lift investor sentiment toward China.
US officials are currently in Hong Kong auditing the data of more than 160 Chinese companies.1 We believe all the major internet companies will pass the test and help to establish a path to the final agreement.
Third, we believe the conclusion of the National Party Congress (NPC) on October 22nd,5 may allow leaders to focus on supporting the real economy once again and potentially pursue more easing of China's zero COVID policy.
Fourth, CSPC Pharma, China's third largest pharmaceutical company, announced favorable numbers for their mRNA COVID vaccine, potentially leading to emergency approval as soon as November. 6
Lastly, for the first time since 2019, China brought back the Pledged Supplementary Lending (PSL) program in October.7 The program was created in 2014 and is meant to capitalize policy banks to support the property sector. The return of the discontinued program indicates that China is looking to bring the real estate sector under control in the near term and protect against systematic risk.
Outlook
The market appears to be in panic mode right now, following the US Fed’s most recent 75 bp hike. Meanwhile, the probability of a severe recession in the US continues to rise. We are seeing indiscriminate selling of growth assets and a rotation toward defensive assets.
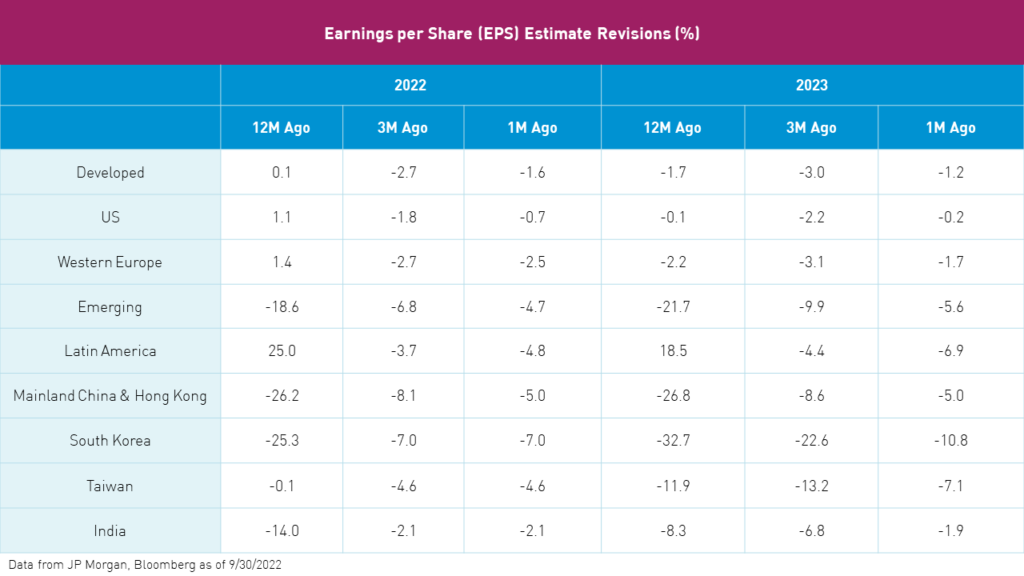
However, we believe investors may begin to differentiate between quality and non-quality assets after the dust settles. This could be triggered by a less hawkish Fed or a reversal of the inflation trend. On the surface, US valuations look more reasonable than they did a few months ago. However, the picture shifts when accounting for the expected upcoming earnings downward revisions.8 Emerging markets earnings have been revised aggressively, especially in China, while US earnings are starting the revision cycle. Consensus earnings per share (EPS) estimates for the S&P 500 remain closer to $243 in 2023, while some analysts are predicting $200 per share.8
Conclusion
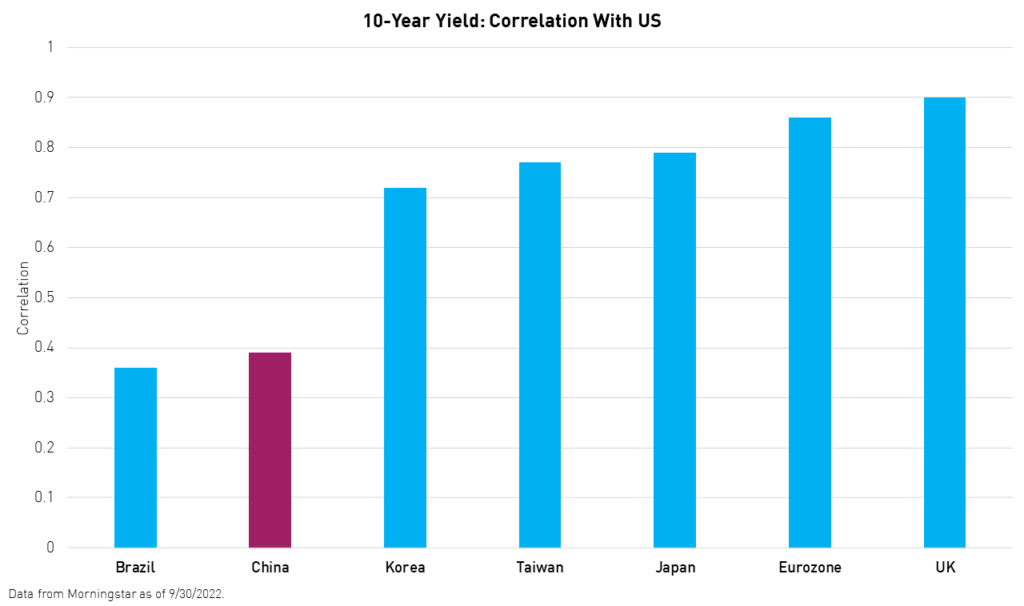
We believe emerging markets and China may provide investors with needed growth and diversification* over the next five years. Furthermore, as the globe enters this new economic regime, developed markets highly correlated with US rates could continue to suffer. Emerging markets, on the other hand, appear as though they have priced in the worst-case scenario. Global investors may benefit from smart exposure to China, which is in a markedly different place in its economic cycle.
*Diversification does not ensure a profit or guarantee against a loss.
Citations:
- Goodman, Matthew P. "Unpacking the PCAOB Deal on US-Listed Chinese Companies," Center for Strategic and International Studies. September 28, 2022.
- Data from Bloomberg as of 9/30/2022.
- "Quarterly GDP Growth of India," Statistics Times. September 4, 2021.
- Zhai, Keith. "China Plans Reprieve for Tech Giants, Including Delaying New Rules, as Economy Slows," The Wall Street Journal. April 29, 2021.
- "20th CPC National Congress concludes in Beijing, Xi Jinping presides over closing session and delivers important speech," Ministry of Foreign Affairs of the People's Republic of China. October 22, 2022.
- "VOLUNTARY ANNOUNCEMENT: COVID-19 mRNA VACCINE "sys6006" OBTAINS CLINICAL TRIAL APPROVAL," CSPC Pharmaceutical Group Limited. April 4, 2022.
- Fan, Hans. "China Credit Observation, Sector Outlook: PSL, it's been a while," CLSA Research. October 9, 2022.
- Data from JP Morgan, Bloomberg as of 9/30/2022.
Definitions:
MSCI China All Shares Index: The MSCI China All Shares Index captures large and mid-cap representation across China A‐shares, B‐shares, H‐shares, Red‐chips, P‐ chips, and foreign listings (e.g. ADRs). The index aims to reflect the opportunity set of China share classes listed in Hong Kong, Shanghai, Shenzhen, and outside of China. It is based on the concept of the integrated MSCI China equity universe with China A-shares included. The index was launched on June 26, 2014.
MSCI Emerging Markets (EM) Index: The MSCI Emerging Markets Index is a free-float weighted equity index that captures large and mid-cap representation across Emerging Market (EM) countries. The index covers approximately 85% of each country's free-float adjusted market capitalization. The index was launched on January 1, 2001.
S&P 500 Index: The S&P 500 Index is widely regarded as the best single gauge of large-cap U.S. equities. There is over USD 9.9 trillion indexed or benchmarked to the index, with indexed assets comprising approximately USD 3.4 trillion of this total. The index includes 500 leading companies and covers approximately 80% of available market capitalization. The index was launched on March 4, 1957.
MSCI EAFE Index (“EAFE”): The MSCI EAFE Index is an equity index, which captures large and mid-cap representation across Australia, Austria, Belgium, Denmark, Finland, France, Germany, Hong Kong, Ireland, Israel, Italy, Japan, the Netherlands, New Zealand, Norway, Portugal, Singapore, Spain, Sweden, Switzerland, and the UK. With 825 constituents, the index covers approximately 85% of each country's free float-adjusted market capitalization. The index was launched on March 31, 1986.
Earnings per Share (EPS): Earnings per share is calculated as a company's profit divided by the outstanding shares of its common stock.
Gross Domestic Product (GDP): Gross domestic product is the total monetary or market value of all the finished goods and services produced within a country’s borders in a specific time period.
Standard Deviation: The standard deviation is a statistic that measures the dispersion of a dataset relative to its mean and is calculated as the square root of the variance.
Downside Capture Ratio: the downside capture ratio is a statistical measure of an investment manager's overall performance in down markets. The ratio is calculated by dividing the manager's returns by the returns of the index during the down market period and multiplying that factor by 100.
Maximum Drawdown: The distance from the highest peak to the lowest trough over a certain time period for an investment.
Tracking Error: The degree to which an investment varies from a given benchmark, usually expressed as the difference between the investment's return and the benchmark's return over a given period.
MSCI Korea Index (referred to as Korea herein): Inception Date: March 31, 1989. The MSCI Korea Index is designed to measure the performance of the large and mid-cap segments of the South Korean market. The index covers about 85% of the Korean equity universe.
MSCI Taiwan Index (referred to as Taiwan herein): Inception Date: July 31, 1989. The MSCI Taiwan Index is designed to measure the performance of the large and mid-cap segments of the Taiwan market. The index covers about 85% of Taiwan's free float-adjusted market capitalization.
MSCI India Index (referred to as India herein): Inception Date: April 30, 1993. The MSCI India Index is designed to measure the performance of the large and mid-cap segments of the Indian market. The index covers approximately 85% of the Indian equity universe.
MSCI Brazil Index (referred to as Brazil herein): Inception Date: January 01, 2001. The MSCI Brazil Index is designed to measure the performance of the large and mid-cap segments of the Brazilian market. The index covers about 85% of the Brazilian equity universe.
MSCI Indonesia Index: The MSCI Indonesia Index is designed to measure the performance of the large and mid-cap segments of the Indonesian market. With 25 constituents, the index covers about 85% of the Indonesian equity universe. The index was launched on May 31, 1990.
MSCI Europe Index: The MSCI Europe Index captures large and mid cap representation across 15 Developed Markets (DM) countries in Europe*. With 434 constituents, the index covers approximately 85% of the free float-adjusted market capitalization across the European Developed Markets equity universe. The index was launched on March 31, 1986.
Bloomberg US Aggregate Bond Index: The Bloomberg US Aggregate Bond Index is a broad-based flagship benchmark that measures the investment grade, US dollar, fixed-rate taxable bond market. The index includes treasuries, government-related, and corporate securities, MBS (agency fixed-rate pass-throughs), ABS, and CMBS (agency and non-agency). The index was launched on January 1, 1976.
Bloomberg US Aggregate Corporate Bond Index: The Bloomberg US Aggregate Corporate Bond Index is a broad-based flagship benchmark that measures the investment grade, US dollar, fixed-rate taxable corporate bond market. The index was launched on January 1, 1976.
MSCI China Index: The MSCI China Index captures large and mid-cap representation across China A shares, H shares, B shares, Red chips, P chips and foreign listings (e.g. ADRs). With 703 constituents, the index covers about 85% of this China equity universe. Currently, the index includes Large Cap A and Mid-Cap A-shares represented at 20% of their free float adjusted market capitalization. The index was launched on October 31, 1995.
MSCI China A Index: The MSCI China A Index captures large and mid-cap representation across China securities listed on the Shanghai and Shenzhen exchanges. The index covers only those securities that are accessible through "Stock Connect". The index is designed for international investors and is calculated using China A Stock Connect listings based on the offshore RMB exchange rate (CNH). The index was launched on March 1, 2018.
MSCI Emerging Markets (EM) ex China Index: The MSCI Emerging Markets ex China Index captures large and mid cap representation across 26 of the 27 Emerging Markets (EM) countries excluding China. With 678 constituents, the index covers approximately 85% of the free float-adjusted market capitalization in each country. The index was launched on March 9, 2017.
MSCI All Country World Index (ACWI): The MSCI ACWI captures large and mid cap representation across 23 Developed Markets (DM) and 27 Emerging Markets (EM) countries*. With 2,978 constituents, the index covers approximately 85% of the global investable equity opportunity set. The index was launched on January 1, 2001.
MSCI ACWI ex USA Index: The MSCI ACWI ex USA Index captures large and mid cap representation across 22 of 23 developed markets countries, excluding the United States, and 24 emerging markets countries. With over 2,000 constituents, the index covers approximately 85% of the global equity opportunity set outside the US.
Bloomberg Dollar Index Spot (DXY): The US Dollar Index indicates the general international value of the US dollar. The index does this by averaging the exchange rates between the USD and major world currencies. The ICE US computes this by using the rates supplied by some 500 banks.
Global Financial Crisis: The Global Financial Crisis, also referred to as the Subprime Mortgage Crisis, was a financial meltdown that occurred from 2008 to 2009 after a broad swath of the mortgages underlying structured products that included mortgage-backed securities were defaulted upon. The crisis resulted in a recession in the United States and led to the passage of new securities and banking laws, such as the Dodd-Frank Wall Street Reform and Consumer Protection Act.