The Power of Rebalancing: Managing Emerging Market Volatility
Market sentiment can change on a dime and prices can move quickly, especially in emerging markets (EM). China’s repeal of COVID-19 restrictions caused the KraneShares CSI China Internet ETF (KWEB) to rise nearly 60%* in two months (From 10/31/2022 to 12/30/2022). This strong rebound came after a steady decline in the years prior.
*For KWEB standard performance, please click here.
The effect of this kind of volatility can be dizzying for investors as the allure of quick gains attracts short-term interest, while the fear of steep drops keeps many on the sidelines. We believe this is where rebalancing comes in handy. A thoughtfully executed rebalancing strategy may help blunt drawdowns while allowing an investor to maintain exposure when run ups do occur.
At KraneShares, we have developed tools to help advisors and other financial professionals navigate EM based on fundamental and technical signals. When building emerging markets exposure, we believe it is important for investors to treat China and EM ex China as separate asset classes, given their differentiated risk and return characteristics, and adhere to a disciplined rebalance schedule.
The Power of Rebalancing
Financial advisors understand the benefits of having a disciplined approach to managing multi-asset portfolios. While catching momentum can produce results, being disciplined in rebalancing back to investment policy weights is important. This strategy helps keep investors’ risk objectives in check and may improve long-term returns by taking gains in up markets and dollar cost averaging in down markets.
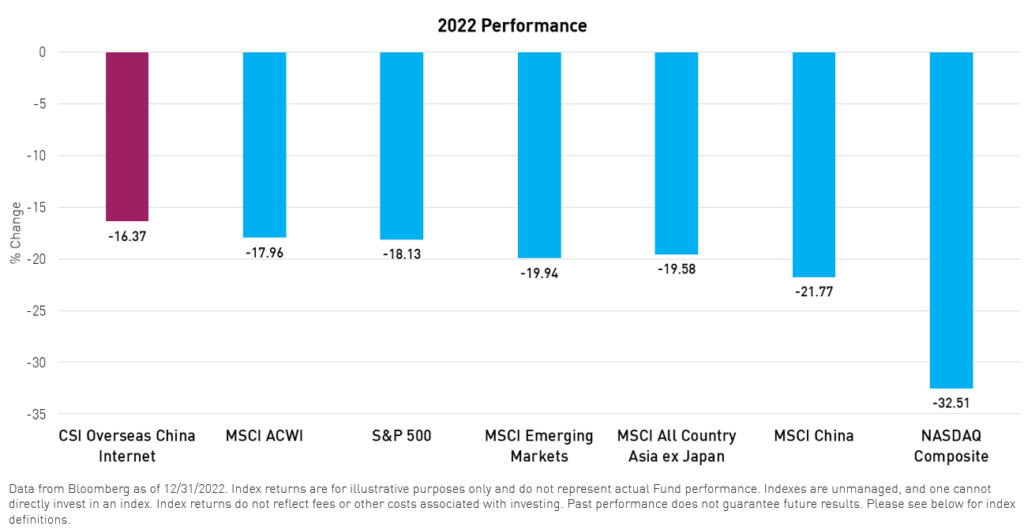
For example, while KWEB has been confronted by a challenging macroeconomic and regulatory environment over the past two years, its rebound at the end of 2022 was forceful. No one would have guessed that KWEB would turn around and outperform the NASDAQ Composite, S&P 500 and ACWI indexes last year, albeit while all markets were down significantly for the period. Nonetheless, many investors who had cut or eliminated their exposure due to poor momentum were left behind.
However, investors who had remained invested in KWEB and taken a risk-managed, long term, strategic approach benefitted from the rebound.
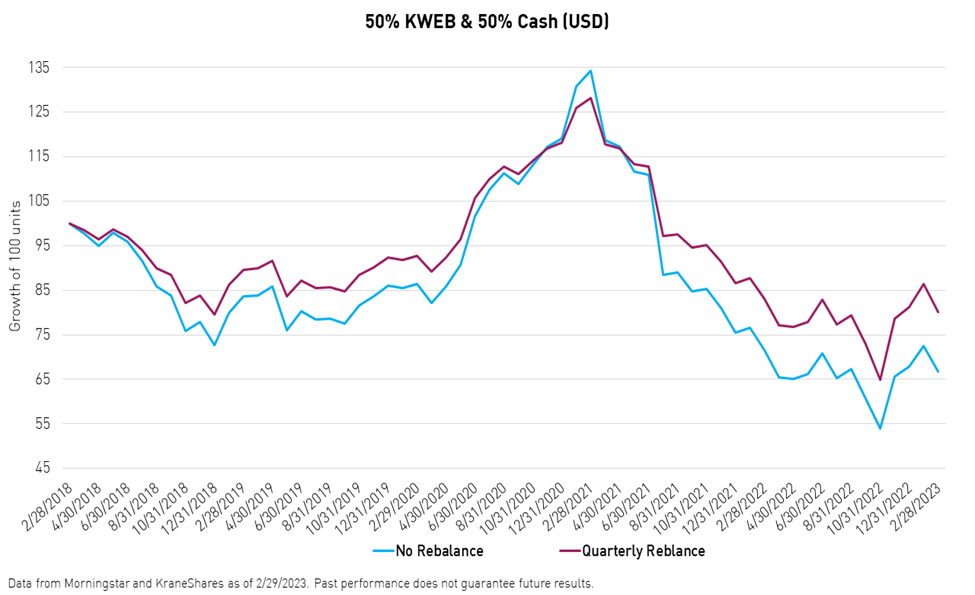
The chart below represents two portfolios consisting of 50% KWEB and 50% cash, a neutral asset class used here to demonstrate the impact that rebalancing can have on returns. The portfolio that rebalanced quarterly between cash and KWEB outperformed the same portfolio with no rebalance by 13.4%.
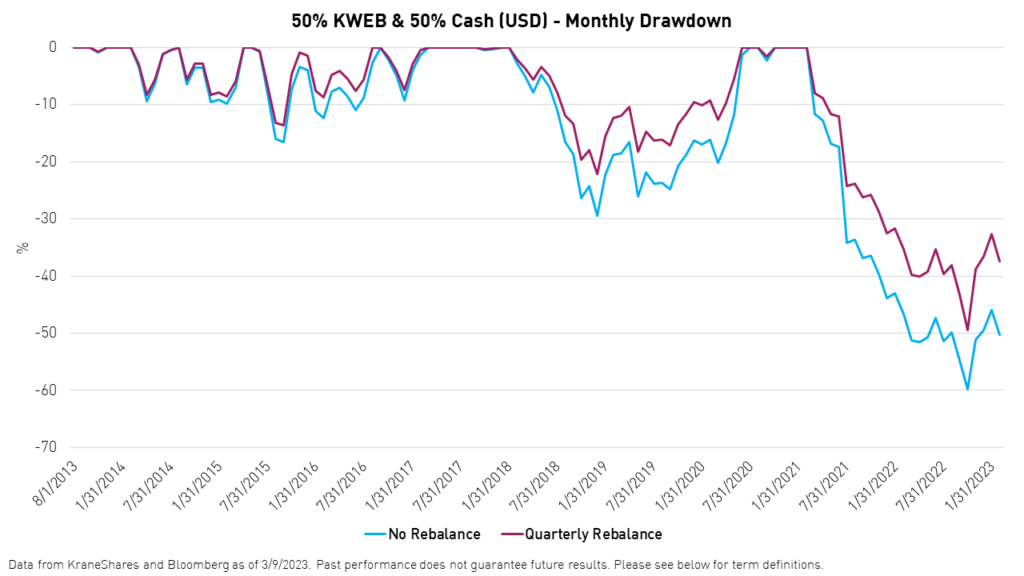
Rebalancing quarterly also helped reduce portfolio drawdown, as seen below.
How to Build A Better EM Allocation
We applied the same logic to investing in Emerging Markets more broadly when we built the Krane Dynamic Emerging Markets Strategy (KDEMS), which dynamically allocates between China and EM ex China based on fundamental, valuation, and technical signals, rebalancing at least quarterly.
Investors can implement a dynamic rotation strategy between the two asset classes on their own using the KraneShares MSCI All China Index ETF (Ticker: KALL) to represent China and the KraneShares MSCI Emerging Markets ex China Index ETF (Ticker: KEMX) to represent the rest of EM, which are the same ETFs that comprise KDEMS.
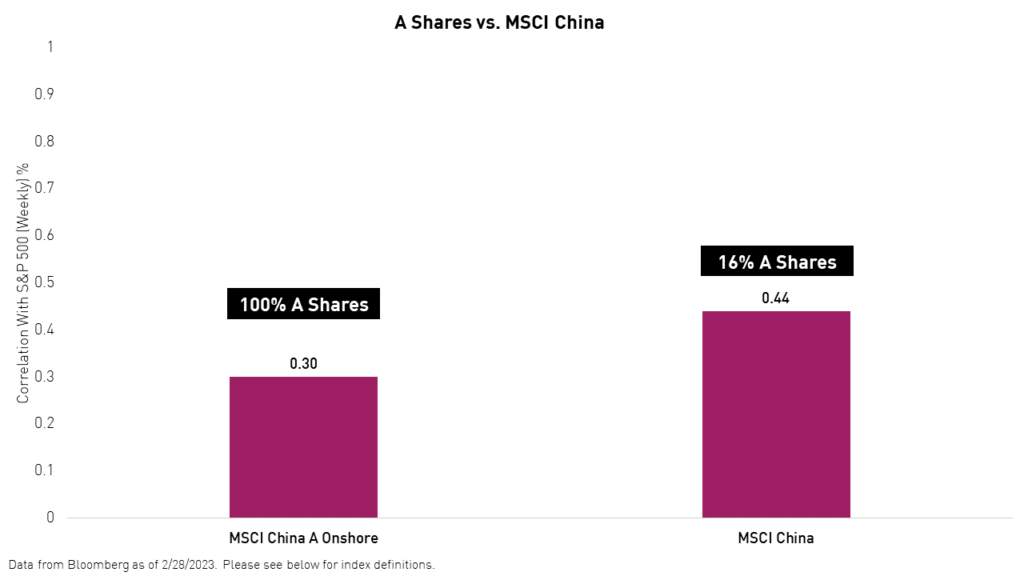
We believe KALL is the best representation of China because the Fund balances exposure to offshore China stocks (US and Hong Kong listings) and onshore China stocks (Shanghai and Shenzhen listings), also known as A shares, based on the total market capitalization of each respective share class. Other indexes, such as the MSCI China Index, arbitrarily limit their exposure to A shares, which tend to exhibit lower correlations to developed markets compared to offshore China stocks.
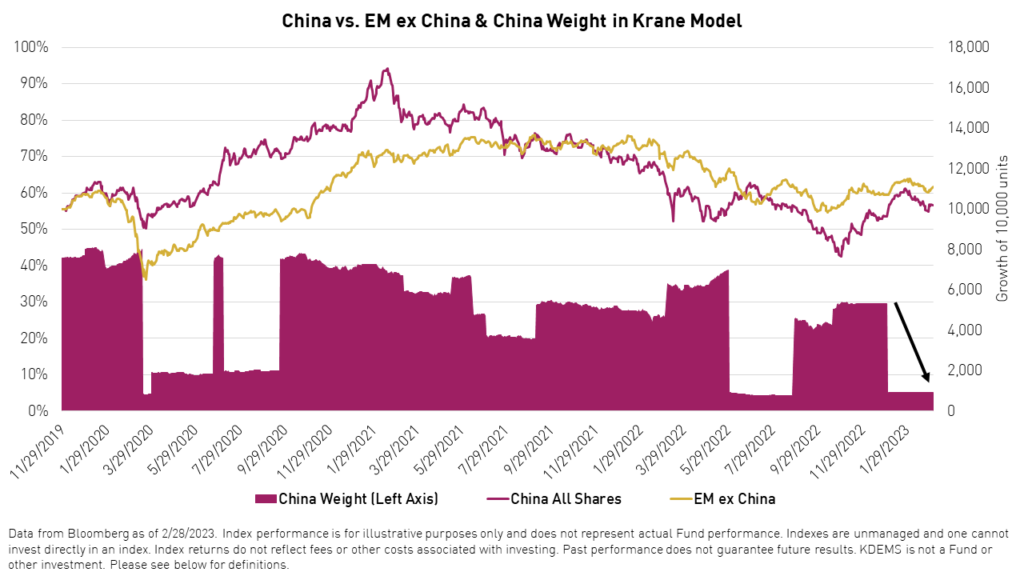
While many investors piled into China in January of 2023 due to the impressive rally that occurred in the last few months of 2022, KDEMS signaled an extreme dislocation between China and EM ex China valuations. As a result, the model’s allocation shifted to 95% EM ex China and 5% China at the beginning of the year. The signals indicated that China’s equity valuations may have run up too quickly ahead of fundamentals in the short term. To justify a higher weighting to China within the model, fundamentals, in the form of higher earnings’ growth expectations, must be revised higher first. While we do not believe that China’s run is over, EM ex China may have to catch up first.
KDEMS is for financial professionals only. Please click here for historical performance of the Krane Dynamic Emerging Markets Strategy and to subscribe to our signals.
Conclusion
We believe investors should not underestimate the power of rebalancing in their portfolio, especially within emerging markets. Furthermore, when building emerging markets exposure, we believe it is important for investors to treat China and EM ex China as separate asset classes, given their differentiated risk and return characteristics, and adhere to a disciplined rebalance schedule. This approach grants EM investors more control over portfolio risks and could improve risk-adjusted returns over the long term.
This content should not be regarded as investment advice or a recommendation of specific securities.
MSCI Emerging Markets Index: The MSCI Emerging Markets Index is a free-float weighted equity index that captures large and mid cap representation across Emerging Market (EM) countries. The index covers approximately 85% of the free-float adjusted market capitalization in each country. The index was launched on January 1, 2001.
CSI Overseas China Internet Index: The CSI Overseas China Internet Index selects overseas listed Chinese Internet companies as the index constituents; the index is weighted by free float market cap. The index can measure the overall performance of overseas listed Chinese Internet companies. The Index is within the scope of the IOSCO Assurance Report as at 30 September 2018. The index was launched on September 20, 2011.
MSCI China A Onshore Index: The MSCI China A Index captures large and mid-cap representation across China securities listed on the Shanghai and Shenzhen exchanges. The index was launched on May 10, 2005.
S&P 500 Index: The S&P 500 Index is widely regarded as the best single gauge of large-cap U.S. equities. There is over USD 9.9 trillion indexed or benchmarked to the index, with indexed assets comprising approximately USD 3.4 trillion of this total. The index includes 500 leading companies and covers approximately 80% of available market capitalization. The index was launched on March 4, 1957.
NASDAQ Composite Index: The Nasdaq Composite Index measures all Nasdaq domestic and international based common type stocks listed on The Nasdaq Stock Market. To be eligible for inclusion in the Index, the security's U.S. listing must be exclusively on The Nasdaq Stock Market (unless the security was dually listed on another U.S. market prior to January 1, 2004 and has continuously maintained such listing). The security types eligible for the Index include common stocks, ordinary shares, ADRs, shares of beneficial interest or limited partnership interests and tracking stocks. Security types not included in the Index are closed-end funds, convertible debentures, exchange traded funds, preferred stocks, rights, warrants, units, and other derivative securities. The index was launched on February 1, 1971.
MSCI All Country World Index (ACWI): The MSCI ACWI Index covers large and mid cap representation across 23 developed markets and 24 emerging markets countries. With 2,882 constituents, the index covers approximately 85% of the global investable equity opportunity set. The index was launched on May 31, 1990.
MSCI Asia ex Japan Index: The MSCI Asia ex Japan Index captures large and mid cap representation across 2 of 3 developed markets countries (excluding Japan) and 8 emerging markets countries in Asia. With 1,185 constituents, the index covers approximately 85% of the free float-adjusted market capitalization in each country. The index was launched on September 30, 1993.
Drawdown: The distance between the highest peak and lowest trough in an investment's value over a specific period. Drawdown, or maximum drawdown, is meant to show the maximum loss that an investor could have incurred over a period, assuming they could have invested at any point in time during that period.