China & Fed To Drive EM Performance
Executive Summary
- Many of the countries and sectors that have led emerging markets (EM) in terms of performance so far this year were lower in August amid a broad downdraft in EM equities.
- Despite a positive month in July and bright spots in certain sectors including semiconductors and clean technology, China’s economy and equity market continue to face significant challenges that underscore the need for more economic stimulus, which the government has begun to provide.
- Although EM ex China may also benefit from a potential US Federal Reserve rate hike pause, our model indicates that valuations in EM ex China may have run up too quickly in the first half of 2023, driven by technology shares, and China may have to catch up before the rally can continue.
- The KraneShares Dynamic Emerging Markets Strategy ETF (Ticker: KEM) is currently overweight China and underweight EM ex China compared to its benchmark, the MSCI Emerging Markets Index, and has a nearly 10% allocation to cash for downside protection.
Introduction
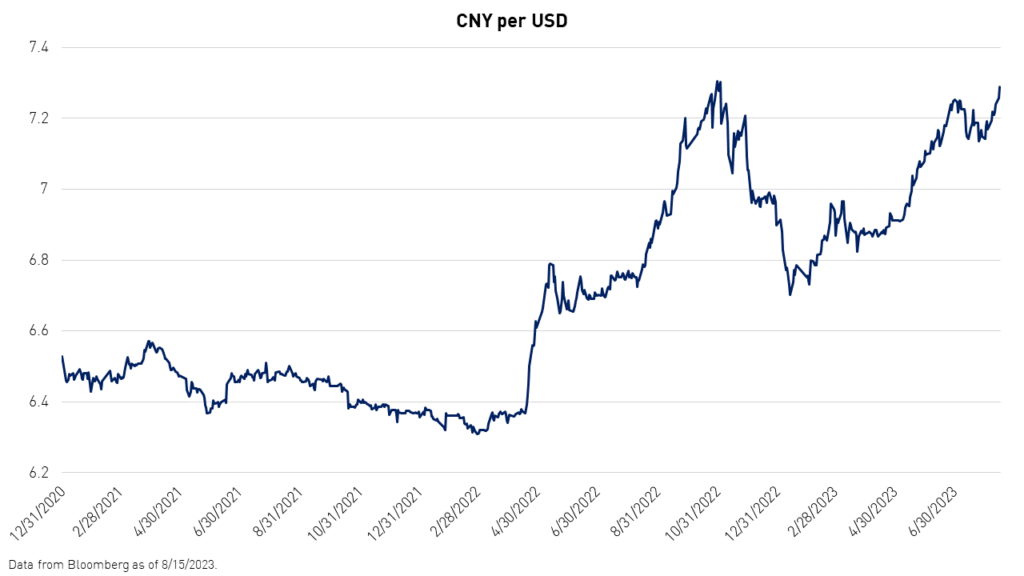
There have been numerous performance drivers in EM so far this year. However, one significant factor has been the negative effect of US dollar strength. Although US inflation has entered a downward trend, the Fed has indicated that it nonetheless may raise rates further as the US unemployment rate remains low. However, a U-turn away from rate hiking on the part of the Fed could provide relief for EM resulting from the expected weaker dollar.
Meanwhile, China’s asymmetric and atypical recovery has been a performance drag on EM and Asia so far this year. However, despite its economic challenges, China’s equities are attractive in terms of valuation, positioning, and growth expectations. Moreover, China’s government is starting to tackle the issues that have constrained its recovery.
A New EM Strategy
We have found that investors are noticing China's undervaluation and enduring opportunity set but some are hesitant to enter the market given the uncertainty. The KraneShares Dynamic Emerging Markets Strategy ETF (Ticker: KEM) attempts to solve this problem. KEM is an active ETF that provides investors with exposure to broad Emerging Market (EM) equities with risk management features. These include the ability to allocate to up to 10% to cash and the ability to dynamically adjust the portfolio’s China weight based on fundamental and technical signals.
China's equity market has a history of diverging from the rest of EM in terms of performance, and both China and EM can be subject to wild swings. We saw an example of this recently. Year-to-date (YTD) as of August 31, 2023, EM ex China, represented by the KraneShares Emerging Markets ex China Index ETF (Ticker: KEMX) has outperformed China, represented by the KraneShares China All Shares Index ETF (Ticker: KALL). So far this year, KEMX has gained 9.35% versus -4.43% for KALL.1 This year's EM ex China outperformance came after China had an impressive rally following the repeal of its zero COVID policy in November of last year. That rally lasted through the end of January, when KALL began to see declines.
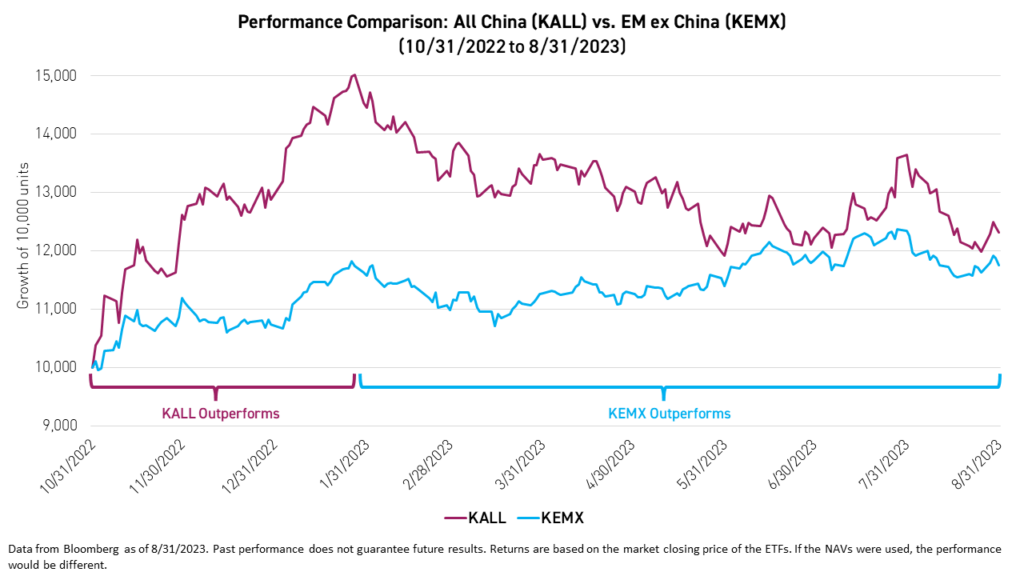
For KALL standard performance, please click here. For KEMX standard performance, please click here.
KEM was overweight China at the fund's launch on August 25th2 because our signals were telling us that the valuation differential between China and EM ex China may have become too extreme.
China As An Asset Class
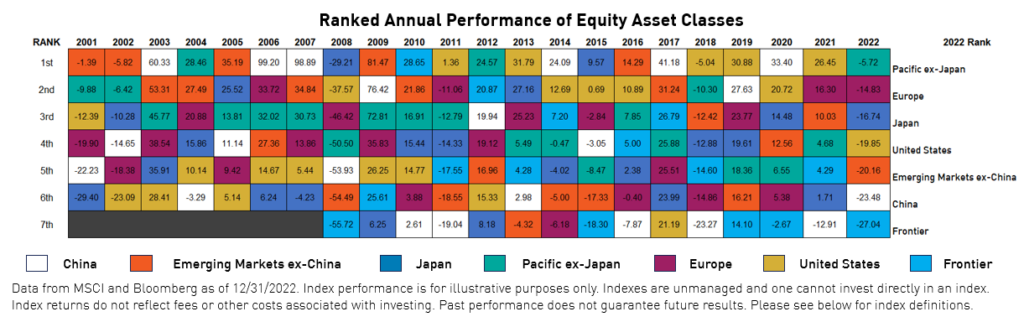
We were not surprised that KALL and KEMX diverged this year. This only reinforces our belief that by treating China and EM ex-China as separate within an EM allocation, investors have a higher potential of outperforming broad EM indexes with relatively static China weights. A yearly assessment of the divergence between China and EM ex-China shows an average performance difference of 8% on an annual basis since 2001, reaching as high as 21% in some years.
Emerging Markets Performance Review
The MSCI Emerging Markets Index is up 5.65% YTD.1 Emerging Markets ex China has led EM overall with a return of 10.63% YTD.1 Meanwhile, China is down -3.65% YTD.1 China’s onshore and offshore equities have performed relatively in line with one another, though offshore has outperformed slightly. South Korea, Taiwan, and Brazil are among the top performers in EM in 2023 so far. Meanwhile, China, Turkey, and South Africa are lagging.
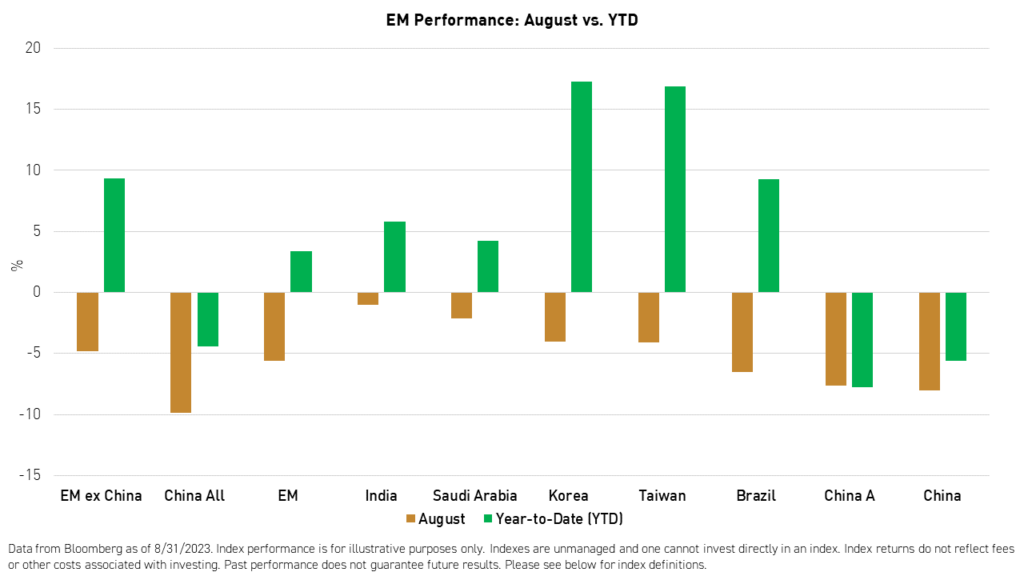
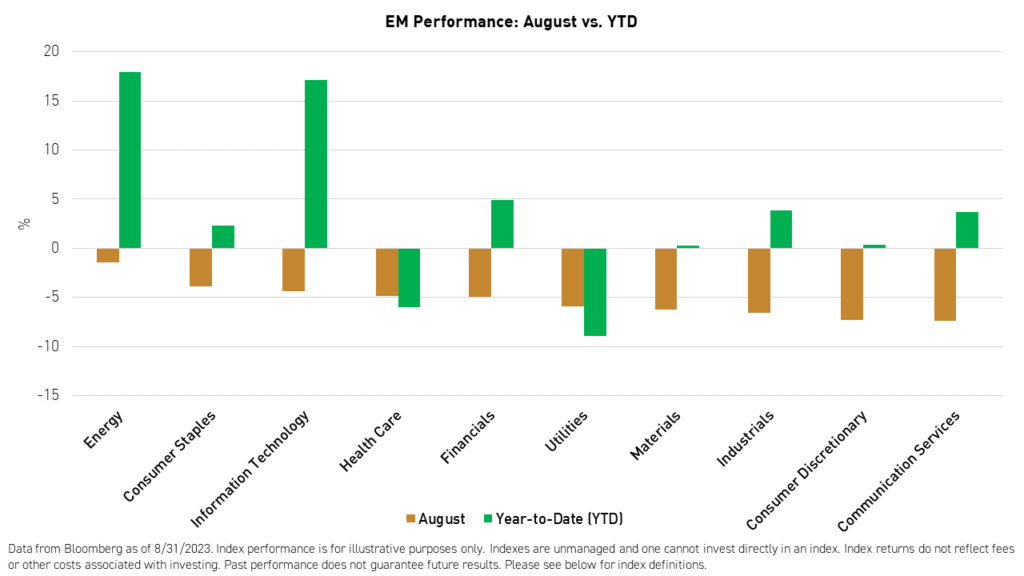
We saw a shift in EM in July as underperforming countries and sectors YTD outperformed. Then, in August, EM equities saw declines across the board. Meanwhile, from a sector perspective, energy has been the best performer YTD, followed by information technology.
China Performance Review
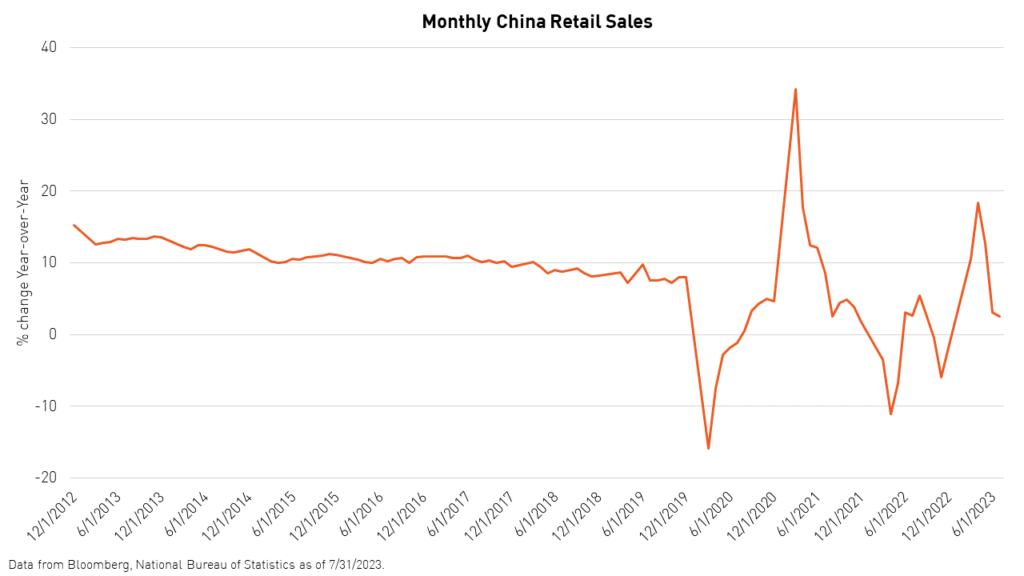
China’s recovery has been slower than expected. After a solid economic showing during the first quarter, Q2 economic data revealed a divergence between industrial production and consumption growth. The uneven recovery impacted investor confidence. Data also showed that there are other issues that China should be addressing such as youth unemployment, real estate, and local government debt. This came at a time of heightened political risks and an expanding interest rate differential between the US and China.
However, there have been bright spots in various sectors of the economy this year. Energy transition sectors, which include solar power generation equipment, electric vehicles, and nonferrous metals, along with the semiconductor sector, have performed well YTD. Government policies towards green industries continue to be supportive, and global demand remains healthy. On the semiconductor front, China’s aspiration to grow an independent chip industry has grown stronger.
Despite challenges and high youth unemployment, consumer savings grew further in 2023 to reach record levels. Meanwhile, companies’ fundamentals, especially in the internet sectors, are clearly on the mend, with multiple quarters of top and bottom-line growth improvement.
Despite high savings, Alibaba’s Q2 earnings showed that Chinese consumers are spending more than expected. The E-Commerce giant increased revenue by 14% year over year (5% ahead of consensus).1 Also, for the first time in many years, we saw analysts from major banks increase price targets for the stock.1
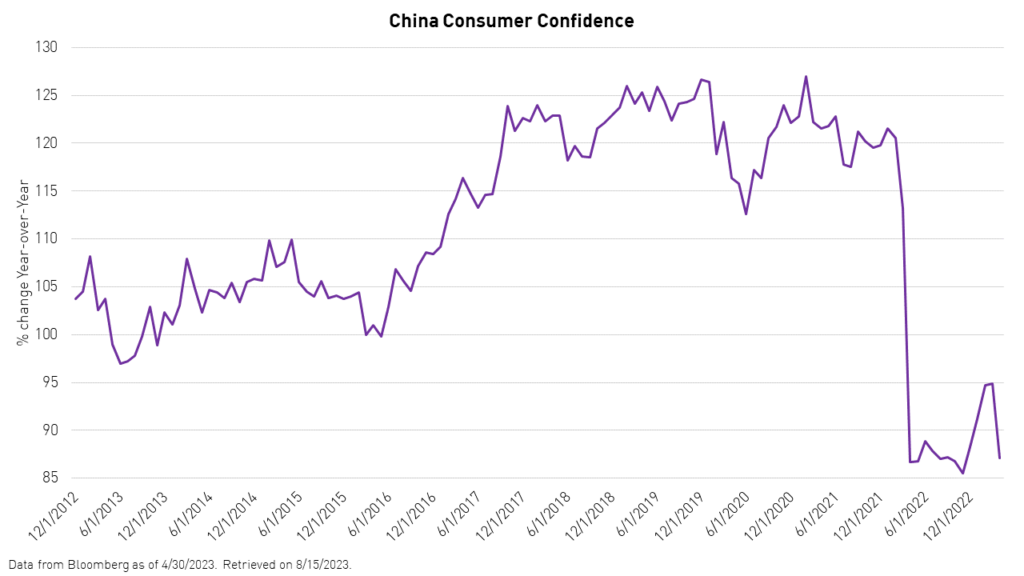
As the shock from the last two years and the current downward cycle in global growth continue to prove difficult, China needs a stimulus package worthy of the occasion. We believe the government must find a way to rebuild consumer and investor sentiment. In July, Premier Li met with internet company executives and pledged support for their businesses.3 This is a good start as these companies used to absorb a significant portion of new graduates from engineering and business schools before being targeted for regulations.
We believe China has the means and tools to redirect its economy. The government is trying to be prudent with stimulus and cautious with real estate, but they may have to put that battle on hold. China remains an island regarding growth potential, valuation, and positioning. We believe investors would do well to continue to be exposed for the long term, as a snapback can be quick and decisive.
While the language emanating from the last Politburo meeting continued to be conservative regarding broad stimulus, the actions that followed continue to speak volumes, in our opinion. We believe China will do what is necessary to lift growth.
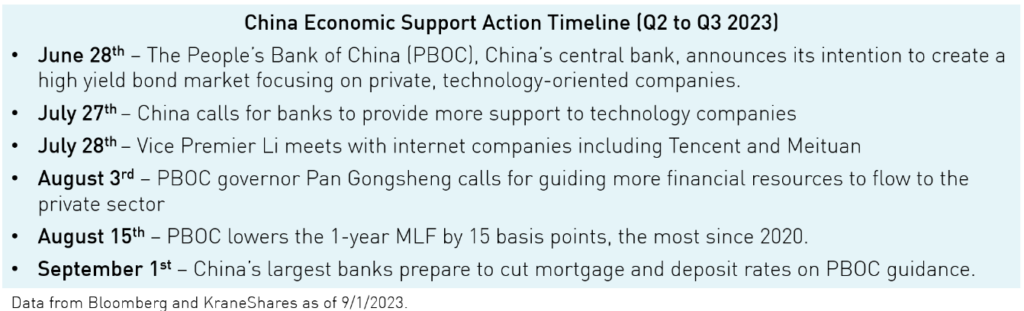
We believe China’s government’s focus on developers, technology companies, and the financing needs of private companies will help spur investment by private companies. This, in turn, may lead to a reduction in unemployment and an increase in consumer sentiment. Any indication that these policies are starting to impact macroeconomic data will, in our opinion, be an inflection point for China equities.
Emerging Markets ex China Performance
In the first half of the year, countries like South Korea and Taiwan had their moment in the sun after a difficult two years. Meanwhile, inflation and rates are declining in both countries.
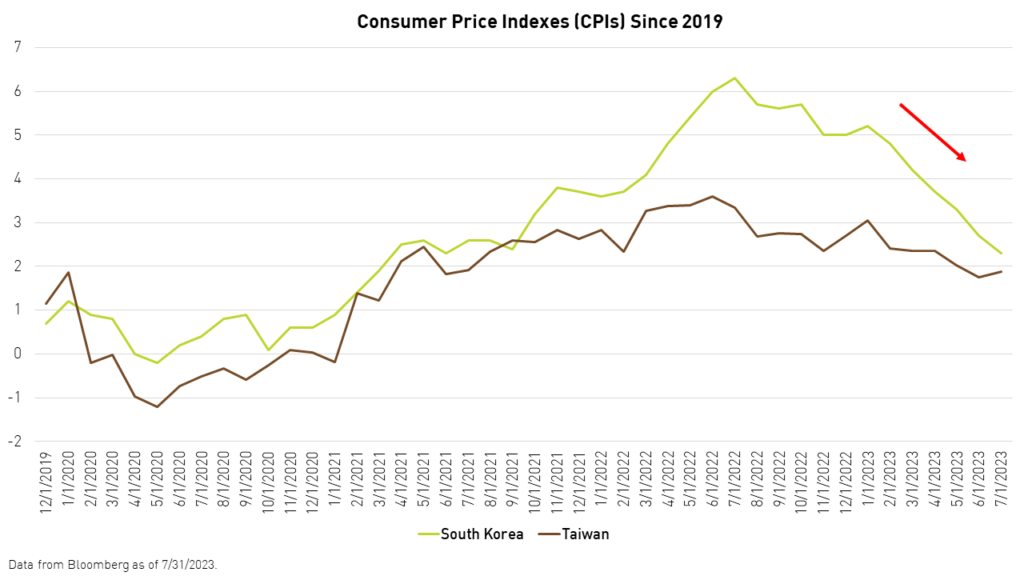
Also, sentiment toward semiconductor prices began to improve in anticipation of a second-half rebound as built-up excess inventories receded. At the same time, the global artificial intelligence (AI) frenzy reached new heights. This led South Korea's Samsung Electronics and Taiwan Semiconductor Manufacturing Co. (TSMC) to return 17.87% and +26.78%, respectively, YTD.1
Although it will take time for it to impact corporate revenues, we believe the development and deployment of AI-based technologies will have a profound impact on businesses across the globe, especially in emerging markets. AI may allow companies in EMs to upscale in terms of knowledge and efficiency faster than ever before.
But, before that happens, chipmakers such as Hynix, Samsung, TSMC, and other second-tier companies and suppliers could see tremendous growth right now and for the next five years, thanks to the technology’s intense demand for memory chips. This will continue to fuel gains in places such as Taiwan and South Korea and, in turn, emerging markets ex China, assuming South Korea continues to be included in MSCI’s definition of EM.
Moving westward, India has been a bright spot this year, rebounding on lower commodity prices and softer inflation. The country’s fundamental improvement and growth surprised analysts during the first quarter. Export industries and consumer discretionary both beat revenue expectations. India continues to be a favorite in EM despite its high valuation.
In the Americas, Brazil has been a top performer this year as growth has exceeded expectations and the country’s fiscal stance improved. Meanwhile, optimism about rate cuts also lifted the country's markets.
In the Middle East, Turkey continued to suffer in dollar terms following the reelection of Erdogan, who failed to gain foreign investors’ confidence even after appointing a capable head for the Central Bank.
Conclusion
Despite the US’ continued outperformance, we still believe an overwhelming number of indicators are pointing in the direction of a potential period of EM outperformance over the US. We believe record-high valuations in the US, comparatively low valuations in EM and especially in China, a higher growth trajectory in EM, peak US dollar, and peak US interest rates all point to a continued EM rally, potentially led by China. A U-turn away from rate hiking on the part of the Fed could provide more relief for EM resulting from the expected weaker dollar.
The KraneShares Dynamic Emerging Markets Strategy ETF (Ticker: KEM) is based on our Krane Dynamic Emerging Markets Strategy model portfolio, which has a three-year track record. For financial professionals interested in the model's track record or in learning more about Krane Model Portfolios, please click here.
Citations:
- Data from Bloomberg as of 8/31/2023
- Data from KraneShares as of 8/31/2023
- Yu, Evelyn. "China's Premier Li Meets Major Tech Companies, Vows More Support," Bloomberg News. July 12, 2023.
Index Definitions:
MSCI Emerging Markets Index ("EM" or "Emerging Markets"): The MSCI Emerging Markets Index is a free-float weighted equity index that captures large and mid-cap representation across Emerging Market (EM) countries. The index covers approximately 85% of each country's free-float adjusted market capitalization. The index was launched on January 1, 2001.
MSCI China Index ("China"): The MSCI China Index captures large and mid-cap representation across China A shares, H shares, B shares, Red chips, P chips and foreign listings (e.g. ADRs). With 703 constituents, the index covers about 85% of this China equity universe. Currently, the index includes Large Cap A and Mid-Cap A-shares represented at 20% of their free float adjusted market capitalization. The index was launched on October 31, 1995.
MSCI Europe Index ("Europe"): The MSCI Europe Index captures large and mid cap representation across 15 developed market countries in Europe. With 423 constituents, the index covers approximately 85% of the free-float adjusted market capitalization across the European developed markets. The index was launched on March 31, 1986.
MSCI Japan Index ("Japan"): The MSCI Japan Index is designed to measure the performance of the large and mid cap segments of the Japanese market. With 237 constituents, the index covers approximately 85% of the free float-adjusted market capitalization in Japan. The index was launched on March 31, 1986.
MSCI Emerging Markets ex China Index ("EM ex China"): The MSCI Emerging Markets ex China Index captures large and mid cap representation across 26 of the 27 Emerging Markets (EM) countries excluding China. With 678 constituents, the index covers approximately 85% of the free float-adjusted market capitalization in each country. The index was launched on March 9, 2017.
MSCI India Index (“India”): The MSCI India Index is designed to measure the performance of the large and mid-cap segments of the Indian market. With 115 constituents, the index covers approximately 85% of the Indian equity universe. The index was launched on April 30, 1992.
MSCI Saudi Arabia Index (“Saudi Arabia”): The MSCI Saudi Arabia Index is designed to measure the performance of the large and mid-cap segments of the Saudi Arabia market. The index incorporates foreign ownership limit restrictions. With 41 constituents, the index covers approximately 85% of the free float-adjusted market capitalization in Saudi Arabia. The index was launched on October 3, 2014.
MSCI Korea Index (“Korea”): The MSCI Korea Index is designed to measure the performance of the large and mid cap segments of the South Korean market. With 102 constituents, the index covers about 85% of the Korean equity universe. The index was launched on January 1, 2001.
MSCI Brail Index (“Brazil”): The MSCI Brazil Index is designed to measure the performance of the large and mid cap segments of the Brazilian market. With 47 constituents, the index covers about 85% of the Brazilian equity universe. The index was launched on January 1, 2001.
MSCI Emerging Markets Consumer Staples Index (“Consumer Staples”): The MSCI Emerging Markets Consumer Staples Index captures large and mid cap representation across 24 Emerging Markets (EM) countries*. All securities in the index are classified in the Consumer Staples sector as per the Global Industry Classification Standard (GICS®). The index was launched on September 15, 1999.
MSCI Emerging Markets Information Technology Index (“Information Technology”): The MSCI Emerging Markets Information Technology Index is designed to capture the large and mid-cap segments across 24 Emerging Markets (EM) countries*. All securities in the index are classified in the Information Technology sector according to the Global Industry Classification Standard (GICS®).
MSCI Emerging Markets Health Care Index (“Health Care”): The MSCI Emerging Markets Health Care Index is designed to capture the large and mid cap segments across 24 Emerging Markets (EM) countries* around the world. All securities in the index are classified in the Health Care sector as per the Global Industry Classification Standard (GICS®).
MSCI Emerging Markets Financials Index (“Financials”): The MSCI Emerging Markets Financials Index captures large and mid cap representation across 24 Emerging Markets (EM) countries*. All securities in the index are classified in the Financials sector as per the Global Industry Classification Standard (GICS®). The index was launched on January 1, 2001.
MSCI Emerging Markets Consumer Discretionary Index (“Consumer Discretionary”): The index is designed to measure the combined equity market performance of the consumer discretionary sector of emerging markets countries. The index was launched on January 1, 2001.
MSCI Emerging Markets Utilities Sector Index (“Utilities”): The EM Utilities Sector Index is a free-float weighted equity index. It was developed with a base value of 100 as of December 31, 1998. The parent index is the MSCI Emerging Markets Index.
MSCI Emerging Markets Industrials Index (“Industrials”): The MSCI EM Industrials Index is a free-float weighted equity index. It was developed with a base value of 100 as of December 1, 1998. The parent index is the MSCI Emerging Markets Index.
MSCI Emerging Markets Energy Sector Index (“Energy”): The MSCI EM Energy Sector Index is a free-float weighted equity index. It was developed with a base value of 100 as of December 31, 1998. The parent index is the MSCI Emerging Markets Index.
MSCI Emerging Markets Communication Services Index (“Communication Services”): The MSCI Emerging Markets Communication Services Net Total Return USD Index is a free-float weighted equity index. The parent index is the MSCI Emerging Markets Index. It is a GICS level 1 Index.
Drawdown: The distance between the highest peak and lowest trough in an investment's value over a specific period. Drawdown, or maximum drawdown, is meant to show the maximum loss that an investor could have incurred over a period, assuming they could have invested at any point in time during that period.
Sharpe Ratio: The Sharpe ratio compares the return of an investment with its risk. It's a mathematical expression of the insight that excess returns over a period may signify more volatility and risk, rather than investing skill.
Consumer Confidence Index The index aids in measuring consumer sentiments in personal finances, business conditions, among other topics. Historically, the index displays pessimism in consumers' confidence during recessionary periods, and increased consumer confidence in expansionary periods.
Consumer Price Index The Consumer Price Index (CPI) is a measure of the average change over time in the prices paid by urban consumers for a market basket of consumer goods and services
Retail sales is the sale of consumer goods, or final goods, by businesses to end consumers, and includes in-store sales as well as online sales.
Z-score is a statistical measurement that describes a value's relationship to the mean of a group of values. Z-score is measured in terms of standard deviations from the mean. If a Z-score is 0, it indicates that the data point's score is identical to the mean score.
China (as used in “Ranked Annual Performance of Equity Asset Classes”): From January 1, 2001 to May 9, 2005, this is represented by 31.15% the Shanghai Composite Index and 68.85% the MSCI China Index. From May 10, 2005 to November 1, 2008, this is represented by 31.15% the MSCI China A Onshore Index and 68.85% the MSCI China Index. From November 2, 2008 to June 25, 2014 this is represented by the MSCI China A Onshore Index, at a weighting equal to the percentage A-shares within the entire China investable equity market (month-to-month), and the MSCI China index for the remainder. From June 26, 2014 to the present, this is represented by the MSCI China All Shares Index. MSCI China All Shares Index: MSCI China All Shares Index captures large and mid-cap representation across China A shares, B shares, H shares, Red chips, P chips and foreign listings (e.g. ADRs). The index aims to reflect the opportunity set of China share classes listed in Hong Kong, Shanghai, Shenzhen and outside of China. It is based on the concept of the integrated MSCI China equity universe with China A-shares included.
MSCI China A Onshore Index ("China A"): The MSCI China A Onshore Index captures large and mid cap representation across China securities listed on the Shanghai and Shenzhen exchanges. Inception date: May 10, 2005. MSCI China Index: The MSCI China Index captures large and mid cap representation across China H shares, B shares, Red chips, P chips and foreign listings (e.g. ADRs). With 153 constituents, the index covers about 85% of this China equity universe. Inception date: Oct 31, 1995. Shanghai Composite Index: is a stock market index of all stocks that are traded at the Shanghai Stock Exchange.
Emerging Markets Excluding China and/or EM ex China and/or Emerging Markets ex China (as used in “Ranked Annual Performance of Equity Asset Classes”): This is represented by the MSCI Emerging Markets Ex China Index back to 3/9/2017 and, prior to that, the return of the MSCI Emerging Markets Index less the MSCI China Index, calculated monthly using the month-end weight of China within the MSCI Emerging Markets Index.