Emerging Markets Gear Up For Growth In 2024
By Anthony Sassine, CFA, Robin Zheng, and Henry Greene
Executive Summary
- As we approach 2024, the conditions for an emerging markets EM growth recovery continue to surface. In China, the recovery is underway, though the market is awaiting additional policy support for consumption.
- The US Federal Reserve's decision to keep its target interest rate unchanged in November bodes well for EM. A reversal in the US dollar's strength could lead to positive performance.
- Meanwhile, reducing a supply glut in lower-end semiconductors may benefit key technology-exporting markets such as Taiwan and Korea.
- Valuations in India, which has led performance in EM ex China in recent years, may have run up too far and may see a correction as we head towards 2024.
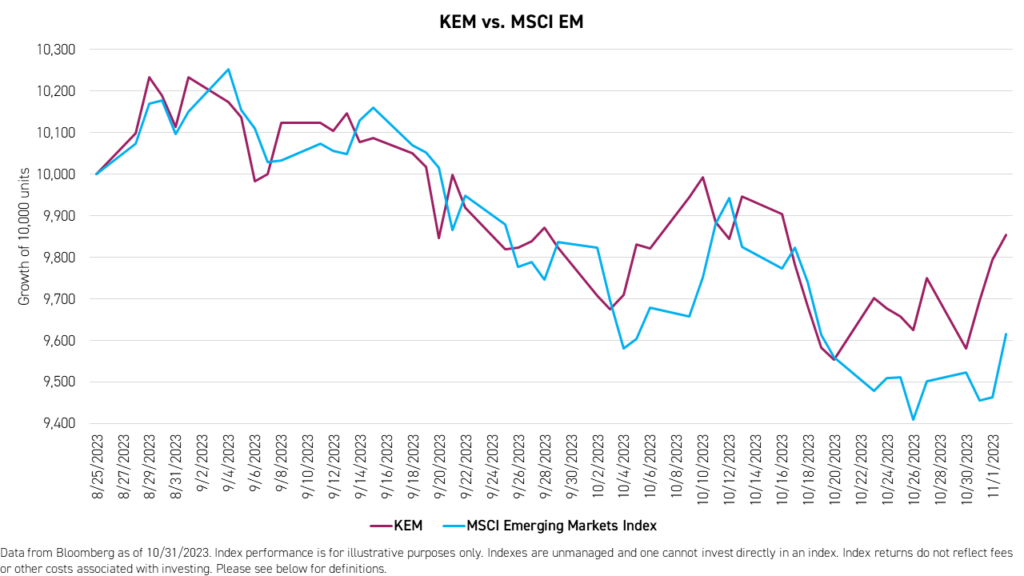
- The KraneShares Dynamic Emerging Markets ETF (Ticker: KEM) has outperformed the MSCI Emerging Markets Index since its launch, primarily thanks to its cash buffer, which the Fund has maintained throughout the period.
Introduction
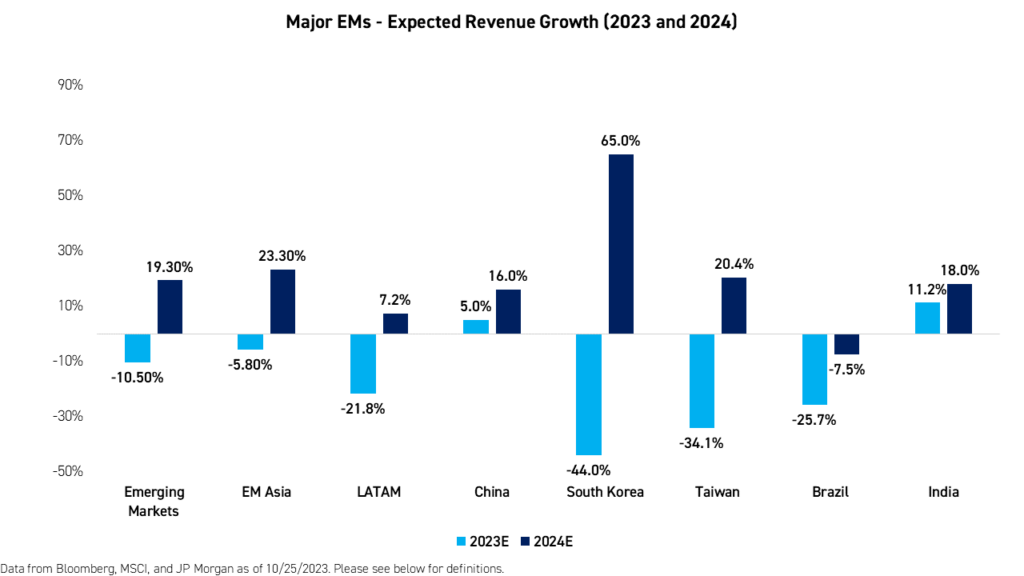
2023 has been a year of below-average growth for many major EM countries with mostly flat performance year-to-date. China’s recovery has been uneven, and Taiwan and Korea’s growth, which is highly tied to global growth and semiconductors, suffered. These conditions may change in 2024.
Time and government policy could accelerate China’s underappreciated growth trajectory soon. We expect semiconductor prices to recover as we approach 2024 due to depleted inventories and a new technology cycle. Furthermore, the US dollar, which has been a significant headwind for EM over the past few years, could reverse its course, considering its historically elevated levels. With US growth slowing amid high valuations, EMs are beginning to appear attractive. Given its lower valuation and higher growth potential than the rest of EM, China appears to have the best risk-return outlook within EM.
Last quarter, we launched the KraneShares Dynamic Emerging Markets Strategy ETF (Ticker: KEM). KEM dynamically adjusts its China weight based on both fundamental and technical signals with the option to take on a cash buffer in times of market stress. The ETF is based on two principles: (1) that China and the rest of EM should be treated as separate and distinct asset classes and (2) that EM can experience high volatility, overshooting, and undershooting valuations. Therefore, having the ability to allocate 10% of the ETF to cash can help cushion drawdowns.
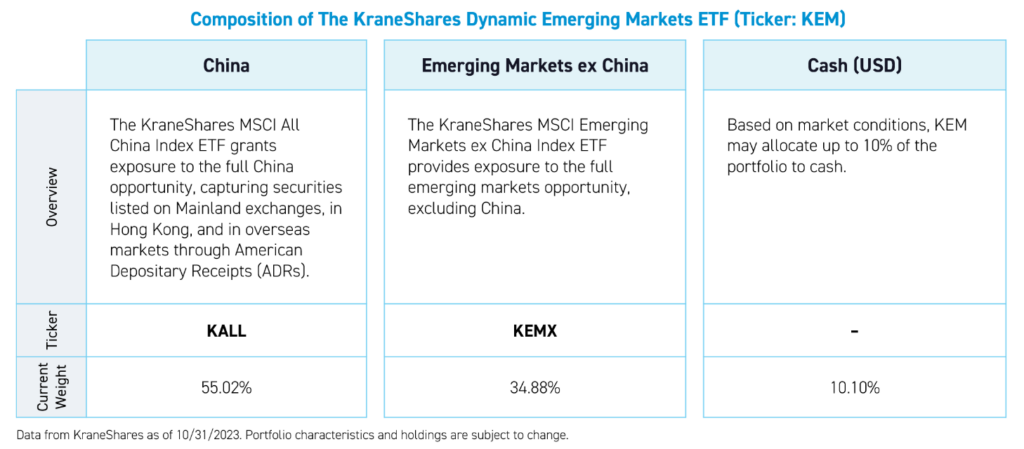
Within the portfolio, EM ex China is represented by the KraneShares MSCI Emerging Markets ex China Index ETF (Ticker: KEMX) and China is represented by the KraneShares MSCI All China Index ETF (Ticker: KALL).
KEM employs the same strategy as the Krane Dynamic Emerging Markets Strategy model portfolio, available for financial professional use only, which we have been running since March of 2021. Since its inception on August 25th, 2023, KEM has outperformed the MSCI Emerging Markets Index.
The performance data quoted represents past performance. Past performance does not guarantee future returns. The investment return and principal value of an investment will fluctuate so that an investor's shares, when sold or redeemed, may be worth more than or less than their original cost and current performance may be lower or higher than the performance quoted. For performance data current to the most recent month-end, please click here.
Current Positioning
In the first half of the year, EM ex China outperformed China. This outperformance was driven by the rise of Artificial Intelligence (AI), strong domestic dynamics in Brazil and India, and a lag in China due to a slow recovery. Following this rally, China’s relative attractiveness score within our model reached an extreme level compared to EM ex China. The relative attractiveness score is a combination of relative valuation and fundamentals that uses high-quality data from MSCI for the underlying fund holdings, including price to equity (P/E), P/E to long-term growth, forward P/E, and dividend growth.
Based on this score, the ETF had a maximum overweight China (+30% compared to the country’s weight in MSCI EM) at launch on August 25, 2023. The position reflects China’s lower valuations and better growth potential over EM ex-China. As markets began to deteriorate in August of 2023, the stop loss signal was triggered, resulting in a 10% cash position. As of the most recent rebalance for KEM, the portfolio was comprised of 55% KALL, 35% KEMX, and 10% Cash.
Emerging Markets Performance Update
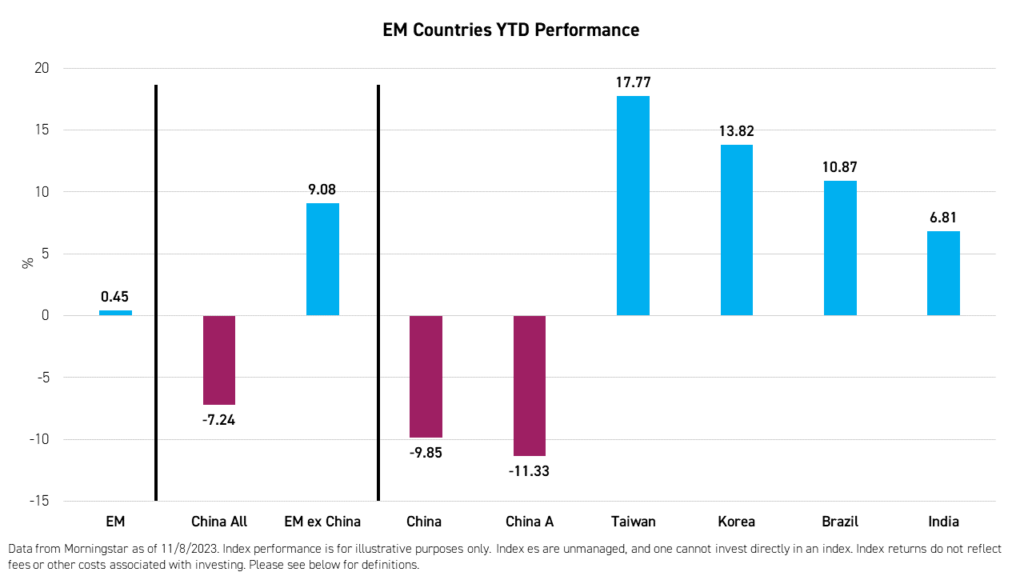
The MSCI Emerging Markets Index was down -2.93% in the third quarter and is flat (0.45%) year-to-date (YTD) as of November 8, 2023. The MSCI China All Shares Index outperformed the Emerging Markets ex China Index during the quarter (-2.72% vs. -3.33%). This quarterly outperformance closed part of the YTD performance gap between China and EM ex China, driven by a run up in semiconductor names and a slower-than-expected recovery in China.
So far this year, Taiwan, Brazil, and India continue to lead in performance, while MSCI China and MSCI China A continue to lag.
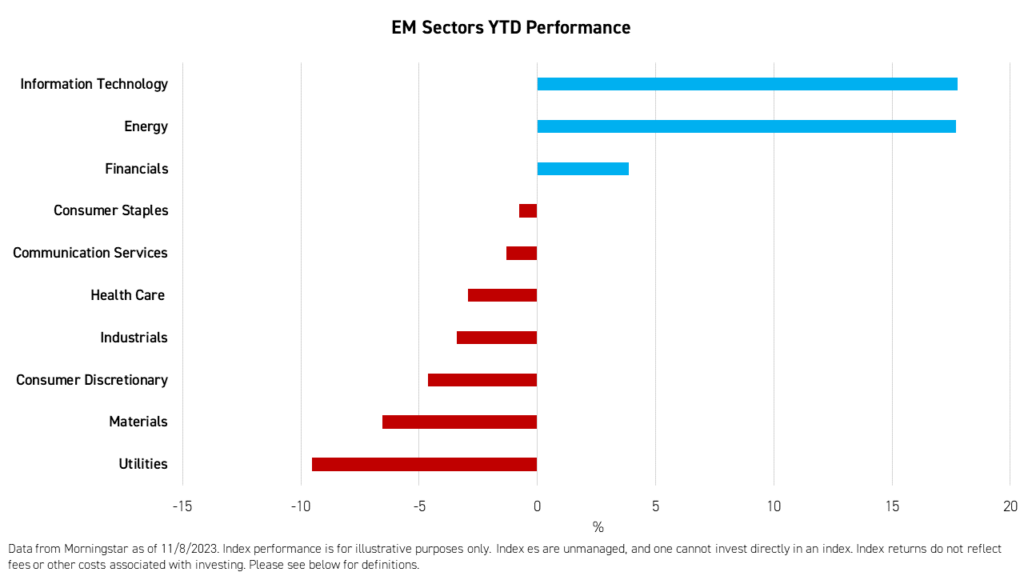
On a sector level, energy and information technology continue to lead YTD. Although semiconductor companies retreated slightly during the third quarter, they continue to top the list YTD. Energy was also supported by OPEC's controlled supply of daily barrels.
Utilities and Industrials were underperformers this year. Health Care has also suffered from a lack of policy direction and an anti-corruption campaign. Meanwhile, an oversupply following two tight years and an economic slowdown impacted the Materials sector. Consumer-related sectors also continue to lag, mainly driven by the low expectations for China’s consumer economy this year.
Macroeconomic Environment: The Reign of King Dollar Could Be Over
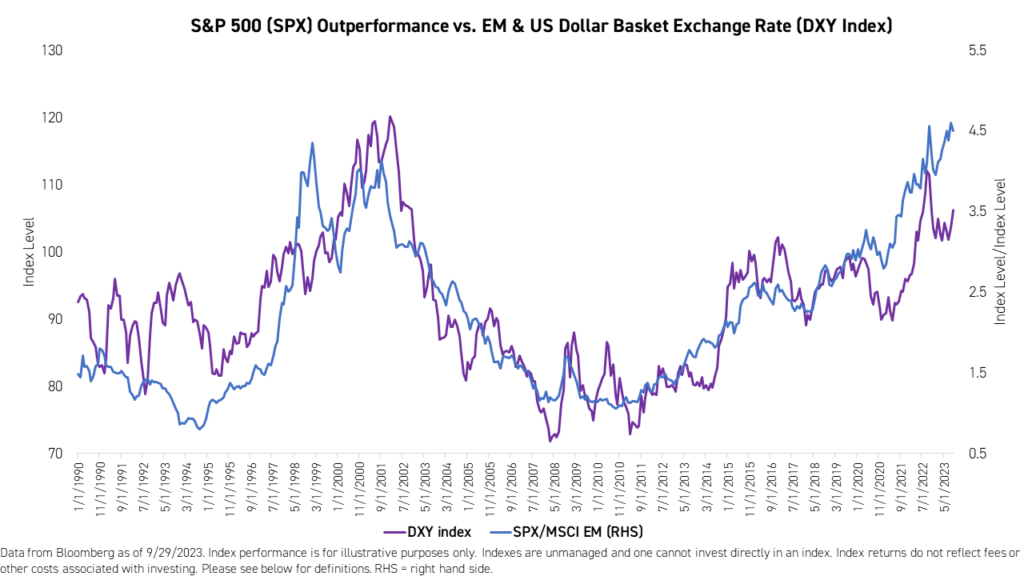
US interest rates have negatively impacted many emerging markets, whether directly through a rise in local interest rates and funding costs or indirectly by weakening the local currency's US dollar exchange rate, thereby driving up dollar-denominated borrowing costs. The value of the US dollar has been climbing steadily over the past two years compared to the currencies of the US’ top trading partners. These exchange rates have reached a level not seen since just after the “Dot Com” bubble in 2001.1
When will this trend reverse itself? The answer may lie in the details of the monthly US unemployment reports. For fourteen years, economists have watched inflation for clues regarding the Fed’s policy. However, with inflation on a downtrend, the focus has shifted to unemployment and growth. Despite the “progress” made on inflation, the Fed seems adamant about keeping rates higher for longer. However, any unemployment or economic growth setbacks in the US could trigger a shift in the Fed’s stance from tightening to easing, which would lead to a barrage of selling of US dollars to the benefit of EMs. We believe the dollar's trajectory could be the most crucial factor for EM in the short to medium term.
China Economic Update
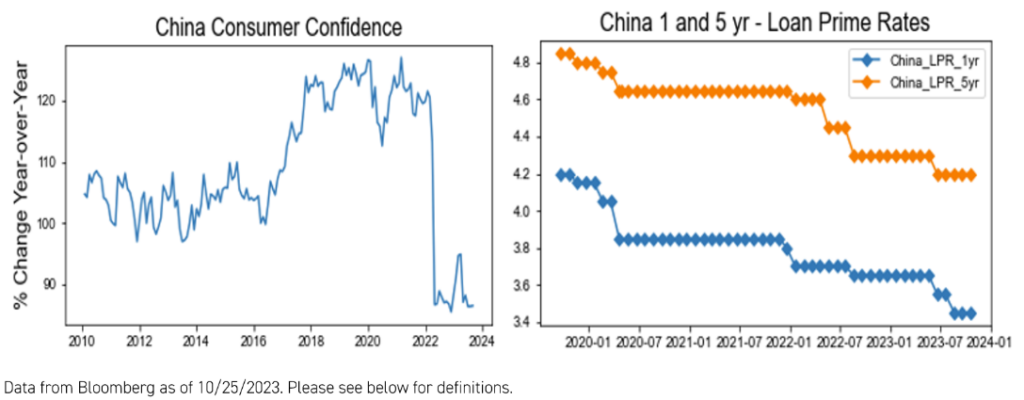
Consumption has recovered strongly in services and low-value goods but has yet to rebound for big-ticket items such as home appliances and building materials.
While the government has provided stimulus through rate cuts, infrastructure projects, and other policies, these measures have helped the industrial and manufacturing side of the economy more than consumption. In the short term, investors want to see more policies to increase domestic spending and provide job opportunities for the younger generation.
As part of the real estate tightening campaign that began in 2021, China’s government restricted households from taking on a second mortgage. Officials reversed this policy recently, allowing homebuyers to take on more than one mortgage once again. The change could result in a revival of real estate prices and consumer sentiment in the fourth quarter of 2023.
Furthermore, the government has placed a backstop on developers’ contract liabilities. Defaulted developers are likely to deliver homes nonetheless. The government has established special lending programs to ensure this happens and stop the erosion of consumer confidence. Once homes are on track to be delivered, we could see consumer confidence improve significantly.
Within retail sales, some categories have been growing faster than others. For instance, retail sales growth has ranged between 5% and 8% year-over-year over the past two months, but online sales have seen double-digit growth through over the same periods.1 The recent better-than-expected revenue growth for many E-Commerce companies in the second quarter reflected the faster growth of online retail sales. Also, lower-value product categories, such as apparel, have seen considerable increases in sales year-over-year.
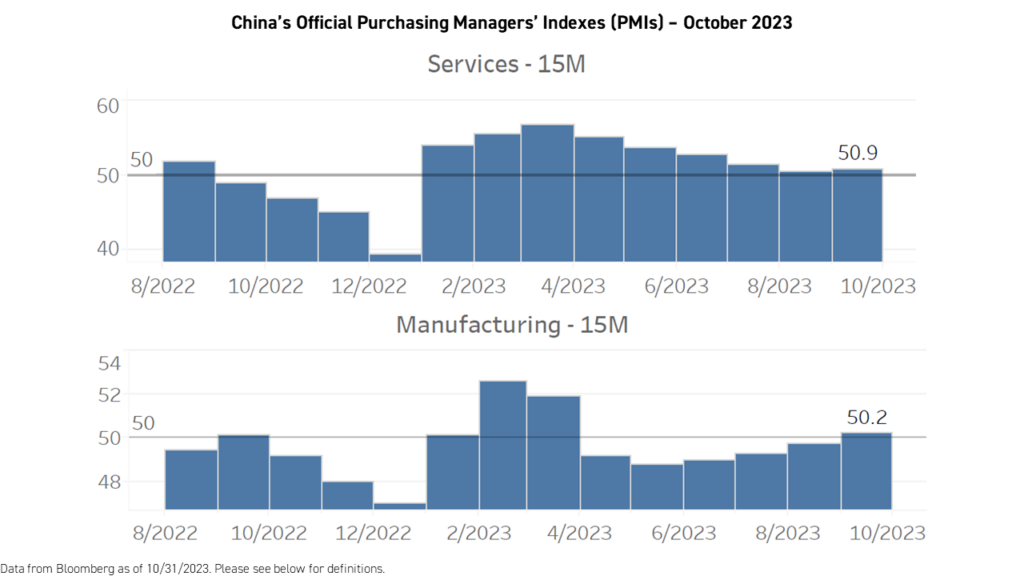
Within manufacturing, industrial production growth has been hovering around single digits. However, key industries including solar, electric vehicles, semiconductors, electric machinery, and raw materials production have seen double-digit production growth.
China has proven it can control its economic issues through sound financial and consumption policies. The government has the capacity to deliver more stimulus with $3 trillion in reserves, record consumer savings, the largest consumer market, and an exceedingly low sovereign debt-to-GDP ratio. China does not have a debt problem. Rather, it may need to issue more debt to stimulate its economy.
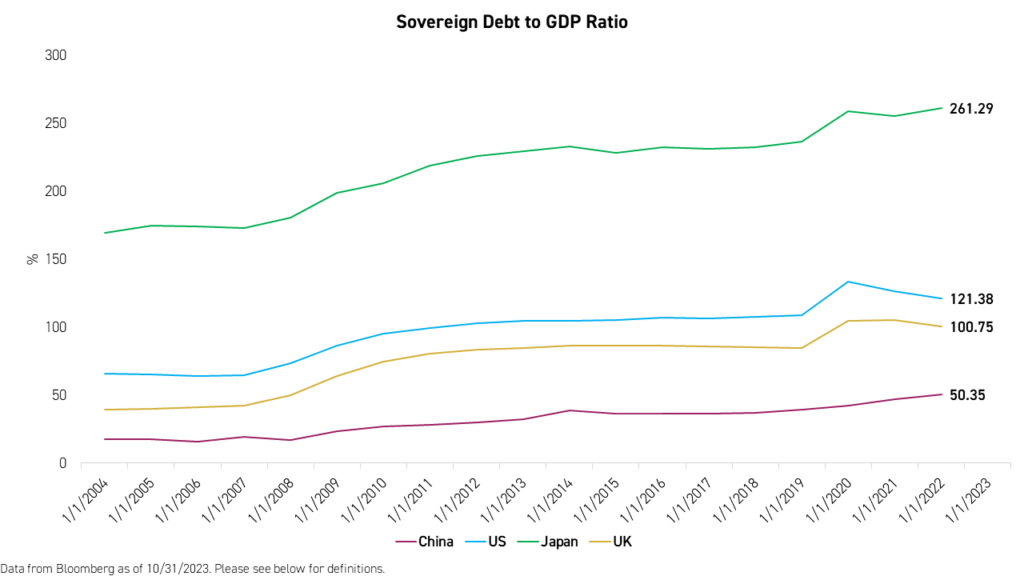
Fortunately, it has already begun to do so, albeit incrementally. China issued RMB 1 trillion in sovereign debt (0.8% of GDP) this year, increasing the country's fiscal deficit. The purpose of this issuance will be to shore up local government finances, which have been challenged by fewer land sales owing to the real estate deleveraging. Local governments have traditionally relied on land sales to provide funding for infrastructure projects. The new debt issuance has been expressly earmarked for infrastructure spending. Admittedly, this does not represent a broad, consumer-focused stimulus, but is a step in the right direction.
With a variety of tools and considerable resources at the government’s disposal, China can quickly respond to economic issues, though policymakers have so far chosen a conservative approach.
Emerging Markets ex China Update
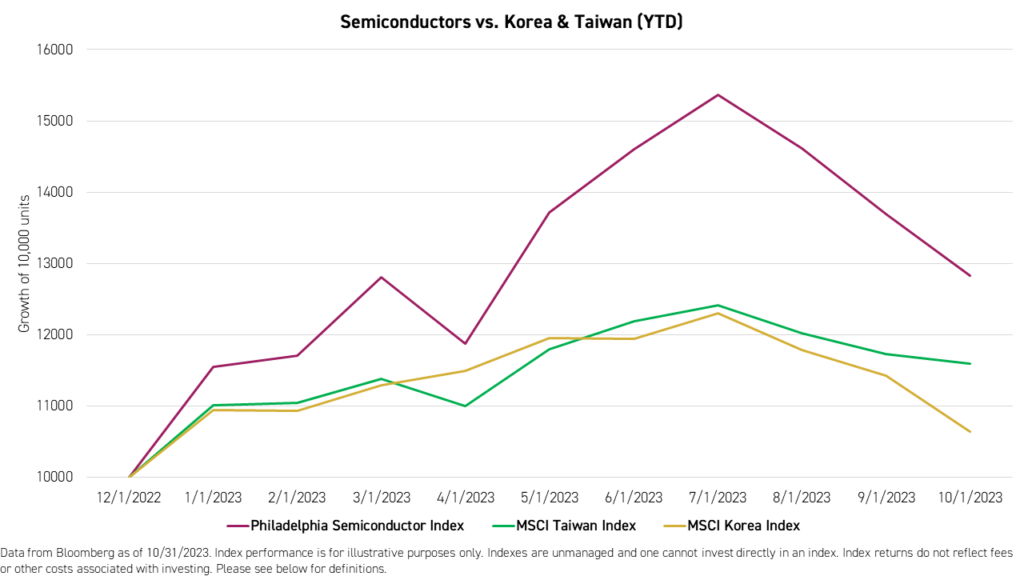
Emerging markets ex China had a solid first half of 2023, aided by the official emergence of Generative AI and Large Language Models (LLMs), first introduced by Chat GPT and later by Baidu, Google, and others. Taiwan and Korea produce most of the high-performance chips that these technologies require and therefore may benefit from this trend. This realization led to a revival in MSCI Taiwan and MSCI Korea indices following a challenging period driven by steep declines in the demand for low-end chips due to oversupply. However, the rally began to fade towards the end of July.
We expect Korea and Taiwan's growth to recover substantially in 2024 as demand for AI chips increases. Global semiconductor prices could recover by the end of this year as inventories recede.
In the short term, we believe valuations in these economies remain elevated, especially compared to China. The slowdown in economic growth globally and high oil prices may continue to pressure Korea’s current accounts. Taiwan’s exports, especially technology and AI-related, have been robust, while non-technology exports showed weakness. Growth could be moderate for the rest of the year.
Brazil has also had a good year as its GDP growth is tracking well above pre-COVID levels, registering 7.5% in Q1 and 3.7% in Q2, year-over-year (YoY).2 Strength in the agriculture and mining sectors has driven the country's growth this year. Meanwhile, below-target inflation has kept fiscal policy accommodative. However, recent economic data, such as PMIs and retail sales, are starting to show a deceleration in momentum.
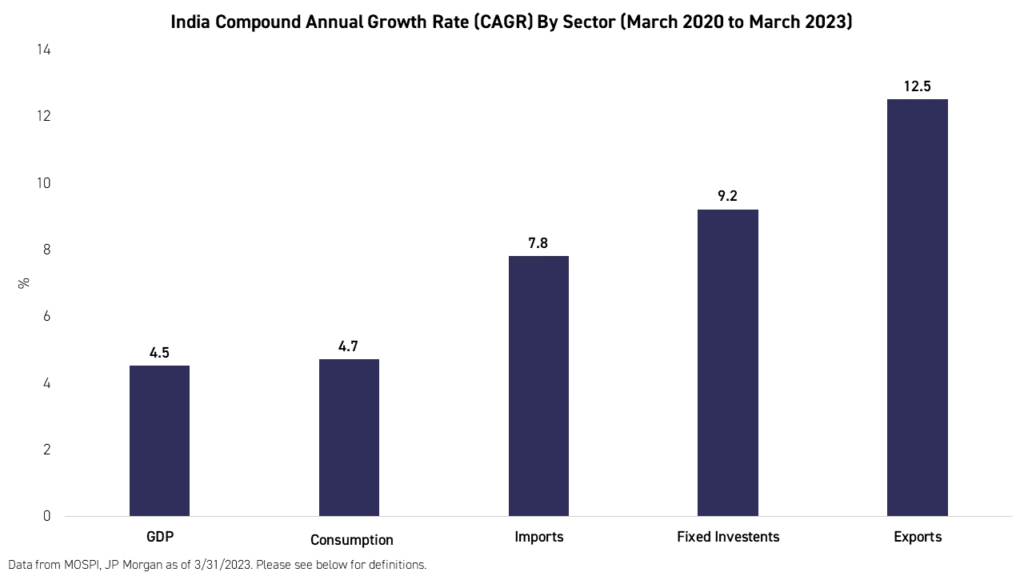
India continued its impressive post-COVID run this year. If not for the currency impact, the MSCI India Index would have been up +65.01% compared to +46.01% in dollar terms over the past three years. India was the best-performing country among the top seven MSCI EM countries by weight for the same period. Export growth in goods and services has been a primary growth driver over the past three years. Although domestic consumption has registered healthy growth, we do not believe it is enough to justify the current valuations of local firms. Meanwhile, India's valuations remain elevated compared to history and the MSCI Emerging Markets Index. We believe the risk-reward potential of India's equity market could be skewed negatively for the near future.
Conclusion
As we approach 2024, the conditions for an EM growth recovery continue to emerge. In China, the recovery is well underway, though would benefit from any additional policy support for consumption. We believe China’s government is aware of the issues, and it could only be a matter of time before we see announcements targeted to strengthen the safety net of Chinese citizens. We believe asset prices in China could increase quickly when the government announces support for consumption and continue to recover as economic data indicate progress.
Despite EM ex-China being more expensive than China, we expect growth in Korea and Taiwan to recover. We are happy with the current positioning of KEM, which is overweight China with a cash buffer.
We view KEM as continuing to be overweight China for the next few quarters or two as the gap between China and the rest of EM closes. However, following China’s expected recovery in 2024, the Fund could again rotate to overweight EM ex China.
Citations:
- Data from FactSet as of 10/31/2023.
- Data from Bloomberg as of 9/30/2023.
For KEM top 10 holdings, risks, and other Fund information, please click here.
This material contains the author's opinion. It should not be regarded as investment advice or a recommendation of specific securities. Holdings are subject to change. Securities mentioned do not make up the entire portfolio and, in the aggregate, may represent a small percentage of the Fund.
Definitions:
MSCI Emerging Markets Index: The MSCI Emerging Markets Index is a free-float weighted equity index that captures large and mid cap representation across Emerging Market (EM) countries. The index covers approximately 85% of the free-float adjusted market capitalization in each country. The index was launched on January 1, 2001.
MSCI China All Shares Index: The MSCI China All Shares Index captures large and mid-cap representation across China A‐shares, B‐shares, H‐shares, Red‐chips, P‐ chips and foreign listings (e.g. ADRs). The index aims to reflect the opportunity set of China share classes listed in Hong Kong, Shanghai, Shenzhen and outside of China. It is based on the concept of the integrated MSCI China equity universe with China A-shares included. The index was launched on June 26, 2014.
MSCI Emerging Markets ex China Index ("EM ex China"): The MSCI Emerging Markets ex China Index captures large and mid cap representation across 26 of the 27 Emerging Markets (EM) countries excluding China. With 678 constituents, the index covers approximately 85% of the free float-adjusted market capitalization in each country. The index was launched on March 9, 2017.
MSCI China Index ("China"): The MSCI China Index captures large and mid-cap representation across China A shares, H shares, B shares, Red chips, P chips and foreign listings (e.g. ADRs). With 703 constituents, the index covers about 85% of this China equity universe. Currently, the index includes Large Cap A and Mid-Cap A-shares represented at 20% of their free float adjusted market capitalization. The index was launched on October 31, 1995.
MSCI China A Index ("China A"): The MSCI China A Index captures large and mid-cap representation across China securities listed on the Shanghai and Shenzhen exchanges. The index covers only those securities that are accessible through "Stock Connect". The index is designed for international investors and is calculated using China A Stock Connect listings based on the offshore RMB exchange rate (CNH).
MSCI Taiwan Index ("Taiwan"): The MSCI Taiwan Index is designed to measure the performance of the large and mid cap segments of the Taiwan market. With 90 constituents, the index covers approximately 85% of the free float-adjusted market capitalization in Taiwan. The index was launched on July 31, 1989.
MSCI Brazil Index (“Brazil”): The MSCI Brazil Index is designed to measure the performance of the large and mid cap segments of the Brazilian market. With 47 constituents, the index covers about 85% of the Brazilian equity universe. The index was launched on January 1, 2001.
MSCI India Index (“India”): The MSCI India Index is designed to measure the performance of the large and mid-cap segments of the Indian market. With 115 constituents, the index covers approximately 85% of the Indian equity universe. The index was launched on April 30, 1992.
MSCI Korea Index (“Korea”): The MSCI Korea Index is designed to measure the performance of the large and mid cap segments of the South Korean market. With 102 constituents, the index covers about 85% of the Korean equity universe. The index was launched on January 1, 2001.
MSCI Emerging Markets Energy Sector Index (“Energy”): The MSCI EM Energy Sector Index is a free-float weighted equity index. It was developed with a base value of 100 as of December 31, 1998. The parent index is the MSCI Emerging Markets Index.
MSCI Emerging Markets Information Technology Index (“Information Technology”): The MSCI Emerging Markets Information Technology Index is designed to capture the large and mid-cap segments across 24 Emerging Markets (EM) countries*. All securities in the index are classified in the Information Technology sector according to the Global Industry Classification Standard (GICS®).
MSCI Emerging Markets Financials Index (“Financials”): The MSCI Emerging Markets Financials Index captures large and mid cap representation across 24 Emerging Markets (EM) countries*. All securities in the index are classified in the Financials sector as per the Global Industry Classification Standard (GICS®). The index was launched on January 1, 2001.
MSCI Emerging Markets Communication Services Index (“Communication Services”): The MSCI Emerging Markets Communication Services Net Total Return USD Index is a free-float weighted equity index. The parent index is the MSCI Emerging Markets Index. It is a GICS level 1 Index.
MSCI Emerging Markets Industrials Index (“Industrials”): The MSCI EM Industrials Index is a free-float weighted equity index. It was developed with a base value of 100 as of December 1, 1998. The parent index is the MSCI Emerging Markets Index.
MSCI Emerging Markets Consumer Discretionary Index (“Consumer Discretionary”): The index is designed to measure the combined equity market performance of the consumer discretionary sector of emerging markets countries. The index was launched on January 1, 2001.
MSCI Emerging Markets Materials Index ("Materials"): The MSCI Emerging Markets Materials Index captures large and mid cap representation across 24 Emerging Markets (EM) countries*. All securities in the index are classified in the Materials sector as per the Global Industry Classification Standard (GICS®). The index was launched on September 15, 1999.
MSCI Emerging Markets Health Care Index (“Health Care”): The MSCI Emerging Markets Health Care Index is designed to capture the large and mid cap segments across 24 Emerging Markets (EM) countries* around the world. All securities in the index are classified in the Health Care sector as per the Global Industry Classification Standard (GICS®).
MSCI Emerging Markets Utilities Sector Index (“Utilities”): The EM Utilities Sector Index is a free-float weighted equity index. It was developed with a base value of 100 as of December 31, 1998. The parent index is the MSCI Emerging Markets Index.
MSCI Emerging Markets Consumer Staples Index ("Consumer Staples"): The MSCI Emerging Markets Consumer Staples Index captures large and mid cap representation across 24 Emerging Markets countries. All securities in the index are classified in the Consumer Staples sector as per the Global Industry Classification Standard (GICS). The index was launched on September 15, 1999.
S&P 500 Index: The S&P 500 Index is widely regarded as the best single gauge of large-cap U.S. equities. There is over USD 9.9 trillion indexed or benchmarked to the index, with indexed assets comprising approximately USD 3.4 trillion of this total. The index includes 500 leading companies and covers approximately 80% of available market capitalization. The index was launched on March 4, 1957.
Bloomberg Dollar Spot Index ("DXY Index"): The Bloomberg Dollar Spot Index tracks the performance of a basket of ten leading global currencies versus the U.S. Dollar. Each currency in the basket and its weight is determined annually based on their share of international trade and FX liquidity. The index data starts from December 31, 2005 with a base level of 1000.
Consumer Confidence Index The index aids in measuring consumer sentiments in personal finances, business conditions, among other topics. Historically, the index displays pessimism in consumers' confidence during recessionary periods, and increased consumer confidence in expansionary periods.
Loan Prime Rate (LPR): The rate that commercial banks charge their most creditworthy corporate customers.
Purchasing Managers’ Index (PMI): The Purchasing Managers' Index (PMI) is an index of the prevailing direction of economic trends in the manufacturing and service sectors. It consists of a diffusion index that summarizes whether market conditions, as viewed by purchasing managers, are expanding, staying the same, or contracting. A reading above 50 indicates expansion and a reading below 50 indicates contraction.
Gross Domestic Product (GDP): Gross domestic product (GDP) is the total monetary or market value of all the finished goods and services produced within a country’s borders in a specific time period.
Philadelphia Semiconductor Index: The Philadelphia Stock Exchange (PHLX) Semiconductor Index (SOX Index) is a modified market-capitalization-weighted index composed of companies primarily engaged in the design, manufacture, and sale of semiconductors. The index was launched on December 1, 1993.
Compound Annual Growth Rate (CAGR): The mean annual growth rate of an investment over a specified period of time longer than one year. It represents one of the most accurate ways to calculate and determine returns for individual assets, investment portfolios, and anything that can rise or fall in value over time.
Retail Sales: Total sales of consumer goods and services in an economy over a given period of time, in this case one year at monthly reading intervals.
Revenue Growth: The change in the sum of the value of goods and services sold by a company over a given period of time before accounting for the cost of goods sold, interest, depreciation, taxes, or amortization associated with the sales.