Krane Funds Advisors, LLC is the investment manager for KraneShares ETFs. KraneShares offers innovative investment solutions tailored to three key pillars: China, Climate, and Uncorrelated Assets. Our team is determined to provide industry-leading, differentiated, and high-conviction investment strategies that offer access to key market trends. Our mission is to empower investors with the knowledge and tools necessary to capture the importance of these themes as an essential element of a well-designed investment portfolio.

April 11, 2024 – Talk Your Book: Building Confidence in China Equity Investing
April 9, 2024 – Many Investors Are More Exposed to China Than They Think, Says Brendan Ahern
April 2, 2024 – Emerging Markets ‘Well-Positioned’ for Growth: Strategist

March 28, 2024 – China’s BYD Has ‘Superior Manufacturing and Vertical Integration,’ Strategist Says
Our semi-monthly topical research reports. Subscribe to our weekly mailing list for more.
Information about KraneShares ETFs, China's markets and culture, and general investing resources.
Our market update is a collaboration between the KraneShares internal research department, our local Chinese partners, and select China thought leaders from around the world. Our goal is to deliver a differentiated perspective on Chinese capital markets, business, government, and culture.
280 Park Avenue, 32nd Floor
New York, NY 10017
1 Embarcadero Center, Suite 2350
San Francisco, CA 94111
181 Queen Victoria Street
London EC4V 4EG
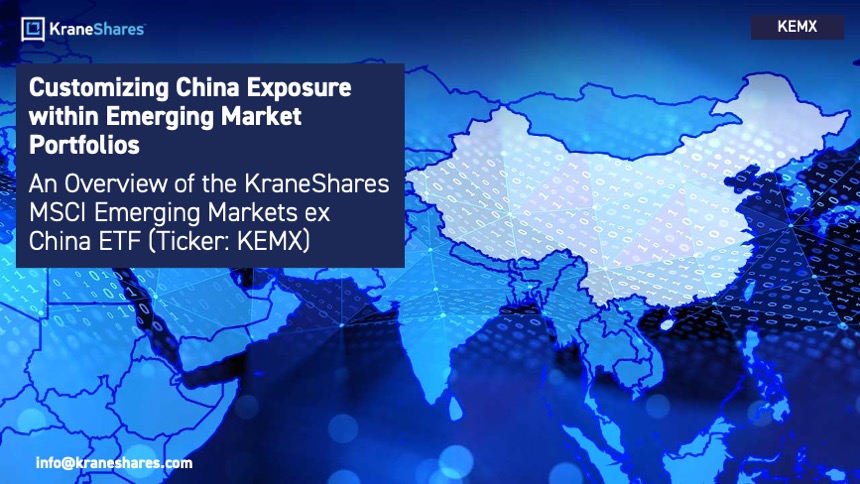
KEMX is benchmarked to the MSCI Emerging Markets ex China Index, which tracks large-cap and mid-cap companies within emerging market countries, excluding China. KEMX enables investors to build tailored Emerging Market (EM) portfolios when combined with exposure to China. KEMX can be paired with KraneShares China-focused core and thematic funds to establish strategic positions in China without duplicating exposures.
| Ticker | KEMX |
| Primary Exchange | NYSE |
| CUSIP | 500767769 |
| ISIN | US5007677694 |
| Net Assets | $76,118,432 |
| Total Annual Fund Operating Expense (Gross) | 0.59% |
| Total Annual Fund Operating Expense (Net) | 0.24%* |
| Inception Date | 04/12/2019 |
| Distribution Frequency | Annual |
| Daily Net Asset Value (NAV) and Market Price | |
| NAV | $28.19 |
| NAV Daily Change | 0.61% |
| Market Price | $27.89 |
| Market Price Daily Change | -0.57% |
| 30 Day Median Bid/Ask Spread |
0.24% |
| The ETF’s 30 Day Median Bid-Ask Spread is calculated by identifying the ETF’s national best bid and national best offer ("NBBO") as of the end of each 10 second interval during each trading day of the last 30 calendar days and dividing the difference between each such bid and offer by the midpoint of the NBBO. The median of those values is identified and that value is expressed as a percentage rounded to the nearest hundredth. | |
| NAV | Market Price | Premium/Discount |
| $28.19 | $27.89 | $-0.30 |
| 2023 Full Year | Q1 2024 | Q2 2024 | |
| Days traded at premium | 224 | 61 | 11 |
| Days traded at NAV | 0 | 0 | 0 |
| Days traded at discount | 25 | 0 | 3 |
The Premium/Discount History chart demonstrates the difference between the daily market price of shares of the Fund and the Fund’s net asset value (NAV). The vertical axis of the chart shows the premium or discount of the daily market price as a percentage of the NAV. The horizontal axis shows each trading day in the time period, and each data point in the chart represents the Premium/Discount on that day. The data presented in the chart and table above represent past performance and cannot be used to predict future results.
| Fund NAV | Closing Price | Index | |
| 1 Month | 3.01% | 3.17% | 3.00% |
| 3 Month | 2.47% | 2.88% | 4.01% |
| 6 Month | 15.77% | 16.74% | 17.56% |
| YTD | 2.47% | 2.88% | 4.01% |
| Since Inception | 35.42% | 36.50% | 32.63% |
| Fund NAV | Closing Price | Index | |
| 1 Year | 18.26% | 18.07% | 20.51% |
| 3 Year | 1.48% | 1.69% | 2.16% |
| Since Inception | 6.28% | 6.45% | 5.84% |
*Fee waivers are and in effect until August 1, 2024
The performance data quoted represents past performance. Past performance does not guarantee future results. The investment return and principal value of an investment will fluctuate so that an investor's shares, when sold or redeemed, may be worth more or less than their original cost and current performance may be lower or higher than the performance quoted.
| Ex-Date | Record Date | Payable Date | Amount |
Future calendar dates are subject to change. There is no guarantee that dividends will be paid. Past distributions are not indicative of future trends. This material is provided for educational purposes only and does not constitute investment advice.
Distributions are issued to brokers on the payable date, and are subject to broker payment schedules.
| 2023 Distributions |
| Ex-Date | Record Date | Payable Date | Amount |
| 12/18/2023 | 12/19/2023 | 12/20/2023 | 0.569134 |
| 2022 Distributions |
| Ex-Date | Record Date | Payable Date | Amount |
| 12/28/2022 | 12/29/2022 | 12/30/2022 | 0.990537 |
| 2021 Distributions |
| Ex-Date | Record Date | Payable Date | Amount |
| 12/29/2021 | 12/30/2021 | 12/31/2021 | 1.490565 |
| 2020 Distributions |
| Ex-Date | Record Date | Payable Date | Amount |
| 12/29/2020 | 12/30/2020 | 12/31/2020 | 0.497981 |
| 2019 Distributions |
| Ex-Date | Record Date | Payable Date | Amount |
| 12/27/2019 | 12/30/2019 | 12/31/2019 | 0.736301 |
Essential metals (#copper, #nickel, #aluminum, #zinc, #cobalt, & #lithium) are crucial for the $140 trillion global #energytransition, but prices have dipped from 2022 highs. This presents a potential #investment opportunity for the KraneShares Electrification Metals Strategy ETF… pic.twitter.com/eirn3E5FD4
— KraneShares (@KraneShares) March 28, 2024
Defined outcome strategies are growing in popularity. Until now, they have historically focused on #US #equities, but when applied to the right #market at the right time, they can potentially yield outsized risk-adjusted results. Read our latest article to learn more about the… pic.twitter.com/M7FJjAF8d3
— KraneShares (@KraneShares) March 25, 2024


The Growth of $10,000 chart reflects an initial investment of $10,000 on the day prior to the selected time period and assumes reinvestment of dividends and capital gains. For the growth of $10,000 chart since inception, the initial investment of $10,000 is instead made on the inception date of the Fund. Fund expenses, including management fees and other expenses were deducted. The growth of a $10,000 investment in the fund is hypothetical and for illustration purposes only. Fund performance data used in this chart is based on Fund NAV and represents past performance. Past performance does not guarantee future results.
| Rank | Name | % of Net Assets | Ticker | Identifier | Shares Held | Market Value($) |
| 1 | TSMC | 10.03% | 2330 | TW0002330008 | 326,000 | 7,518,219 |
| 2 | SAMSUNG ELECTRON | 5.30% | 005930 | KR7005930003 | 70,830 | 3,976,133 |
| 3 | INFOSYS LTD-SP ADR | 1.87% | INFY | US4567881085 | 83,555 | 1,404,560 |
| 4 | SK HYNIX INC | 1.63% | 000660 | KR7000660001 | 9,749 | 1,222,195 |
| 5 | ICICI BANK LTD | 1.44% | ICICIBC | INE090A01021 | 84,605 | 1,081,746 |
| 6 | HDFC BANK LIMITED | 1.43% | HDFCB | INE040A01034 | 58,597 | 1,074,976 |
| 7 | HON HAI | 1.41% | 2317 | TW0002317005 | 240,000 | 1,055,318 |
| 8 | BHARTI AIRTEL LTD | 1.22% | BHARTI | INE397D01024 | 59,410 | 917,436 |
| 9 | TATA CONSULTANCY SVCS LTD | 1.21% | TCS | INE467B01029 | 19,766 | 906,045 |
| 10 | NASPERS LTD-N SHS | 1.15% | NPN | ZAE000325783 | 5,052 | 860,181 |
Holdings are subject to change.
Hyperlinks on this website are provided as a convenience and we disclaim any responsibility for information, services or products found on the websites linked hereto.
Click here to continueYou are now leaving KraneShares.com. Hyperlinks on these websites are provided as a convenience and we disclaim any responsibility for information, services or products found on the websites linked hereto.
This website uses cookies to help us enhance your browsing experience. By using this website you consent to our use of these cookies. To find out more about how we use cookies and how to manage them, please see our Terms & Conditions and Privacy Policy.