Trump, Trade & Tariffs: A Recap Of the China A-Share Inclusion Roadshow
Frequently Asked Questions from our Eight City Tour of America
Over the past three weeks KraneShares has been traveling across the country meeting with financial advisors, consultants and institutional investors about the June 1st inclusion of 234 Mainland listed Chinese securities (A-shares) into MSCI’s Global Standard Indexes. The investors we met on the roadshow had great questions, not just about the significance of inclusion, but also the current state of China’s economy and capital markets.
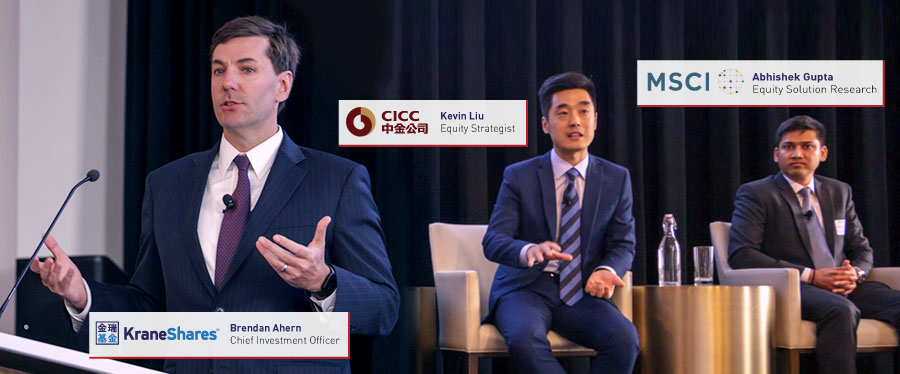
We have summarized the most frequently asked questions below with answers compiled from KraneShares and our partners on the road: MSCI, a leading global index provider with $13.9 trillion benchmarked assets1, China International Capital Corporation (CICC), a leading Chinese investment bank, and Bosera Asset Management, one of the largest Chinese asset managers and the sub advisor to the KraneShares Bosera MSCI China A Share ETF (NYSE: KBA).
MSCI China A-Share Inclusion Quick Summary
MSCI is the largest index provider to global ETF industry2 with $1.6 trillion tracking the MSCI Emerging Markets Index3. Over the long-term China A-shares are projected to comprise 17% of the MSCI Emerging Markets Index spanning multiple rebalances4 which could raise China’s total weight from 30% to over 40% over the next several years4. This could represent upward of $270 billion being reallocated to the newly included A-share securities4. Similar past rebalances have provided a strong catalyst for the performance of the inclusion markets.
The first phase of inclusion starts June 1st, how long will full inclusion take?
The first and second inclusions occur on June 1st and September 1st 2018. MSCI will likely hold a consultation to assess their clients’ experience investing in the 234 securities we hold in KBA today5. Based on the feedback, the pace and size of subsequent inclusions will be determined. KraneShares believes it could take three to five years for the full inclusion to be implemented following MSCI’s schedule of June 1st and December 1st Semi-Annual Index Reviews.
How does the MSCI China A Inclusion Index compare to other Chinese benchmarks like the CSI 300 Index6?
KBA is specifically benchmarked to the MSCI China A Inclusion Index, which is designed to track the progressive partial inclusion of A shares in the MSCI Emerging Markets Index over time. As MSCI expands the universe of included A-share companies and their weights, the MSCI China A Inclusion Index is designed to rebalance accordingly.
Presently there is no overlap between the MSCI China A Inclusion Index and indexes tracking the historic Hong Kong oriented definition of China, such as the FTSE China 25 Index7, or the MSCI China Index8.
The CSI 300 Index, another benchmark for Mainland China exposure, was originally developed by Mainland index provider China Securities Index Company as a tool for domestic Chinese investors to gain exposure to the 300 largest Mainland securities by market capitalization. In contrast, the MSCI China A Inclusion Index is built by MSCI in accordance with their Global Investable Index Methodology specifically for global investors allocating to the domestic Chinese equity market. In designing the index, MSCI took into consideration foreign ownership limits and regulations for non-domestic investors. They also implemented strict filters to exclude halted securities and illiquid names. Additionally, the MSCI China A Inclusion Index only draws from securities that are freely tradable through the Hong Kong Shanghai and Hong Kong Shenzhen Stock Connect Trading Programs. For this reason, KBA holds over two dozen securities not tracked by the CSI 300 Index9.
Finally, as with all MSCI indexes, a full complement of fundamental data is available for the MSCI China A Inclusion Index, suitable for investors looking to perform in depth analysis.
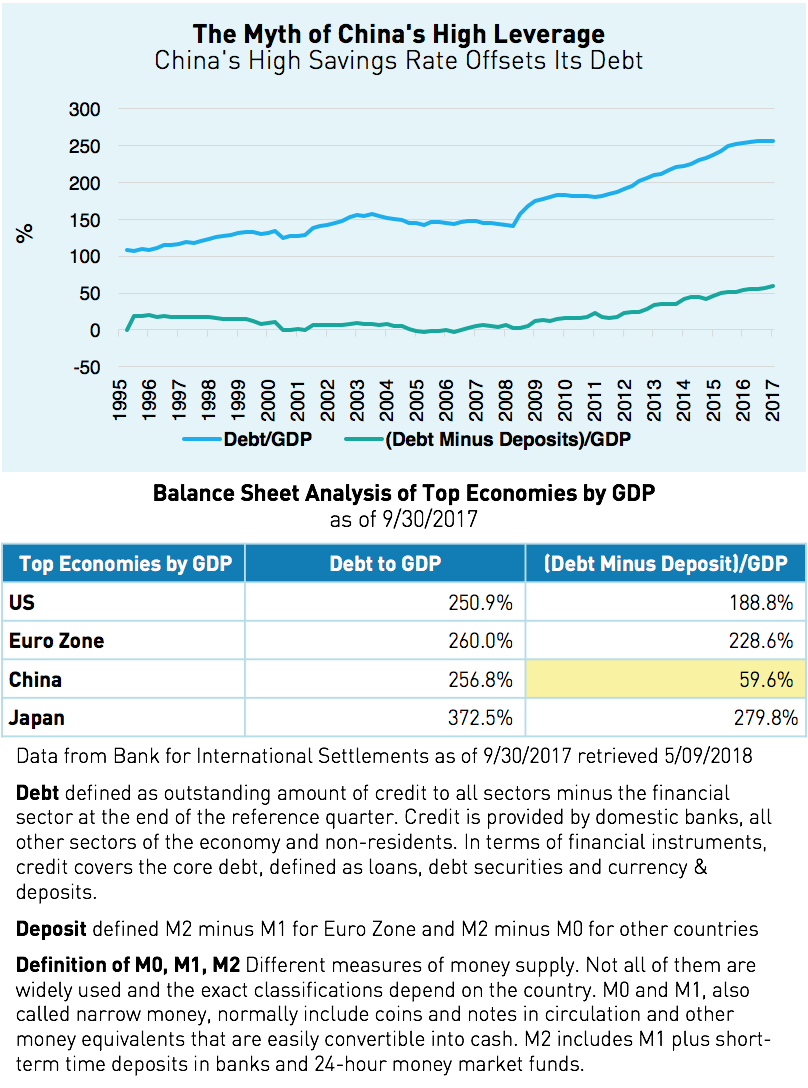
Does the increase in financial leverage over the past few years pose a risk to China’s overall economy?
While China’s overall debt to GDP ratio climbed after the financial crisis, we do not believe it will be an immediate issue for the overall economy. This is primarily due to high household and government sector savings rates in China, which are still in a net cash position. In fact, Chinese Treasury bonds and household debt ratios are well below global averages10.
Chinese policy makers and financial regulators are actively working to curtail credit growth to indebted corporations who are primarily responsible for the uptick in China’s debt to GDP ratio. Policy makers have begun tightening the lending rates and credit access for these corporations while keeping credit markets open to the broader economy.
Two-thirds of the debt held by corporations comes from State Owned Enterprises (SOEs) which have an implicit guarantee by the government. The government has strong influence over both SOEs and the banking sector, which we believe provides great flexibility in dealing with rising debt levels. Chinese policy makers and regulatory bodies are conscientious of debt concerns and are making concerted efforts to address them. We expect China’s debt to GDP ratio to decline in the years to come as these policies gain traction.
Should I be concerned with corporate governance and accounting from Chinese firms?
There has been a trend toward greater compliance and adherence to global standards by Chinese corporations. MSCI’s decision to include the 234 securities held in KBA places an even greater emphasis on these companies to adhere to global institutional standards. MSCI is not adding all 3,000 Mainland listed Chinese companies, but rather a subset of China’s largest corporations. These securities are primarily listed on the Main Boards of both the Shanghai and Shenzhen stock exchanges which have the strongest listing standards in China. For example, companies must be profitable for at least three years before listing on the Main Board. Managers will reward the companies that most adhere to their standards while investors are increasingly pushing for strong corporate governance from their holdings. MSCI has created incentives for companies to adhere to global standards by excluding stocks that do not meet their criteria.
One interesting byproduct of MSCI’s free float market capitalization methodology is a balanced investment allocation across the securities held within KBA's portfolio. As of 4/30/2018 KBA’s largest holding is less than 5% of the portfolio while the tenth largest holding is just above 1%. Investors in KBA have limited exposure to any single name thus reducing single stock risk.
Should I be concerned about a Trade War?
The overall value of the proposed tariffs is only $50 billion or roughly 0.5% of China’s GDP10. We do not believe the proposed tariffs pose much of direct impact to the overall GDP growth of China. Even in the worst-case scenario China still has many tools to stimulate domestic demand, such as boosting domestic infrastructure and property investment. Additionally, China has taken steps to ease tensions by opening up general manufacturing and lowering the barrier to entry for foreign investors. While concerns may persist in the near term we believe the overall impact is still manageable.
MSCI recently published a piece on their blog titled “Winners And Losers Of A U.S.-China Trade War” that analyzed US and Chinese firms’ revenue exposure to the other’s economy by sector. They found that while an expanded trade war may lead to a “lose-lose” outcome, U.S. stocks are more likely to be impacted than Chinese stocks. US multi-national corporations, especially US technology companies, are more exposed to the Chinese economy than the other way around.
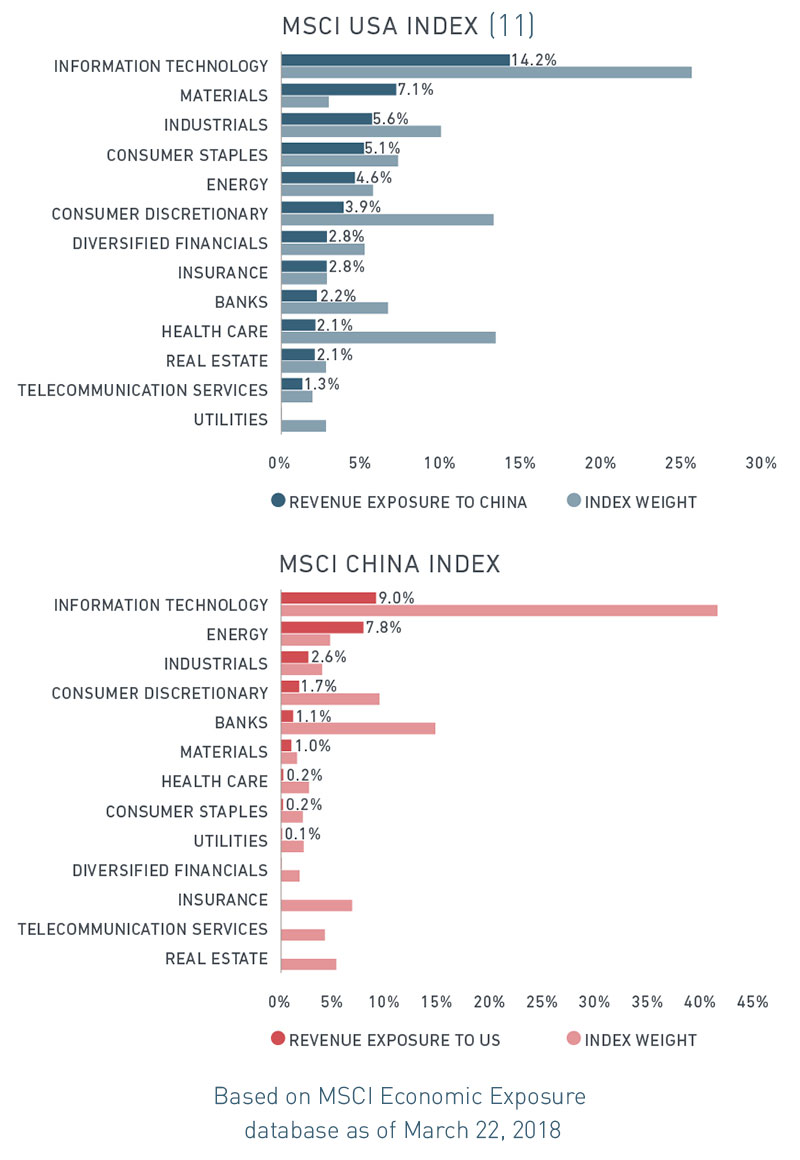
While headline risks may still persist, we believe ongoing discussions may potentially lead to more balanced trade going forward.
We are privileged to have had the opportunity to deliver insights from our partners MSCI, CICC, and Bosera to investors across eight US cities over the past three weeks. A clear takeaway from our China A-Share Inclusion Roadshow is that institutions, consultants, and financial advisors are engaged and excited about how the opening up of the world’s second largest equity market can potentially benefit their portfolios. Our fund the KraneShares Bosera MSCI China A Share ETF (NYSE: KBA) has the longest track record and is the largest MSCI-linked China A-share ETF in the United States12. We are happy to discuss the China A-share market and access solutions with any investor who has questions. Likewise, if you were unable to attend the Roadshow and are interested in the presentation materials please contact us.
This article is intended for educational purposes only and should not be construed as investment advice. All opinions or views expressed in this article are current only as of the date of this article and are subject to change without notice.
- As of December 31, 2017, as reported on March 31, 2018 by eVestment, Morningstar and Bloomberg.
- As of March 2018; defined as each share class of an exchange traded fund, as identified by a separate Bloomberg ticker. Only primary listings, and not cross-listings, are counted.
- Data from MSCI as of June 30, 2017, as reported on September 30, 2017 by eVestment, Morningstar and Bloomberg
- "EVOLUTION OF CHINA A SHARES & MSCI CHINA A INCLUSION INDEX" MSCI, 4/23/2018
- Based on KBA holdings as of 4/30/2018
- CSI 300 Index: is a capitalization-weighted stock market index designed to replicate the performance of top 300 stocks traded in the Shanghai and Shenzhen stock exchanges
- FTSE China 50: is a real-time tradable index comprising 50 of the largest and most liquid Chinese stocks (H Shares, Red Chips and P Chips) listed and trading on the Stock Exchange of Hong Kong (SEHK).
- MSCI China Index: captures large and mid cap representation across China H shares, B shares, Red chips and P chips. With 143 constituents, the index covers about 84% of this China equity universe.
- Data from ETF Research Center as of 4/30/2018
- Liu Kevin "China Market Outlook: 2018, Stronger for Longer" CICC, 4/30/2018
- The MSCI USA Index (USD): is designed to measure the performance of the large and mid cap segments of the US market.
- Data from ETF.com as of 4/30/2018
The KraneShares ETFs are distributed by SEI Investments Distribution Company (SIDCO), 1 Freedom Valley Drive, Oaks, PA 19456, which is not affiliated with Krane Funds Advisors, LLC, the Investment Adviser for the Fund. Additional information about SIDCO is available on FINRA’s BrokerCheck.