Krane Funds Advisors, LLC is the investment manager for KraneShares ETFs. KraneShares offers innovative investment solutions tailored to three key pillars: China, Climate, and Uncorrelated Assets. Our team is determined to provide industry-leading, differentiated, and high-conviction investment strategies that offer access to key market trends. Our mission is to empower investors with the knowledge and tools necessary to capture the importance of these themes as an essential element of a well-designed investment portfolio.
July 26, 2024 – Strict Export Controls on China Can Have ‘Unintended Consequences’
July 26, 2024 – KraneShares Launches Ultra Short Duration Investment Grade Bond ETF (KCSH) Designed for Sustainable Impact

July 18, 2024 – KraneShares Launches AGIX: An Artificial Intelligence & Technology ETF That Provides Investors Exposure to Companies Across the AI Ecosystem
July 16, 2024 – KraneShares Launches KSPY Tracking an Index Powered by Hedgeye Research Designed to Reduce Volatility and Provide a Downside Hedge on S&P 500®
Our semi-monthly topical research reports. Subscribe to our weekly mailing list for more.

July 9, 2024 – Revisiting Hong Kong: Optimism Still Improving Even As Rally Gets Tested
July 5, 2024 – Rhetoric vs. Reality: Trump’s “Man in Beijing” Weighs in on The Future of US-China Relations

June 26, 2024 – Remember Acid Rain?
June 18, 2024 – How to Buy the Same Stocks as China’s Sovereign Wealth Funds
Information about KraneShares ETFs, China's markets and culture, and general investing resources.
Our market update is a collaboration between the KraneShares internal research department, our local Chinese partners, and select China thought leaders from around the world. Our goal is to deliver a differentiated perspective on Chinese capital markets, business, government, and culture.
280 Park Avenue, 32nd Floor
New York, NY 10017
1 Embarcadero Center, Suite 2350
San Francisco, CA 94111
181 Queen Victoria Street
London EC4V 4EG
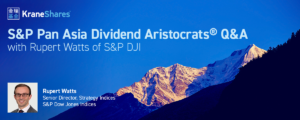
KDIV gives investors access to the S&P Dividend Aristocrats methodology applied to the Pan Asia region, one of the fastest-growing areas in the world. The S&P Pan Asia Dividend Aristocrats Index includes companies from China, Japan, Australia, and other Asian countries, that have paid and increased their dividends over a sustained period of time. Over the long term, companies with a strong track record of paying and growing dividends may outperform the broad market on a risk-adjusted basis.
1. “The Case for Dividend Aristocrats in Pan Asia”, S&P Dow Jones Indices, Aug 29, 2022. Gross domestic product (GDP) is a monetary measure of the market value of all the final goods and services produced in a specific time period by a country.
| Ticker | KDIV |
| Primary Exchange | NYSE |
| CUSIP | 500767496 |
| ISIN | US5007674964 |
| Net Assets | $2,679,063 |
| Total Annual Fund Operating Expense | 0.68% |
| Inception Date | 9/14/2022 |
| Distribution Frequency | Annual |
| Daily Net Asset Value (NAV) and Market Price | |
| NAV | $26.79 |
| NAV Daily Change | -1.47% |
| Market Price | $26.73 |
| Market Price Daily Change | -0.67% |
| 30 Day Median Bid/Ask Spread |
0.59% |
| The ETF’s 30 Day Median Bid-Ask Spread is calculated by identifying the ETF’s national best bid and national best offer ("NBBO") as of the end of each 10 second interval during each trading day of the last 30 calendar days and dividing the difference between each such bid and offer by the midpoint of the NBBO. The median of those values is identified and that value is expressed as a percentage rounded to the nearest hundredth. | |
| NAV | Market Price | Premium/Discount |
| $26.79 | $26.73 | $-0.06 |
| 2023 Full Year | Q1 2024 | Q2 2024 | Q3 2024 | |
| Days traded at premium | 147 | 72 | 35 | 11 |
| Days traded at NAV | 0 | 0 | 0 | 0 |
| Days traded at discount | 103 | 50 | 28 | 7 |
The Premium/Discount History chart demonstrates the difference between the daily market price of shares of the Fund and the Fund’s net asset value (NAV). The vertical axis of the chart shows the premium or discount of the daily market price as a percentage of the NAV. The horizontal axis shows each trading day in the time period, and each data point in the chart represents the Premium/Discount on that day. The data presented in the chart and table above represent past performance and cannot be used to predict future results.
| Fund NAV | Closing Price | Index | |
| 1 Month | -0.70% | -0.99% | -0.65% |
| 3 Month | 0.71% | 0.93% | 1.11% |
| 6 Month | 1.39% | 1.50% | 2.14% |
| YTD | 1.39% | 1.50% | 2.14% |
| Since Inception | 19.05% | 19.44% | 23.28% |
| Fund NAV | Closing Price | Index | |
| 1 Year | 7.06% | 6.93% | 10.20% |
| Since Inception | 10.20% | 10.40% | 12.37% |
The performance data quoted represents past performance. Past performance does not guarantee future results. The investment return and principal value of an investment will fluctuate so that an investor's shares, when sold or redeemed, may be worth more or less than their original cost and current performance may be lower or higher than the performance quoted.
| Ex-Date | Record Date | Payable Date | Amount |
Future calendar dates are subject to change. There is no guarantee that dividends will be paid. Past distributions are not indicative of future trends. This material is provided for educational purposes only and does not constitute investment advice.
Distributions are issued to brokers on the payable date, and are subject to broker payment schedules.
| 2023 Distributions |
| Ex-Date | Record Date | Payable Date | Amount |
| 12/18/2023 | 12/19/2023 | 12/20/2023 | 2.394892 |
| 2022 Distributions |
| Ex-Date | Record Date | Payable Date | Amount |
| 12/28/2022 | 12/29/2022 | 12/30/2022 | 0.223284 |
Remember acid rain? In the '80s and '90s the story was everywhere - today, not so much. The problem was solved through cap-and-trade programs that put a price on emitting the pollutants that cause acid rain. A large part of these programs' success is due to Dr. Richard Sandor, an… pic.twitter.com/EkPJFRAkRf
— KraneShares (@KraneShares) July 5, 2024
@KraneShares CEO Jonathan Krane took the main stage on the Tackling Financial System Fragmentation panel, where he discussed the potential #investment and innovation opportunities in China at the 2024 Summer @Davos held in Dalian, China! pic.twitter.com/KdvbOhsRyN
— KraneShares (@KraneShares) June 26, 2024


The Growth of $10,000 chart reflects an initial investment of $10,000 on the day prior to the selected time period and assumes reinvestment of dividends and capital gains. For the growth of $10,000 chart since inception, the initial investment of $10,000 is instead made on the inception date of the Fund. Fund expenses, including management fees and other expenses were deducted. The growth of a $10,000 investment in the fund is hypothetical and for illustration purposes only. Fund performance data used in this chart is based on Fund NAV and represents past performance. Past performance does not guarantee future results.
| Rank | Name | % of Net Assets | Ticker | Identifier | Shares Held | Market Value($) |
| 1 | PETROCHINA CO LTD-H | 6.33% | 857 | CNE1000003W8 | 194,000 | 169,470 |
| 2 | CHINA MERCHANTS BANK-H | 4.38% | 3968 | CNE1000002M1 | 28,500 | 117,364 |
| 3 | PING AN | 4.23% | 2318 | CNE1000003X6 | 26,500 | 113,370 |
| 4 | CKI HOLDINGS | 3.50% | 1038 | BMG2178K1009 | 14,000 | 93,786 |
| 5 | HONG KONG & CHINA GAS | 3.34% | 3 | HK0003000038 | 111,000 | 89,572 |
| 6 | CHINA RESOURCES LAND LTD | 3.33% | 1109 | KYG2108Y1052 | 28,500 | 89,255 |
| 7 | BOSIDENG INTL HLDGS LTD | 3.08% | 3998 | KYG126521064 | 170,000 | 82,527 |
| 8 | APA GROUP | 3.06% | APA | AU000000APA1 | 16,230 | 81,900 |
| 9 | SWIRE PROPERTIES LTD | 2.82% | 1972 | HK0000063609 | 47,800 | 75,675 |
| 10 | ENN ENERGY HOLDINGS LTD | 2.80% | 2688 | KYG3066L1014 | 10,100 | 74,969 |
Holdings are subject to change.
Hyperlinks on this website are provided as a convenience and we disclaim any responsibility for information, services or products found on the websites linked hereto.
Click here to continueYou are now leaving KraneShares.com. Hyperlinks on these websites are provided as a convenience and we disclaim any responsibility for information, services or products found on the websites linked hereto.
This website uses cookies to help us enhance your browsing experience. By using this website you consent to our use of these cookies. You can customize your preferences by clicking “Cookie Preferences” below. To find out more about how we use cookies and how to manage them, please see our Terms & Conditions and Privacy Policy.