The Case For An Increased Exposure To China A-Shares

While the coronavirus dominates headlines, it is easy to forget that 2019 was a massive year for China’s A-share market. Last year, global index provider MSCI, increased the inclusion factor of China A-shares in their Emerging Markets Index to 20%, a move that exceeded expectations and elevated the market from being a “good option” to an essential piece of the Emerging Markets (EM) puzzle. At the same time, the move put MSCI-benchmarked investors on notice. The message is clear: consider allocating to the China A-share market or miss what has now become a core component of MSCI's global standard indexes.
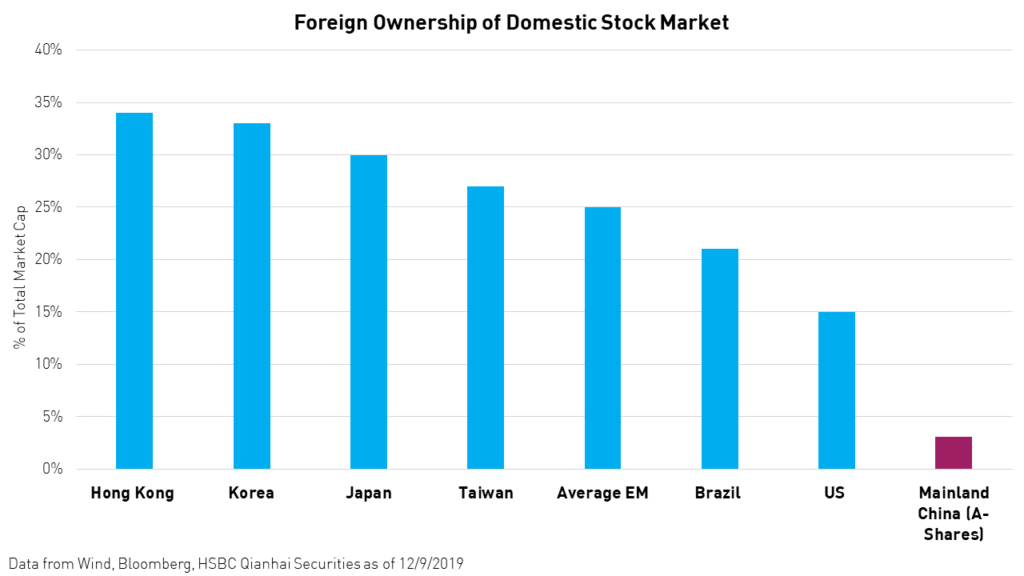
Passively managed fund flows into A-shares were estimated to have been around $100 billion in 2019. Actively managed fund flows were lower despite representing a comparatively larger share of Emerging Market and China fund assets. Foreign investors’ ownership went from 2% of market cap to 3.1% and from 3% of free float to 8%, making foreign institutional investors the largest institutional investor group in China’s A-share market.1 The current foreign ownership level remains well below the 30% limit set for Mainland stocks and is much lower than other major Asian markets. Currently, foreign equity ownership levels in Hong Kong and Korea are at 34% and 33%, respectively.2 We believe foreign ownership in Mainland China's equity market may catch up with its Asian neighbors over the next five years, providing A-share stock prices with a long-term tailwind.
We believe there are many reasons to be positive about the A-Share market in both the short and long term.
- Analysts expect an average of 14% growth3 in earnings for the A-Share market in 2020.
- Significant flows are anticipated over the next 5 years from both active and passive managers thanks to further MSCI inclusions.4
- Foreign ownership at 3% of full market cap vs. 25% average for Emerging Markets, and ~33% for Korea and Hong Kong.2
- Investors may pivot from the US to Emerging Markets due to the widening growth gap between the two markets and EM's sizable valuation discount.
- Chinese institutional investors continue to develop and become more involved in the stock market.
- A potentially improving macroeconomic environment in China, especially given the completion of a phase one deal
- Technology upgrades such as 5G, which should pave the way for innovation
- The government’s commitment to the continued reform and opening of Chinese equity and bond markets
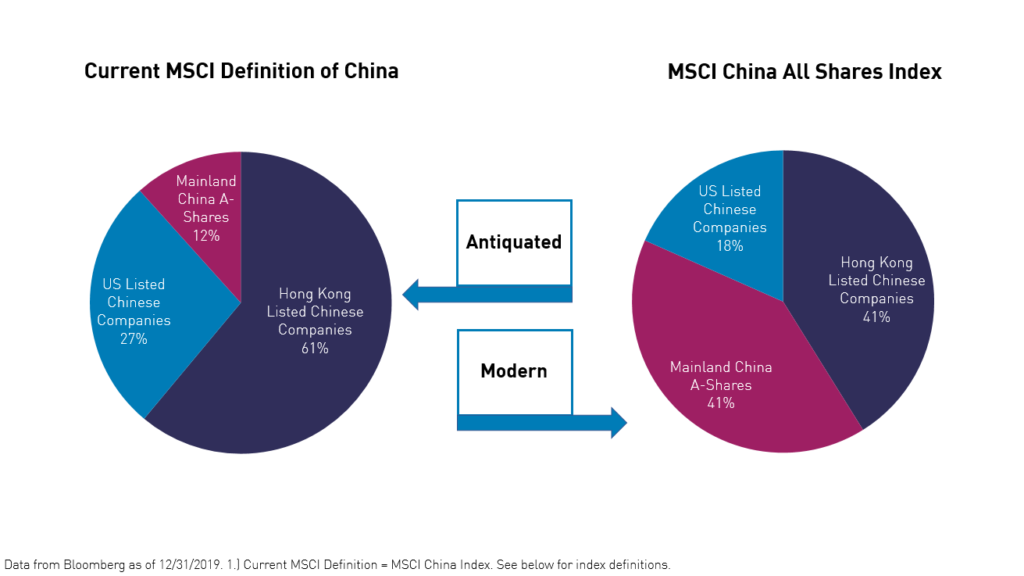
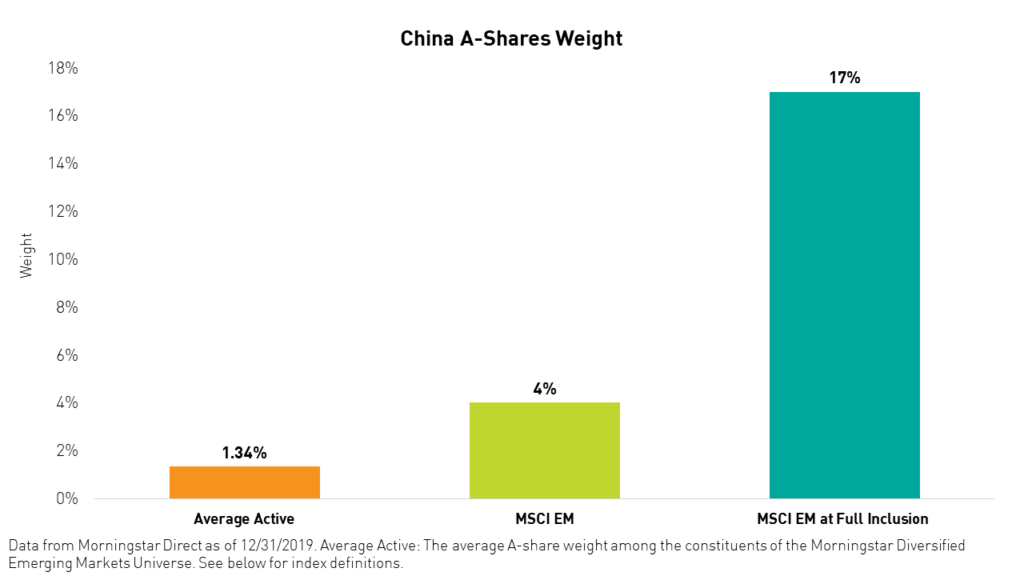
MSCI's inclusion announcement changed the way investors look at and think about the A-share market. The weight of A-shares in the MSCI China Index may grow from 11% to 40%, which would reflect the A-share portion of China's full market cap, as measured by the MSCI China All Shares Index. In the MSCI Emerging Markets Index, MSCI's projections indicate that China’s A-share weight will increase from 4% to 17%.4
MSCI developed its current standard definition of China when foreign investment in Mainland China's capital markets was heavily restricted. Therefore, the definition is focused on stocks listed in the historically freely accessible Hong Kong and US markets. Now that most restrictions have been lifted, MSCI's standard definition has become antiquated. We believe the MSCI China All Shares Index is more modern as it reflects the accurate market capitalization-weighted proportions of the various markets where Chinese stocks list.
Why MSCI China A over CSI 300?
Just as MSCI's standard China index is still largely defined by antiquated access restrictions, the CSI 300 Index also harkens back to a time before China A-shares were internationalized. Specifically, the index, which tracks the 300 largest Mainland-listed companies, does not reflect the increasing complexity of the Chinese economy on a sector level, the growth of the Shenzhen Stock Exchange as an alternative to Shanghai, and the proliferation of small and mid-cap stocks (SMID caps). For this reason, we think the MSCI China A Index offers a more comprehensive definition of the A-share opportunity.
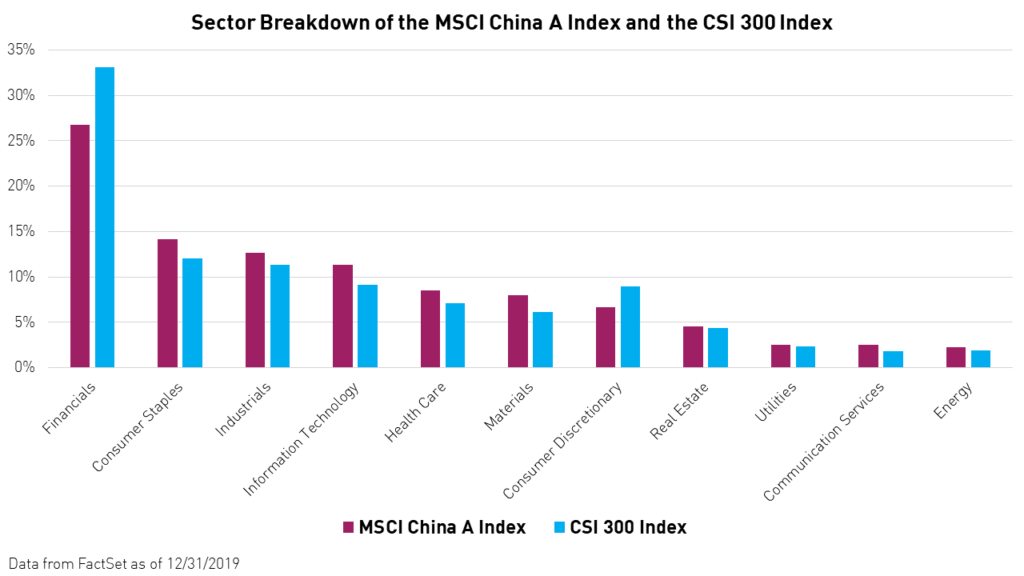
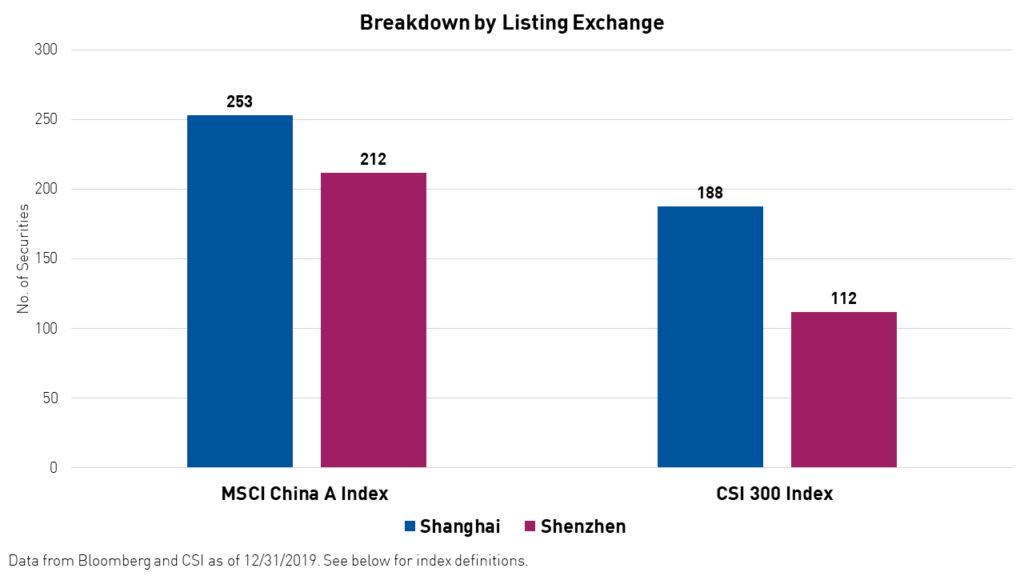
Unlike the CSI 300 Index, the MSCI China A Index is not bound to the largest 300 companies. Currently, the MSCI China A Index tracks 465 stocks. MSCI’s most recent inclusion in November of 2019 targeted mostly SMID caps, which represented 189 of the 204 stocks that were included.5 The MSCI China A Index offers lower exposure to financials and higher exposure to new China economy sectors such as technology, communication services, consumer staples, health care, and industrials.
Many of the A-shares being included in MSCI’s definition are listed on the Shenzhen Stock Exchange, which is more heavily tech-oriented. Since the latest round of inclusion, Shenzhen has seen heavier foreign buying than Shanghai, according to Bloomberg. Nonetheless, the CSI 300 Index remains more skewed toward the older Shanghai Exchange. We believe this may prevent the CSI 300 from reflecting the full inclusion opportunity. The MSCI China A Index, on the other hand, has a near equal weighting to stocks listed on both exchanges.
The MSCI China A Index has a higher allocation to SMID Caps, which we believe tend to be more in tune with local demand.
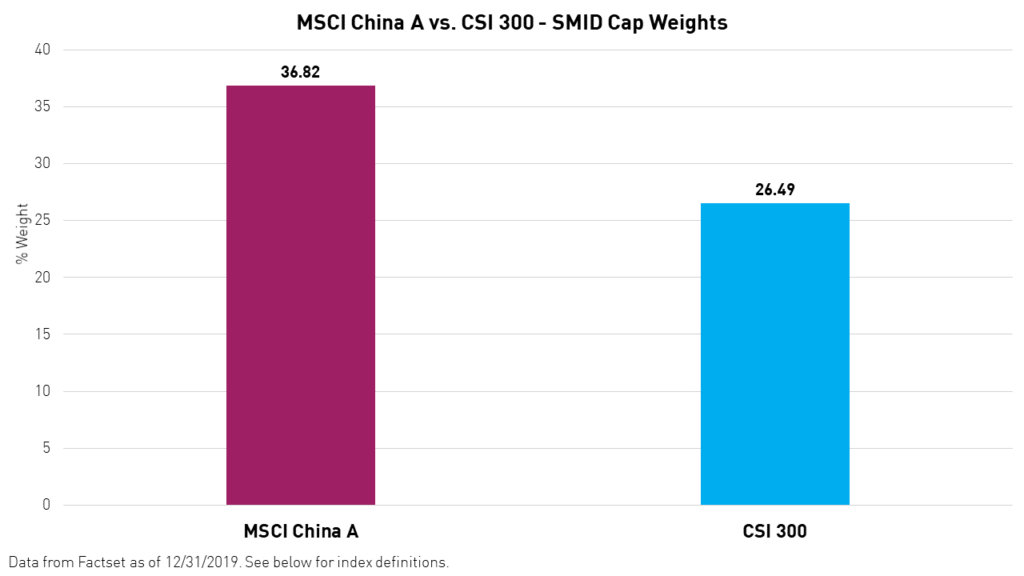
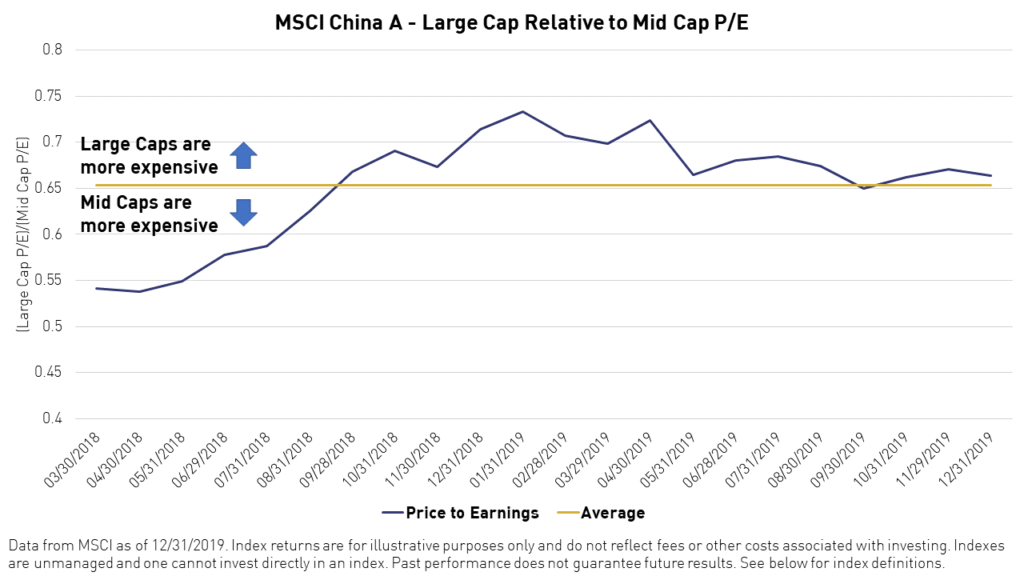
In the past 6 months, SMID caps began to outperform large caps, signaling optimism about the economy and investors’ increased appetite for risk. According to the charts below, SMID caps remain undervalued on both an absolute basis and relative to large caps. We believe this trend will continue, giving the MSCI China A Index an advantage over the CSI 300 Index. Furthermore, MSCI China A stands to benefit more than the CSI 300 from future MSCI inclusions, which are likely to include even more SMID caps.
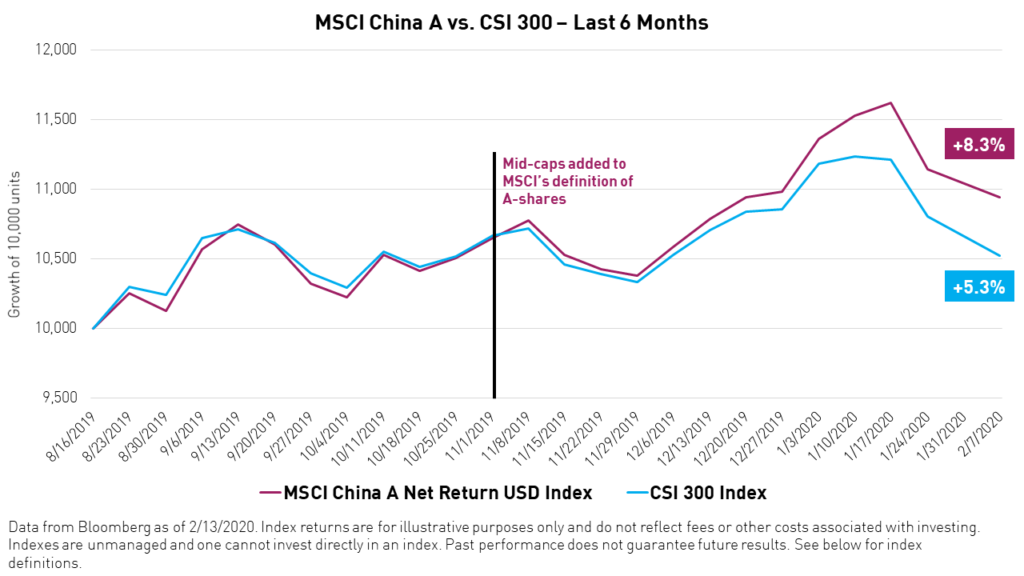
Over the course of 2019, MSCI gradually added both mid-caps and ChiNext stocks, stocks listed on the dedicated technology board of the Shenzhen stock exchange, to its definition of China A-shares.5 After MSCI added mid-caps to its definition of A-shares, the MSCI China A Index began to outperform the CSI 300 Index.
Active managers may be underexposed to the A-share market.
We believe active managers were taken aback by MSCI’s 20% inclusion announcement and may not have been ready for such a change in the MSCI EM benchmark. Through our experience and recent conversations with managers, we know that active managers have been looking to expand their research capabilities into the A-share market. Currently, the average exposure of the active managers within the Morningstar Diversified Emerging Markets Universe to the China A-share market is just 1.34%.
Headlines still do not necessarily correlate with A-share performance.
Finally, 2019 was dominated by negative headlines regarding China. Those investors who avoided China in their portfolios missed out on one of the best-performing equity markets in 2019. According to AI-driven news/media sentiment data compiled by Science4Data, sentiment regarding China’s economy among a surveyed group of high-traffic, English-language media outlets has been trending downward all year, starting at near 0, net neutral, and moving down to -3, net negative, by the end of the year. Meanwhile, the A-Share market, as measured by the MSCI China A Index, returned an impressive 36.11%, outpacing the S&P 500’s total return of 30.70%.7
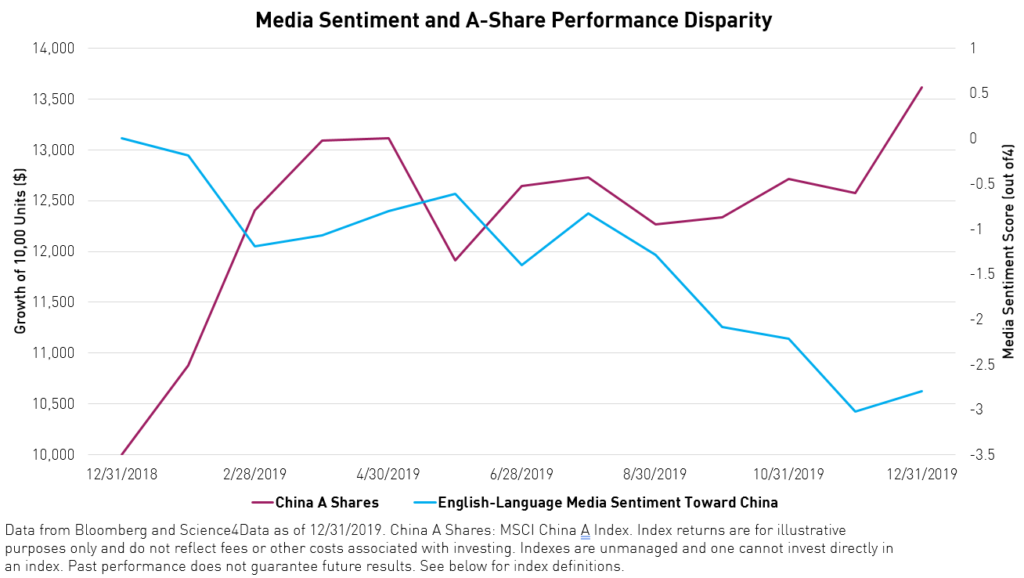
We believe it is prudent to note the disparity between how well A-share markets performed last year compared to how negative US media headlines were toward the market. We believe this disparity is still occurring now as the coronavirus dominates the news cycle. While it is impossible to tell what the virus’s actual impact will be and precisely when it will subside, English-language headlines still do not necessarily correlate with A-share performance.
Conclusion
In conclusion, 2019 saw a massive shift in China's role in the global marketplace. Index inclusion and the outperformance of China's Mainland equity markets make a strong argument for including China A-shares in a well-balanced EM portfolio. The MSCI China A Index offers a more comprehensive exposure to A-Shares than the CSI 300 Index due to its diversity of both sector and exchange, significant weighting of small and mid-cap stocks with high growth potential, and higher constituent number. The securities contained in the MSCI China A Index can be captured at a low cost through the KraneShares Bosera MSCI China A-Share ETF (Ticker:KBA).
The investment objective of the KraneShares Bosera MSCI China A Share ETF is dependent, in part, on the continuous availability of A-shares and the ability to obtain, if necessary, additional A-shares quotas. If the fund is unable to obtain sufficient exposure to an A-share quota, the Fund's access to A-shares may be reduced or eliminated, which may have a material adverse effect on the Fund. In such a case, the Fund could seek exposure to the component securities of the Underlying Index by investing in other types of securities.
In addition, investors should understand that uncertainties in China's rules governing the taxation of income and gains from investments in A-shares could result in unexpected liabilities, which may adversely impact Fund returns.
Citations:
- Data from Wind, Bloomberg, and HSBC as of 12/31/2019.
- Data from HSBC as of 12/31/2019.
- Bloomberg Consensus EPS Estimate For MSCI China A Index as of 1/30/2019.
- "MSCI Will Increase The Weight of China A-Shares in MSCI Indexes," MSCI. February 28, 2019.
- Data from Bloomberg and MSCI as of 12/31/2019. MSCI’s definition of A-shares: MSCI China A Index
- Data from Morningstar and FactSet as of 12/31/2019
- Data from Bloomberg as of 12/31/2019.
Index Definitions:
MSCI Emerging Markets Index: The MSCI Emerging Markets Index is a free-float weighted equity index that captures large and mid-cap representation across Emerging Market (EM) countries. The index covers approximately 85% of the free-float adjusted market capitalization in each country. The index was launched on January 1, 2001.
MSCI China All Shares Index: The MSCI China All Shares Index captures large and mid-cap representation across China A‐shares, B‐shares, H‐shares, Red‐chips, P‐ chips and foreign listings (e.g. ADRs). The index aims to reflect the opportunity set of China share classes listed in Hong Kong, Shanghai, Shenzhen and outside of China. It is based on the concept of the integrated MSCI China equity universe with China A-shares included. The index was launched on June 26, 2014.
MSCI China Index: The MSCI China Index captures large and mid-cap representation across China A-shares, H-shares, B-shares, Red chips, P chips and foreign listings (e.g. ADRs). With 703 constituents, the index covers about 85% of this China equity universe. Currently, the index includes Large Cap A and Mid-Cap A-shares represented at 20% of their free float-adjusted market capitalization. The index was launched on October 31, 1995.
MSCI China A Net Return USD Index: The MSCI China A Net Return USD Index captures large and mid-cap representation across China securities listed on the Shanghai and Shenzhen exchanges. The index covers only those securities that are accessible through "Stock Connect". The index is designed for international investors and is calculated using China A Stock Connect listings based on the offshore RMB exchange rate (CNH). The index was launched on May 10, 2015.
MSCI China A Mid Cap Index: The MSCI China A Mid Cap Index captures mid-cap representation across China securities listed on the Shanghai and Shenzhen exchanges. The index covers only those securities that are accessible through "Stock Connect". The index is designed for international investors and is calculated using China A Stock Connect listings based on the offshore RMB exchange rate (CNH). The index was launched on March 1, 2018.
MSCI China A Large Cap Index: The MSCI China A Large Cap Index captures large-cap representation across China securities listed on the Shanghai and Shenzhen exchanges. The index covers only those securities that are accessible through "Stock Connect". The index is designed for international investors and is calculated using China A Stock Connect listings based on the offshore RMB exchange rate (CNH). The index was launched on March 1, 2018.
CSI 300 Net Total Return Index USD: The CSI 300 Net Total Return Index USD consists of the 300 largest and most liquid A-share stocks. The Index aims to reflect the overall performance of the China A-share market. The index was launched on April 8, 2005.
CNN Fear & Greed Index: The CNN Fear & Greed Index is meant to measure the degree to which the emotions of fear and greed are powering investment decisions in the US marketplace. To arrive at a value for the index at a given time, equal weights are given to the deviation from the mean of seven indicators: stock price momentum in the S&P 500 Index, stock price strength on the New York Stock Exchange, stock price breadth, put/call ratios, junk bond demand, market volatility (measured by the VIX Index), and safe-haven demand.
Morningstar Diversified Emerging Markets Universe: Diversified emerging-markets portfolios tend to divide their assets among 20 or more nations, although they tend to focus on the emerging markets of Asia and Latin America rather than on those of the Middle East, Africa, or Europe. These portfolios invest at least 70% of total assets in equities and invest at least 50% of stock assets in emerging markets.
R_US_KS_SEI