Optimizing Exposure to the Emerging Market Rebalance

Emerging markets are back in focus. So far in 2019, investors reallocated $7.4 billion into US-listed emerging market (EM) equity ETFs1. At the same time, both developed market and US equity ETFs lost a combined $27.6 billion2. These asset flows are indicating a shift in investor preference that may be the beginning of a longer trend. However, we believe that simply moving into a general, broad-based emerging market ETF may not be the most optimal approach. Emerging market portfolios could benefit from greater exposure to the following specific growth drivers:
- urbanization
- middle-class consumption
- rapid adoption of mobile technology
Five years ago, we launched the KraneShares CSI China Internet ETF (ticker: KWEB) in an attempt to capture a concentrated exposure to consumer technology in China. We believe the success of KWEB in recent years underscores how growth sectors can potentially benefit portfolios. We subsequently launched the KraneShares Emerging Markets Consumer Technology ETF (ticker: KEMQ) in an attempt to deliver a similar exposure across emerging markets. Adding KEMQ to a broader emerging market portfolio may provide a more growth-oriented sector exposure.
Several factors have influenced investors to move towards emerging market equities in recent months. First, the US stock market experienced high volatility in 2018, creating skepticism about the continued rise of the US bull market. The CBOE Volatility Index (VIX), which measures the US market’s expectation of future volatility, had a daily average of 16.6 in 2018 as opposed to 11.1 in 2017, an increase of 50% year-over-year3. This high volatility seems to have caused many investors to sell US equities in search of other opportunities.
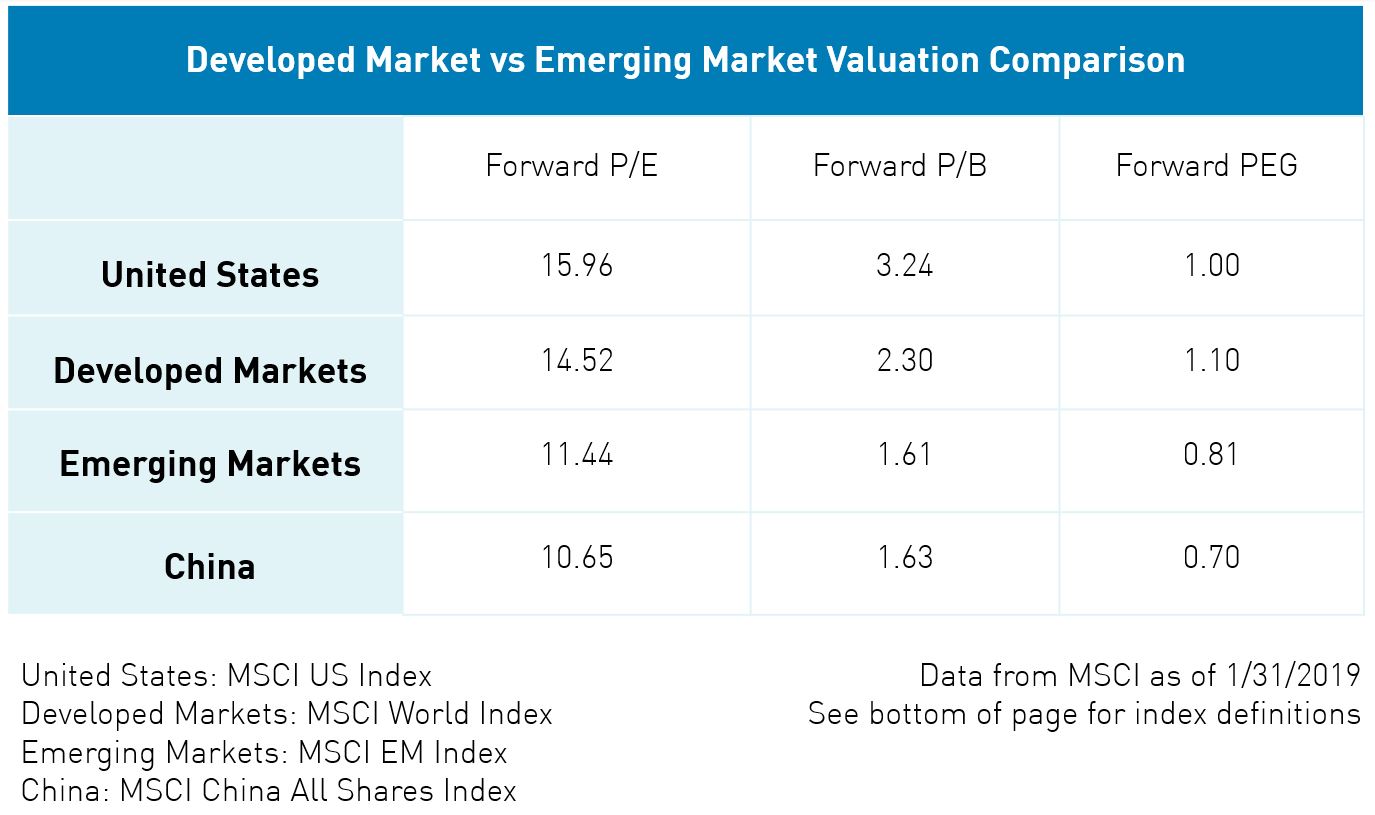
The valuation gap between US stocks and emerging market stocks make EM look attractive on both a relative and historical basis. At the end of January, the forward Price-to-Earnings ratio (forward P/E) of the MSCI Emerging Market Index was 11.44 versus 15.96 for the MSCI US Index. The MSCI All China Index which is comprised of Chinese stocks listed across all stock exchanges was also particularly attractive with a forward P/E of 10.654.
While valuations outside the US look compelling, the rising US interest rate environment of 2018 promoted a strong US dollar which tempered enthusiasm for non-US equities. After the US stock market stumbled through its worst December in decades, the Federal Reserve (Fed) decided on January 30, 2019 to leave its benchmark interest rate unchanged. More surprisingly, the Fed also indicated that rates may remain unchanged for some time. We believe this creates a supportive environment for emerging market stocks due to compelling valuations and a weaker US dollar.
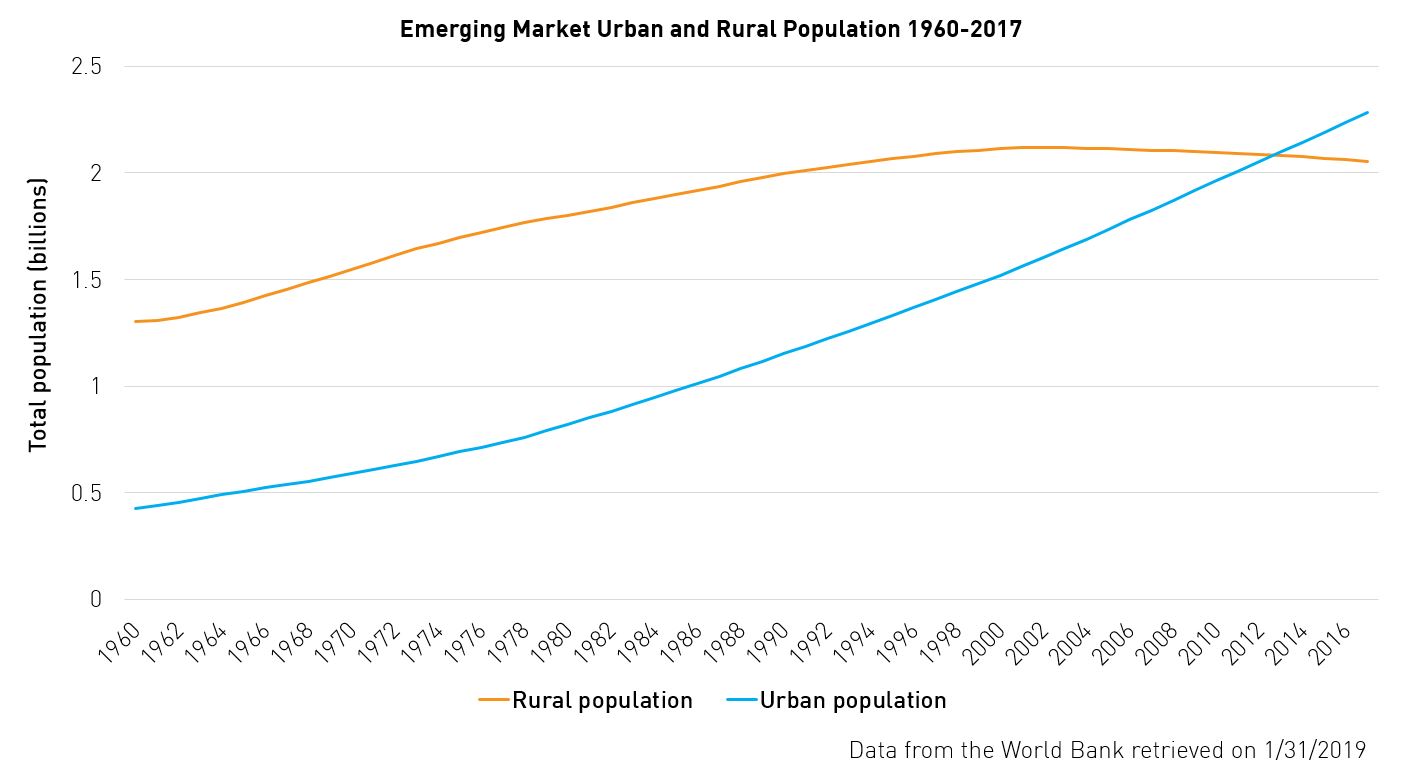
We believe the greatest potential growth in EM could come from emerging market consumer technology. Two critical catalysts for this trend are rising urbanization and middle-class consumption. When people move from rural areas into cities, their standard of living and income generally rise. This is occurring rapidly in emerging markets where, over the past 15 years, the total population living in urban areas has increased by more than 400 million people and average GDP per capita has more than doubled5.
Urbanization in emerging markets has also been accompanied by a rise in household consumption, and increasingly, EM consumers are using mobile technology to purchase goods and services. From 2000 to 2017, household consumption in emerging markets grew by 60%5, and across the same time period, mobile phone subscriptions saw average growth of 50x6. This, in turn, caused an explosion of e-commerce and mobile payments in countries like China, which had $1.34 trillion in retail web sales in 20187.
While the proliferation of emerging market consumer technology has been significant in recent years, we believe this growth trend could continue over the next decade. The McKinsey Global Institute estimates that consumers living in emerging market cities will contribute 56% of global consumption growth from 2015-20308. This coupled with the fact that the average internet penetration rate of emerging market countries is 59% as compared to 89% in the United States9, means that consumer technology in emerging markets could still have significant room to grow.
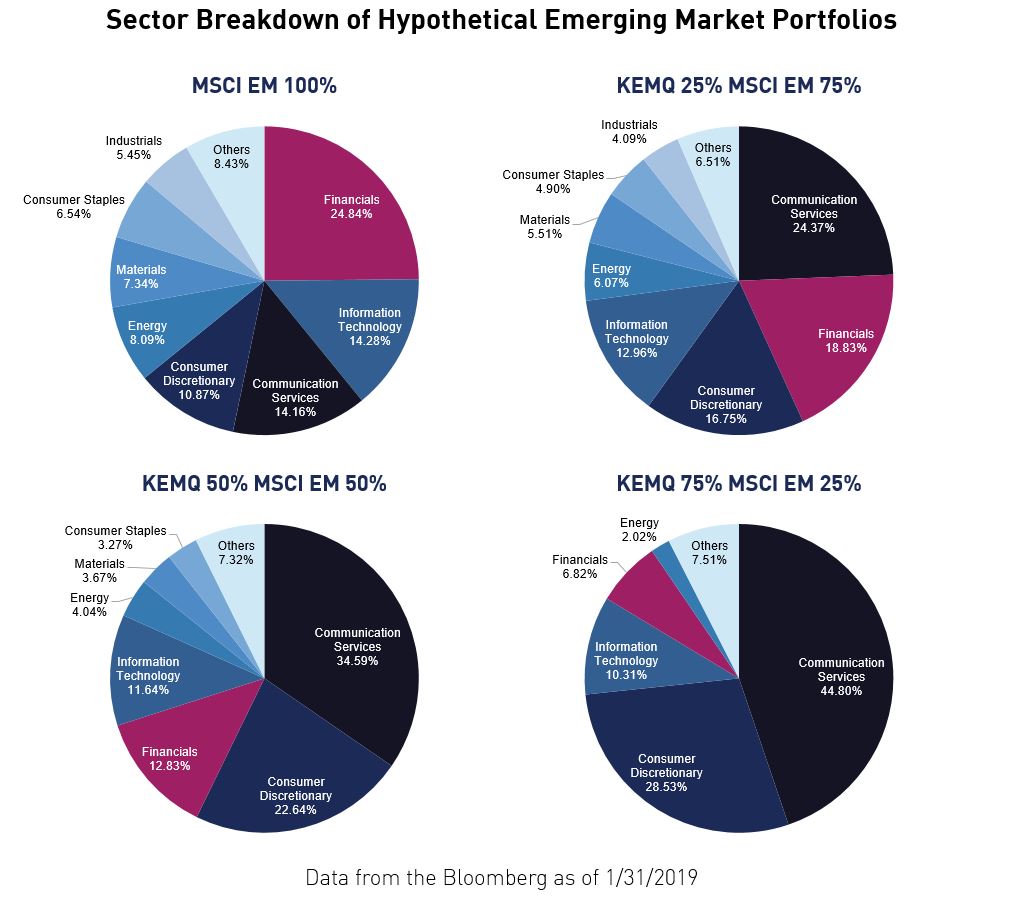
Broad-based EM indexes often have greater weights to sectors such as financials and commodities while underweighting growth sectors, such as consumer technology. Despite the recent expansion of technology and e-commerce in emerging markets, the largest sector by weight of the top 5 US-listed emerging market ETFs is financials with a median weight of 25%10. Discerning investors may consider adding KEMQ to their current emerging market allocation in an attempt to achieve the optimal sector exposure to match their specific risk/growth appetite.
We believe that the recent shift in US investor preference towards emerging markets reflects a potentially attractive relative value opportunity. Additionally, companies geared toward EM consumer technology trends may provide greater long-term growth potential than broad-based emerging markets due to the proliferation of technology in EM countries. KEMQ has a differentiated sector exposure compared to traditional emerging market funds and may be suitable for investors looking to diversify their US holdings.
- The CBOE Volatility Index (VIX Index) is a calculation designed to produce a measure of constant, 30-day expected volatility of the U.S. stock market, derived from real-time, mid-quote prices of S&P 500® Index (SPXSM) call and put options.
- The MSCI Emerging Markets Index captures large and mid cap representation across 23 Emerging Market countries. The index covers approximately 85% of the free float-adjusted market capitalization in each country. (Start Date: Jan 1 2001)
- The MSCI USA Index is designed to measure the performance of the large and mid cap segments of the US market. The index covers approximately 85% of the free float-adjusted market capitalization in the US. (Start Date: Mar 31, 1986)
- MSCI China All Shares Index captures large and mid-cap representation across China A‐shares, B‐shares, H‐shares, Red‐chips, P‐ chips and foreign listings (e.g. ADRs). The index aims to reflect the opportunity set of China share classes listed in Hong Kong, Shanghai, Shenzhen and outside of China. It is based on the concept of the integrated MSCI China equity universe with China A-shares included.
- Volatility is a statistical measure of the dispersion of returns for a given security or market index.
- Price-Earnings Ratio (P/E ratio) is the ratio for valuing a company that measures its current share price relative to its per-share earnings.
- Forward Price-to-Earnings (P/E) is a current stock's price over its estimated earnings per share.
- Forward Price-to-Booking (P/B) compares a firm's market to book value by dividing price per share by book value per share.
- Forward Price/Earnings to Growth (PEG) a stock's price-to-earnings (P/E) ratio divided by the growth rate of its earnings for a specified time period.
- Data from Bloomberg as of 1/31/2019
- Data from Bloomberg as of 1/31/2019
- Data from Bloomberg as of 12/31/2018, retrieved 1/31/2019.
- Data from Bloomberg as of 1/31/2019
- Data from the World Bank as of 12/31/2017, retrieved 1/31/2019.
- International Telecommunications Union statistics database as of 12/31/2017, retrieved 1/31/2019.
- National Bureau of Statistics in China, “Total Retail Sales of Consumer Goods in December 2018” Retrieved 1/31/2019. Note: Figures converted from Chinese Renminbi to USD
- McKinsey Global Institute, “Urban World: The Global Consumers to Watch”, 2016, retrieved 1/31/2019.
- Internetlivestats.com as of 12/31/2016, retrieved on 1/31/2019.
- Data from Bloomberg as of 12/31/2018, retrieved 1/31/2019. The top 5 emerging market ETFs calculated by total Fund Assets as of 12/31/2018.
This material represents the managers opinion. It should not be regarded as investment advice or recommendation of specific securities.
The KraneShares ETFs are distributed by SEI Investments Distribution Company (SIDCO), 1 Freedom Valley Drive, Oaks, PA 19456, which is not affiliated with Krane Funds Advisors, LLC, the Investment Adviser for the Fund. Additional information about SIDCO is available on FINRA’s BrokerCheck.