FTSE Russell Includes U.S.-listed Chinese Tech Companies

The growing influence that index providers command over capital markets is a recurring theme for us here at KraneShares. We have written extensively about the impact MSCI had when it included U.S.-listed Chinese companies (N-shares) two years ago, and also about MSCI’s recently announced inclusion of Shanghai and Shenzhen listed securities (A-shares) poised to commence in June 2018.
Today we examine yet another prominent index inclusion. On Friday September 15, 2017, FTSE Russell commenced the inclusion of N-shares within their FTSE Emerging Index1 for the first time. We believe FTSE’s inclusion may have a similar effect on the market as the previous MSCI N-share inclusion, which provided a sustained boost to China’s internet sector.
The ETF industry is growing extremely rapidly around the world. The latest numbers from independent ETF analysis firm, ETFGI, put global ETF assets over $4 trillion as of August 2017. ETFs are passive investment vehicles that track indexes to determine which stocks they invest in. The goal of the index provider is to create rules that represent specific segments of the market, such as U.S. equities, healthcare, or China for example. The problem is the markets are complex and oftentimes these rules create index outliers excluded from the pack for various reasons.
The most famous example of this phenomenon is Alibaba. The firm listed on the New York Stock Exchange in 2014 and still holds the record of largest IPO in U.S. history2. Even with this enormous market capitalization, currently around $455 billion3, FTSE Russell and MSCI still initially excluded Alibaba from their China oriented indexes because it listed in the U.S. and not Hong Kong.
While Alibaba is the largest U.S.-listed Chinese company, many prominent Chinese technology companies have also listed in the United States to access a more international investor base. Sina Corporation began the trend after listing in the United States in 2000, paving the way for other Chinese companies to list in the U.S., like Baidu (2005), JD.com (2014) and about 120 others; representing a market cap of $822 billion4. We believe the addition of these technology companies to the FTSE Russell index may be additive to performance over the long run.
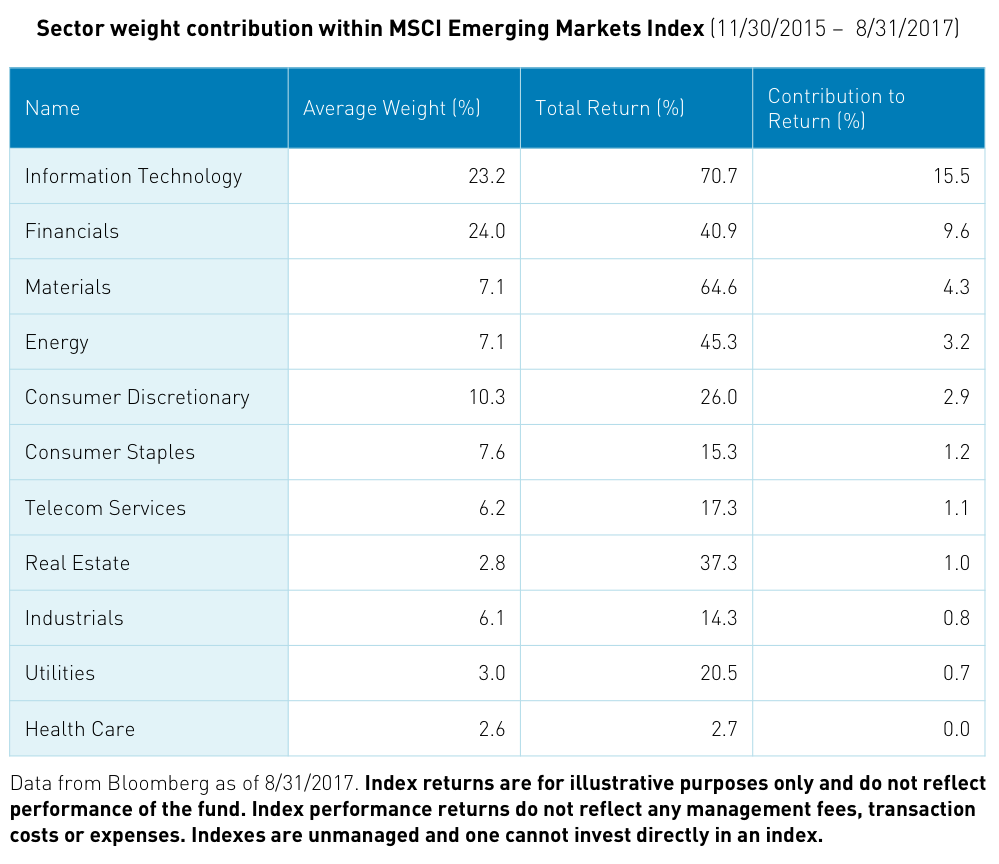
MSCI decided to add U.S.-listed Chinese companies in two stages on December 1st 2015 and June 1st 2016. The addition of U.S.-listed Chinese companies has had a dramatic effect on the performance and composition of MSCI Emerging Markets5.
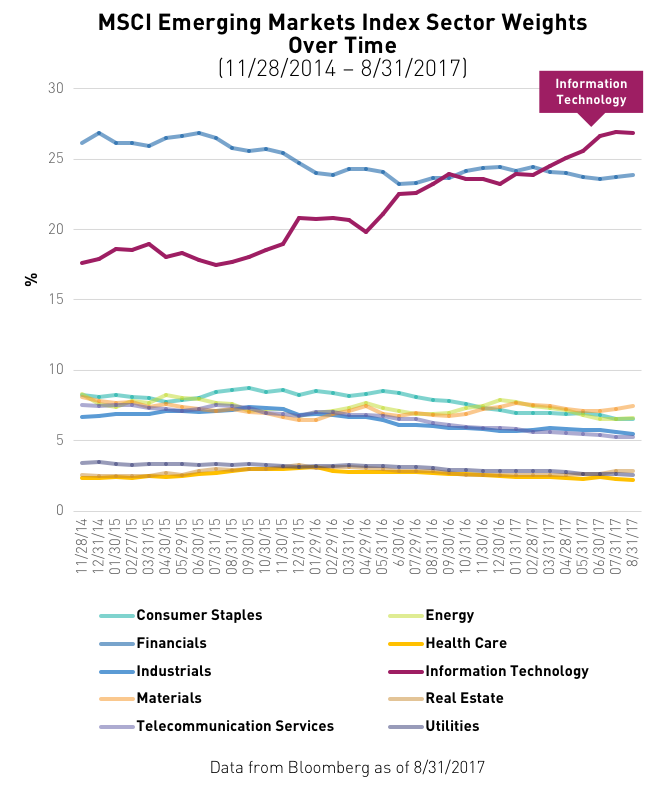
Those ETFs and index funds benchmarked to MSCI Emerging Markets have benefitted from this inclusion. From November 30, 2015 to August 31, 2017, technology stocks, propelled by newly included U.S.-listed Chinese companies, have risen 70.71% and contributed 15.5% of the index’s 40.35% gain6.
While its hard to say exactly how much of China tech’s outperformance since November 30, 2015 can be attributed to N-share inclusion within MSCI’s indexes, we believe the increased investor base and expanded liquidity that accompanies inclusion has provided a strong tailwind.
We believe the FTSE Russell N-share inclusion may have a similar long-term effect on the sector. The inclusion will take place over four phases. Phase one occurred Friday September 15, 2017, subsequent phases are slated for December 2017, March 2018 and June 2018.
Stepping back from broad emerging markets for a moment, we believe there is a strong case for making the China tech sector a stand-alone position in investors’ portfolios. We included U.S.-listed Chinese companies when we launched the KraneShares CSI China Internet ETF (KWEB) over four years ago. As we have previously written, these companies have four attributes that can be found amongst great companies globally:
- Company founder is CEO
- Management has a high stock ownership
- Company operating in the growth sector of the economy
- Company has a highly competitive advantage
KWEB’s portfolio holdings recently completed their second quarter earnings. The impressive results underscore our belief that these companies are the transmission engine of China’s growing domestic consumption and economic evolution.
While investors’ broad emerging market ETFs will now most likely include the U.S.-listed KWEB companies going forward, their impact will not be as significant among hundreds of other holdings and their overall weight within FTSE Emerging markets will be small. After the first phase of inclusion U.S.-listed Chinese companies only accounted for 1.7% of the FTSE Emerging Markets Index as of September 18, 2017. We believe this number will rise to around 6.8% only after the final round of inclusion in June 20187.
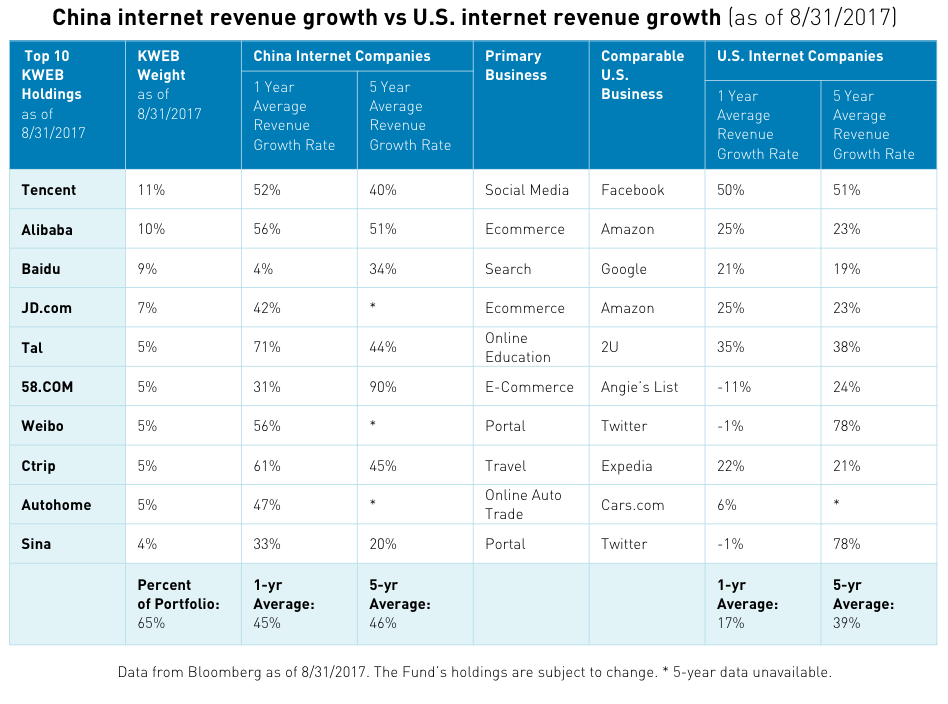
KWEB covers 94% of the market cap of U.S.-listed Chinese companies8. We believe KWEB may potentially benefit from the stabilizing force of institutional flows being directed to its holdings due to inclusion into the world’s most popular indexes. Additionally, KWEB’s top holdings delivered revenue growth rates that we believe are very difficult to find elsewhere in today’s low global growth environment. For these reasons, we believe KWEB may merit a standalone position, separate from broader Emerging Markets, within portfolios.
Click here for KWEB standard performance as of most recent month end.
This article is intended for educational purposes only and should not be construed as investment advice. All opinions or views expressed in this article are current only as of the date of this article and are subject to change without notice.
- The FTSE Emerging Index is a free-float, market-capitalization weighted index representing the performance of around 850 large and mid cap companies in 22 emerging markets
- "The 5 Biggest U.S. IPOs of All Time", FINRA.org, 5/5/2017
- Data from Bloomberg as of 8/31/2017
- Data from Bloomberg as of 8/31/2017
- The MSCI Emerging Markets Index captures large and mid cap representation across 23 Emerging Markets (EM) countries. With 834 constituents, the index covers approximately 85% of the free float-adjusted market capitalization in each country.
- Data from Bloomberg as of 8/31/2017
- Data from Bloomberg as of 9/19/2017
- Data from Bloomberg as of 9/19/2017
The KraneShares ETFs are distributed by SEI Investments Distribution Company (SIDCO), 1 Freedom Valley Drive, Oaks, PA 19456, which is not affiliated with Krane Funds Advisors, LLC, the Investment Adviser for the Fund. Additional information about SIDCO is available on FINRA’s BrokerCheck.