China Diverges From The Rest of Emerging Markets
By Anthony Sassine, CFA

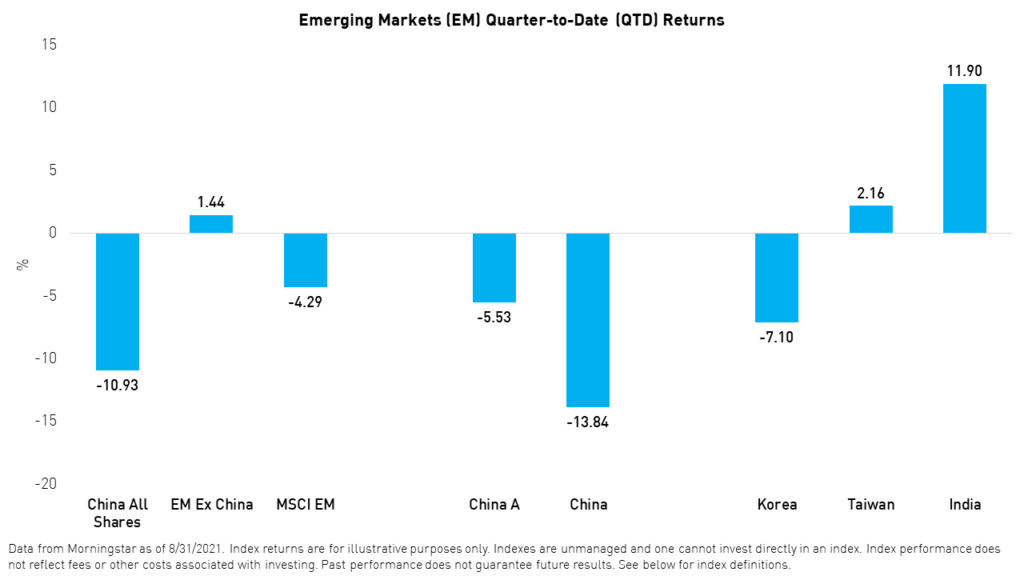
We believe China’s differentiated risk and return characteristics, especially when compared to the rest of emerging markets (EM), warrant its consideration as an asset class in its own right. We believe China could behave differently, for better or for worse, from the rest of emerging markets. We have certainly seen this idea come to life again during this year and quarter.
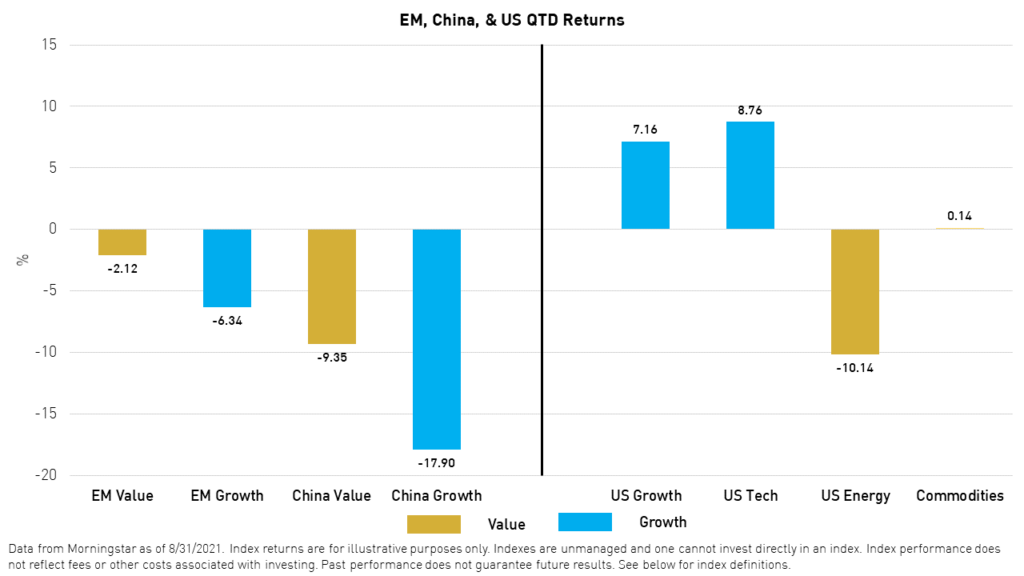
In our last EM commentary, we noted that the value rally might be coming to an end. Emerging markets value has rebounded and outperformed emerging markets growth so far this quarter. However, as we peel back the layers, we realize that the growth drag has been uniquely driven by the decline in China's growth companies due to the ongoing regulatory crackdown. Emerging markets ex-China growth continued to perform well. Furthermore, commodities underperformed, US technology rebounded, and the yield on the 10-year U.S. Treasury continued to hover steadily in the 1.20 to 1.30%3 range. All these data are pointing in the direction of a divergence between growth companies located in China and those situated in emerging markets other than China.
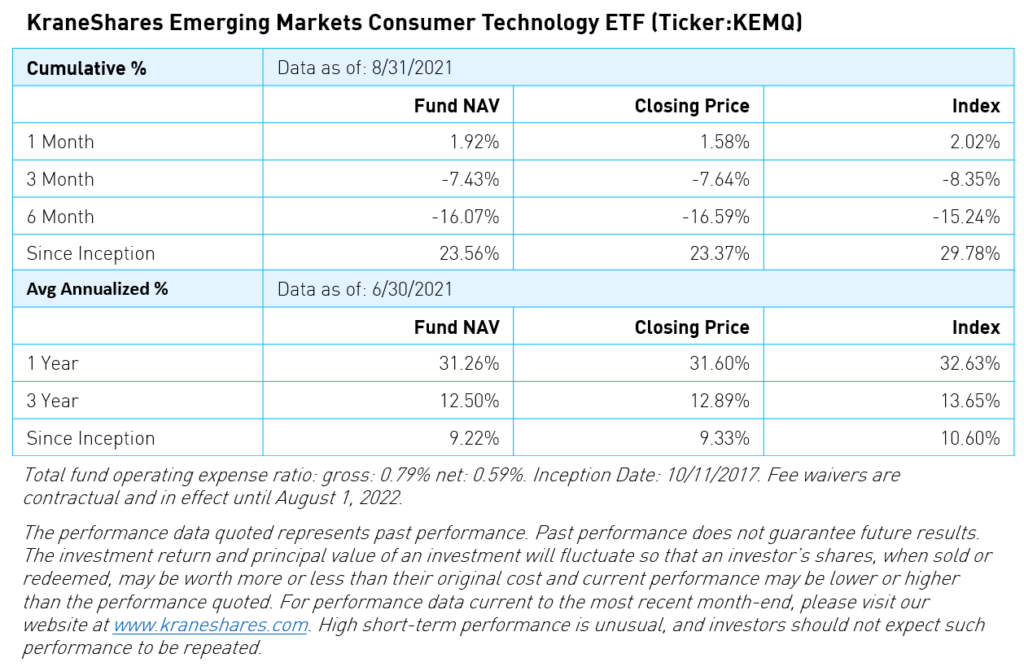
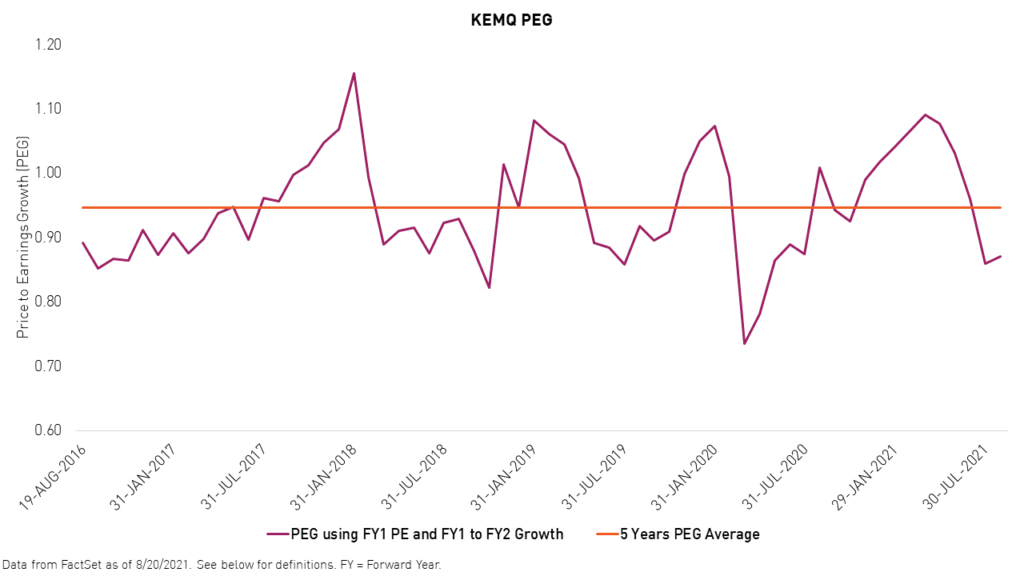
The KraneShares Emerging Markets Consumer Technology fund (KEMQ) returned -11.01%1 for the quarter-to-date period, underperforming the MSCI EM Index, which returned -4.29%1 for the period. For the year-to-date period, KEMQ returned -9.16%1 vs. 2.84%1 for MSCI EM. China consumer technology companies led by education stocks were the largest detractors by far from the fund’s year-to-date relative performance versus the MSCI EM index. On the other hand, consumer discretionary companies in Korea, Taiwan, and Argentina added to the year-to-date’s relative performance. The recent underperformance of KEMQ has resulted in a PEG ratio of 0.87, which is well below the fund's long-term average.
KEMQ's diversification rules, which include a maximum country exposure of 40% and a maximum holding weight of 3.5% at rebalance, helped the fund's relative performance year-to-date. We believe the Fund is well diversified providing investors with a balanced exposure to some of the most exciting companies across emerging markets.
We still believe the value rally is running out of steam. We believe this will become more apparent as China internet stocks recover from their record lows. We are starting to see more clarity from the Chinese regulators recently in the form of directives aimed to regulate and organize China’s massive digital economy while promoting common prosperity. Meanwhile, US markets continue to exhibit stretched valuations on an absolute basis and display a multi-year high valuation premium relative to emerging markets. While inflation worries seem to be in the rearview mirror for now, risks from slowing growth and the delta variant continue to worry investors. The latest jobs report was not as strong as expected, reshuffling the cards in favor of the U.S. Federal Reserve, potentially proving its point that the current pickup in growth and inflation is transitory in nature. That could mean potentially delaying the start of the tapering process to the second quarter of 2022. Despite the short-term noise, we continue to believe that emerging markets and China have many positive attributes to offer investors in the coming months and years.
Diversification does not ensure a profit or guarantee against a loss.
Citations:
- Morningstar
- KraneShares
- Bloomberg
Definition:
Price to Earnings Growth (PEG): A stock's price-to-earnings (P/E) ratio divided by the growth rate of its earnings for a specified time period. The PEG ratio is used to determine a stock's value while also factoring in the company's expected earnings growth, and it is thought to provide a more complete picture than the more standard P/E ratio.
Index Definitions:
The MSCI China All Shares Index: (referred to as China All-Shares herein) captures large and mid-cap representation across China A‐shares, B‐shares, H‐shares, Red‐chips, P‐ chips and foreign listings (e.g., ADRs). The index aims to reflect the opportunity set of China share classes listed in Hong Kong, Shanghai, Shenzhen and outside of China.
The MSCI Emerging Markets ex China Index: (referred to as EM ex-China herein) captures large and mid-cap representation across 25 of the 26 Emerging Markets (EM) countries* excluding China. With 702 constituents, the index covers approximately 85% of the free float-adjusted market capitalization in each country.
The MSCI Emerging Markets Index Net Return: (referred to as MSCI EM index herein) defined as MSCI EM NR USD captures large and mid-cap representation across 23 Emerging Markets (EM) countries.
China’s Equity (Stock) Market: For the purposes of this presentation, this refers to the superset of investments including the Mainland, Hong Kong, and overseas listed securities found in the MSCI China All Shares Index. Note that others may use a different definition and, as such, the data provided by other sources may not match ours as it may exclude shares listed in certain places.
MSCI China A Index: (referred to as China A herein): Inception Date: Nov 25, 2008. The MSCI China A Index captures large and mid-cap representation across China securities listed on the Shanghai and Shenzhen exchanges. The index covers only those securities that are accessible through “Stock Connect”. The index is designed for international investors and is calculated using China A Stock Connect listings based on the offshore RMB exchange rate (CNH).
MSCI Korea Index: (referred to as Korea herein): Inception Date: Mar 31, 1989. The MSCI Korea Index is designed to measure the performance of the large and mid-cap segments of the South Korean market. The index covers about 85% of the Korean equity universe.
MSCI Taiwan Index: (referred to as Taiwan herein): Inception Date: Jul 31, 1989. The MSCI Taiwan Index is designed to measure the performance of the large and mid-cap segments of the Taiwan market. The index covers about 85% of the free float-adjusted market capitalization in Taiwan.
MSCI India Index: (referred to as India herein): Inception Date: Apr 30, 1993. The MSCI India Index is designed to measure the performance of the large and mid-cap segments of the Indian market. The index covers approximately 85% of the Indian equity universe.
MSCI Brazil Index: (referred to as Brazil herein): Inception Date: Jan 01, 2001. The MSCI Brazil Index is designed to measure the performance of the large and mid-cap segments of the Brazilian market. The index covers about 85% of the Brazilian equity universe.
MSCI EM Value Index: (referred to as EM Value herein) Inception Date: Dec 08, 1997 The MSCI Emerging Markets Value Index captures large and mid cap securities exhibiting overall value style characteristics across 27 Emerging Markets (EM) countries*. The value investment style characteristics for index construction are defined using three variables: book value to price, 12-month forward earnings to price and dividend yield.
MSCI EM Growth Index: (referred to as EM Growth herein) Inception Date: Dec 08, 1997. The MSCI Emerging Markets Growth Index captures large and mid-cap securities exhibiting overall growth style characteristics across 27 Emerging Markets (EM) countries*. The growth investment style characteristics for index construction are defined using five variables: long-term forward EPS growth rate, short-term forward EPS growth rate, current internal growth rate and long-term historical EPS growth trend and long-term historical sales per share growth trend.
MSCI China Value Index: (referred to as China Value herein) Inception Date December 8, 1997. The index captures large and mid-cap Chinese securities exhibiting overall value style characteristics. The value investment style characteristics for index construction are defined using three variables: book value to price, 12-month forward earnings to price and dividend yield.
MSCI China Growth Index: Inception Date December 8, 1997. The index captures large and mid cap securities exhibiting overall growth style characteristics across the Chinese equity markets. The growth investment style characteristics for index construction are defined using five variables: long-term forward EPS growth rate, short-term forward EPS growth rate, current internal growth rate and long-term historical EPS growth trend and long-term historical sales per share growth trend.
S&P 500 Energy Index (referred to as US Energy herein) Date June 28, 1996. The index comprises those companies included in the SP 500 that are classified in the energy sector.
Russell 1000 Growth Index : (referred to as US Growth herein) Inception Data January 1, 1987. The Russell 1000 Growth index measures the performance of the Russell 1000's growth segment, which is defined to include firms whose share prices have higher price-‐to-‐book ratios and higher expected earnings growth rates.
Dow Jones Commodity Index (DJCI): (referred to as Commodities herein) Inception year is 1998. The index is a weighted index that tracks a wide range of 28 different commodity futures contracts, including metals, agricultural products, and energy commodities such as oil and gas.