Emerging Markets: Did the Value Cycle Become a Value Phase?

By Anthony Sassine, CFA & Henry Greene
While inflation concerns and a global reopening-driven value rebound remained top of mind for investors throughout Q2, growth sectors made a comeback in June. Furthermore, Q2 was a reminder that emerging markets (EM) are a diverse tapestry of countries and sectors, each with its own risk and return profile. While overseas-listed China internet companies came under pressure due to increased regulatory scrutiny, E-Commerce and fintech platforms in Latin America and Asia ex-China saw their shares soar. We believe market events in Q2 highlight the potential benefits of diversification in your exposure to EM consumer technology.
Global Macro Impacting Emerging Markets (EM)
The inflation saga in the U.S. continued to impact global equities and emerging markets in the second quarter of 2021. As the pace of the U.S. recovery gained momentum, pressure began to mount on the Fed to reconsider its loose monetary policy stance. The debate remains whether the current inflation is transitory or persistent due to supply-side shortages and massive fiscal stimulus. In its meeting on June 15-16, the Fed made some concessions to the market by recognizing higher inflation and updating its dot-plot to include two rate hikes in 2023. However, Chairman Powell reiterated that current inflation appears to be transitory.
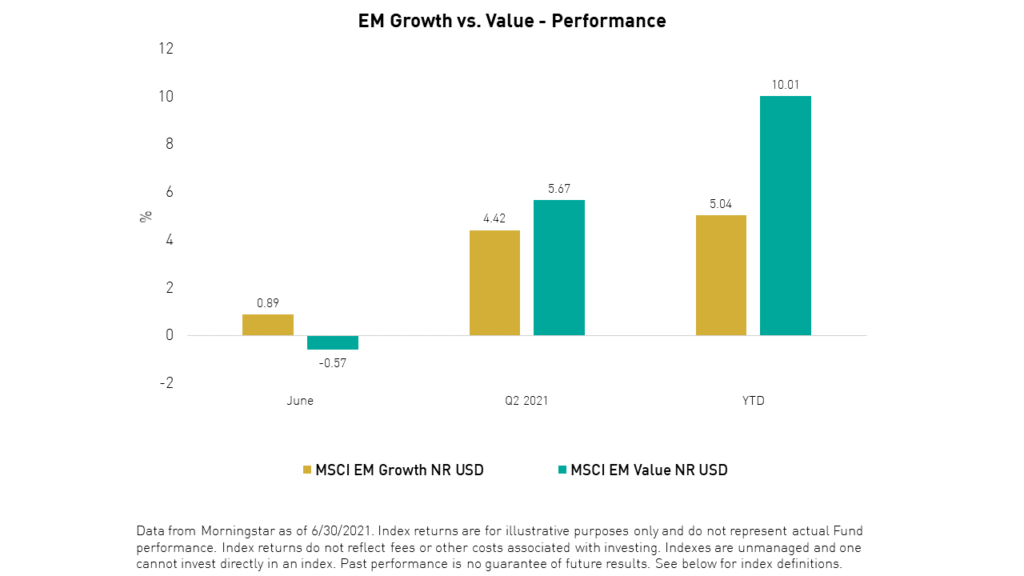
Amid this debate, the tug-of-war between value and growth stocks continued as value stocks outperformed in the first half of the second quarter, and growth stocks fought back in June. Value stocks lost their momentum after four months of outperformance. If history is any indication, the current value cycle may be nearing its end.
EM Consumer Technology Performance Overview
The KraneShares Emerging Markets Consumer Technology ETF (Ticker: KEMQ) tracks the Solactive Emerging Markets Consumer Technology Index, which represents the EM consumer technology sector. The index underperformed the MSCI EM index during the second quarter, gaining 4.49% compared to 5.08% for the MSCI EM Index.2 However, over the long term, EM consumer technology continues to outperform the MSCI EM index. For the 3-year period ending on June 30, 2021, the Solactive EM Consumer Technology Index gained 46.81% versus 39.10% for the MSCI EM Index.2
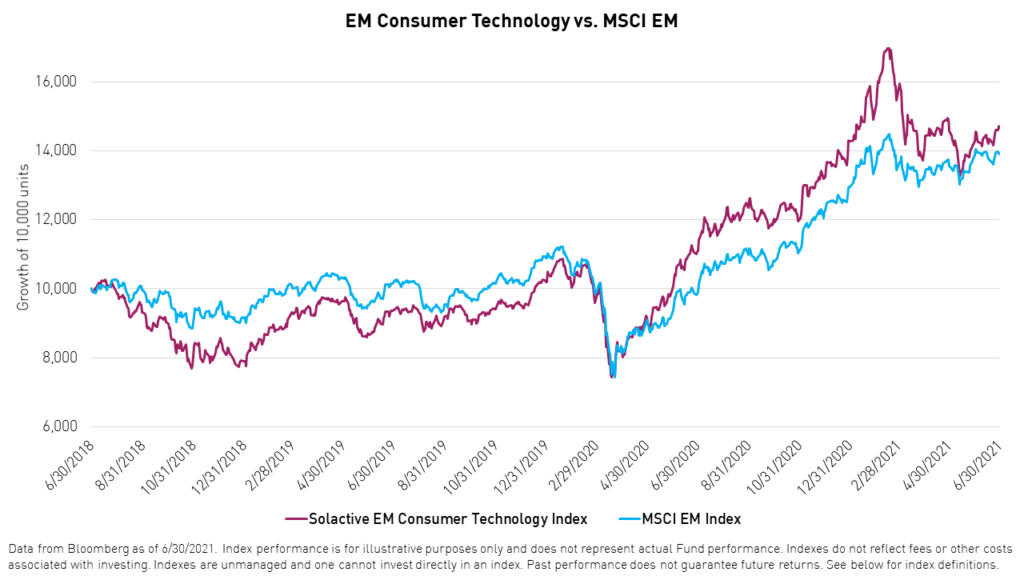
The underperformance during the second quarter was mainly driven by Chinese consumer technology companies, which suffered due to increased regulatory scrutiny. Conversely, consumer technology companies in other emerging markets thrived during the second quarter, offsetting much of the losses in China.
TAL Education and New Oriental Education were among the worst performers during the quarter as China’s government seeks to limit students' exposure to after-hours tutoring to reduce stress and cost on families and children. On the other hand, MOMO.com, Taiwan’s main E-Commerce company, and KAKAO, Korea’s largest social media company, both thrived in the second quarter, returning 94.70% and 64.47%, respectively. SEA LTD, B2W CIA Digital, and Pago Seguro Digital were also among to top companies that contributed positively to the index’s performance.2
Recent market events served as another reminder of the benefits of the index’s diversification features, which helped soften the blow from mounting regulatory risks in the second quarter. The Solactive Emerging Markets Consumer Technology Index has a maximum weight of 3.5% (at rebalance) on single companies and a maximum weight of 40% (at rebalance) on Chinese stocks, ensuring a significant exposure to consumer technology companies in other emerging markets.
Emerging Markets Overview
Economic activity in emerging markets was mixed. Some emerging market countries benefited from the restart of the global economy and the rise in commodity prices, especially oil, while others lagged due to domestic challenges such as regulations and restrictions on mobility due to renewed COVID-19 outbreaks. Commodity facing countries in general such as Saudi Arabia, Russia, and Brazil performed well overall. In Brazil, a rate increase in June and the signaling of a similar hike in August, in addition to the waning popularity of the Bolsonaro administration, helped its currency and its dollar-based returns. India’s performance was average during the quarter after a tough start to the quarter due to a severe COVID-19 outbreak. Economic activity and the stock market rebounded starting in May as cases declined.
In China, the Mainland market performed better than the offshore stocks as the MSCI China A Index rose 9.19%1 versus 2.27%1 for the MSCI China Index, which is 90% offshore.2 China’s economy posted strong numbers in the second quarter and the monetary tightening post-COVID was less than expected. Mainland-listed companies in healthcare, industrials, and information technology recuperated during the second quarter. Meanwhile, the antitrust push initiated by the Chinese government weighed on the performance of many leading Chinese internet companies listed in the US and Hong Kong.
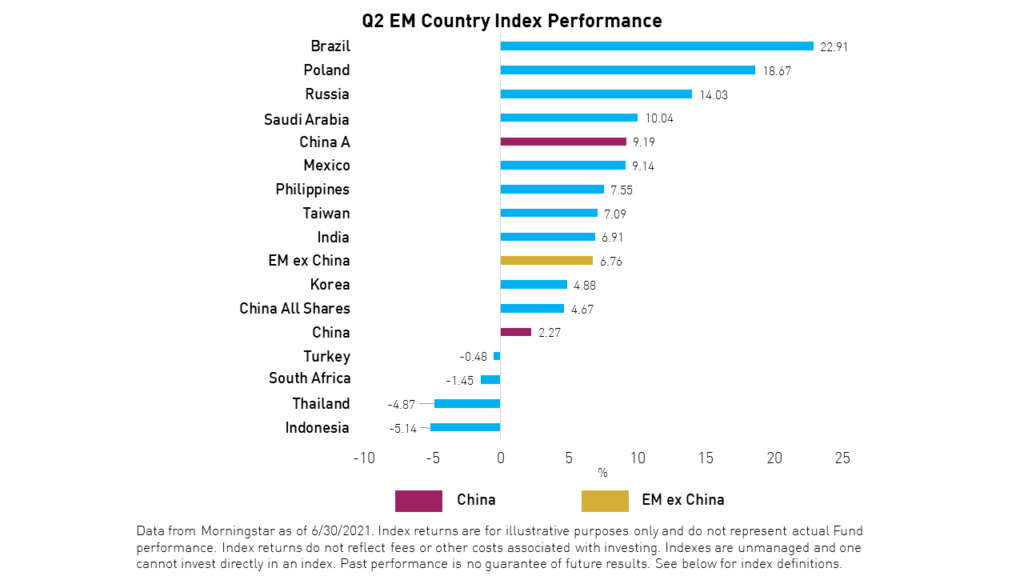
Taiwan outperformed broad emerging markets as strong semiconductor demand globally helped its technology companies. The Taiwanese dollar continued to rise versus the U.S. dollar during the quarter. The semiconductor shortages also benefited Korea’s stock market, adding to the rewards of the country’s robust internet and export sectors’ growth. Korea is a bellwether for global trade, which has recovered as vaccination spread especially in the U.S. and Europe.
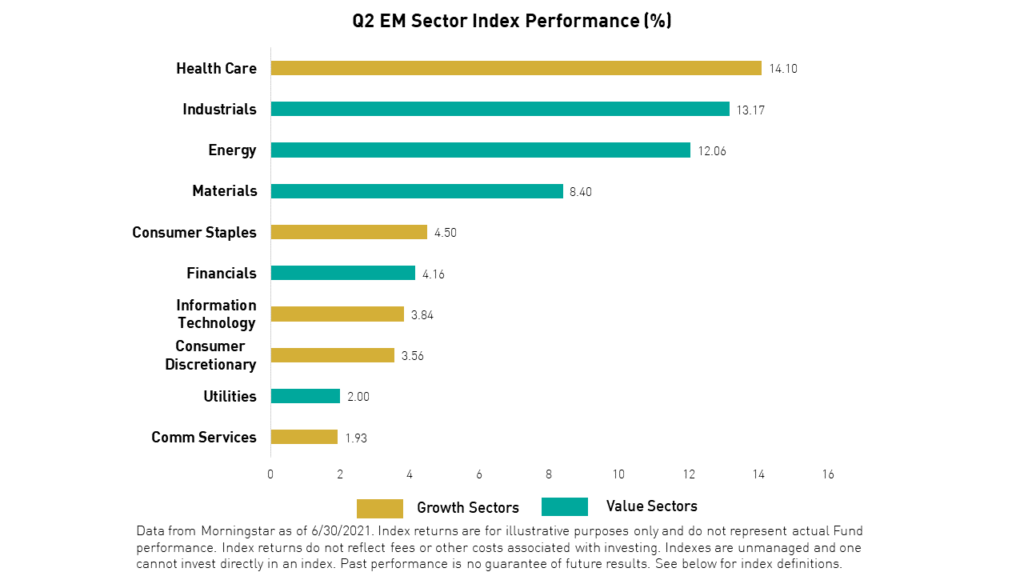
On a sector level, health care and industrials performed well followed by energy and materials. However, the growth-oriented communication services and consumer discretionary sectors continued to lag in Q2.
EM Value vs. Growth
Growth stocks saw green shoots break ground in mid-May and grow taller following the Fed’s June meeting. The initial market reaction following the meeting favored higher rates and value stocks, but it quickly reversed direction. The consumer discretionary and information technology sectors in emerging markets performed well at the expense of value sectors in June. The energy sector was the only performance standout among the value sectors as oil rose 7%2 during the month. Value may have lost its momentum. Value outperformed growth by almost 5%1 in the first quarter of 2021 and 1.15%1 in Q2. In June, value underperformed by 1.46%1.
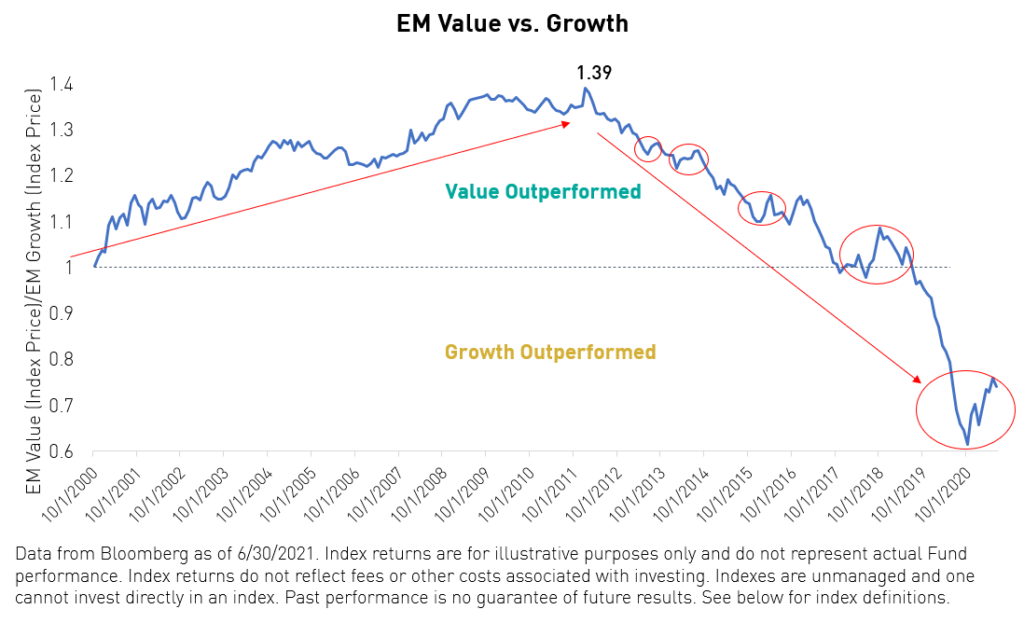
Value rallies are not uncommon in emerging markets. We have witnessed multiple rallies since 2012, the beginning of EM growth’s spectacular run. The outperformance of EM value is usually driven by inflation fears, rising yields as seen in 2013, 2018, or extreme market stress as in 2015. These value rebounds usually last for a few months before passing the baton back to growth stocks.
We believe growth may dominate in the long run for two key reasons:
- The globe is in the midst of a technological transformation that is creating many opportunities for growth.
- Emerging markets are inherently growth-oriented and led by potent secular themes such as digitalization, demographics, urbanization, and the rise of the middle-class consumer.
If history and recent market action are any indication, the value cycle may be nearing its end.
Outlook
Inflation will be key to watch for the next few months. If the Fed proves to be wrong on its inflation stance, we may experience another bout of market volatility. This may not impact all emerging markets equally. Countries with wide current account/fiscal deficits and those reliant on external funding will be impacted most. But, in general, a rising U.S. dollar and yields should not have an impact on the bottom line of many emerging markets countries, especially those with strong domestic demand.
Furthermore, investors’ positioning in emerging markets is currently low and valuations in EM are inexpensive compared to valuations in developed markets. Metrics such as Price to Earnings (P/E), Price to Book (P/B), and Forward P/E indicate more than 1 standard deviation of cheapness for emerging markets versus developed. Taiwan and Korea may be best positioned to perform well going forward, in addition to India if the recovery continues. China, on the other hand, is attractive from a valuation and growth perspective. However, investors are patiently awaiting more clarity on the regulatory front.
Re-rating can happen very quickly as risks dissipate, which is why we believe maintaining exposure to both China and other emerging markets is important.
Diversification does not ensure a profit or guarantee against a loss.
Citations:
- Data from Morningstar as of 6/30/2021
- Data from Bloomberg as of 6/30/2021
- Data from KraneShares as of 7/5/2021
Term Definitions:
Price to Earnings (P/E): the ratio for valuing a company that measures its current price relative to its per-share earnings (EPS).
Price to Book (P/B): The ratio for valuing a company that divides a company’s stock price per share by its book value per share (BVPS).
Forward P/E: Forward price to earnings is a version of the ratio of price-to-earnings (P/E) that uses forecasted earnings for the P/E calculation.
Standard Deviation: A statistic that measures the dispersion of a dataset relative to its mean. The standard deviation is calculated as the square root of variance by determining each data point's deviation relative to the mean.
KEMQ Holdings Mentioned:
- TAL Education (2.19% of KEMQ Net Assets as of 6/30/2021)
- New Oriental Education & Technology (2.36% of KEMQ Net Assets as of 6/30/2021)
- MOMO.com (3.49% of KEMQ Net Assets as of 6/30/2021)
- KAKAO (3.04% of KEMQ Net Assets as of 6/30/2021)
- SEA LTD (3.54% of KEMQ Net Assets as of 6/30/2021)
- B2W CIA Digital (2.44% of KEMQ Net Assets as of 6/30/2021)
- Pago Seguro (2.63% of KEMQ Net Assets as of 6/30/2021)
Index Definitions
Solactive Emerging Markets Consumer Technology Index: (referred to as "EM Consumer Technology" herein) The Solactive Emerging Markets Consumer Technology Index selects companies from 26 eligible countries within emerging markets whose primary business or businesses are internet retail, internet software/services, purchase, payment processing, or software for internet and E-Commerce transactions.
The MSCI Emerging Markets ex-China Index (referred to as EM ex-China herein) captures large and mid-cap representation across 25 of the 26 Emerging Markets (EM) countries* excluding China. With 702 constituents, the index covers approximately 85% of the free float-adjusted market capitalization in each country.
The MSCI Emerging Markets Index Net Return Index (referred to as MSCI EM index and MSCI EM NR USD herein) captures large and mid-cap representation across 23 Emerging Markets (EM) countries.
MSCI China A Index (referred to as "China-A" herein): Inception Date: Nov 25, 2008. The MSCI China A Index captures large and mid-cap representation across China securities listed on the Shanghai and Shenzhen exchanges. The index covers only those securities that are accessible through “Stock Connect”. The index is designed for international investors and is calculated using China A Stock Connect listings based on the offshore RMB exchange rate (CNH).
MSCI Korea Index (referred to as "Korea" herein): Inception Date: Mar 31, 1989. The MSCI Korea Index is designed to measure the performance of the large and mid-cap segments of the South Korean market. The index covers about 85% of the Korean equity universe.
MSCI Taiwan Index (referred to as "Taiwan" herein): Inception Date: Jul 31, 1989. The MSCI Taiwan Index is designed to measure the performance of the large and mid-cap segments of the Taiwan market. The index covers about 85% of the free float-adjusted market capitalization in Taiwan.
MSCI India Index (referred to as "India" herein): Inception Date: Apr 30, 1993. The MSCI India Index is designed to measure the performance of the large and mid-cap segments of the Indian market. The index covers approximately 85% of the Indian equity universe.
MSCI Brazil Index (referred to as "Brazil" herein): Inception Date: Jan 01, 2001. The MSCI Brazil Index is designed to measure the performance of the large and mid-cap segments of the Brazilian market. The index covers about 85% of the Brazilian equity universe.
MSCI South Africa Index (referred to as "South Africa" herein): Inception Date: Jan 01, 2001. The MSCI South Africa Index is designed to measure the performance of the large and mid-cap segments of the South African market. The index covers approximately 85% of the free float-adjusted market capitalization in South Africa.
MSCI EM Value Index: Inception Date: Dec 08, 1997 The MSCI Emerging Markets Value Index captures large and mid cap securities exhibiting overall value style characteristics across 27 Emerging Markets (EM) countries*. The value investment style characteristics for index construction are defined using three variables: book value to price, 12-month forward earnings to price and dividend yield.
MSCI EM Growth Index: Inception Date: Dec 08, 1997. The MSCI Emerging Markets Growth Index captures large and mid-cap securities exhibiting overall growth style characteristics across 27 Emerging Markets (EM) countries*. The growth investment style characteristics for index construction are defined using five variables: long-term forward EPS growth rate, short-term forward EPS growth rate, current internal growth rate and long-term historical EPS growth trend and long-term historical sales per share growth trend.
MSCI Poland Index (referred to as "Poland" herein) Inception date: Sep 30, 1994. The MSCI Poland Index is designed to measure the performance of the large and mid cap segments of the Polish market. With 14 constituents, the index covers approximately 85% of the Polish equity universe.
MSCI Russia Index: (referred to as "Russia" herein) Inception date: Dec 01, 1996. The MSCI Russia Index is designed to measure the performance of the large and mid cap segments of the Russian market. With 25 constituents, the index covers approximately 85% of the free float-adjusted market capitalization in Russia.
MSCI Saudi Arabia Index: (referred to as "Saudi Arabia" herein) Inception date: Oct 03, 2014. The MSCI Saudi Arabia Index is designed to measure the performance of the large and mid-cap segments of the Saudi Arabia market. The index incorporates foreign ownership limit restrictions. With 36 constituents, the index covers approximately 85% of the free float-adjusted market capitalization in Saudi Arabia.
MSCI China Index: The MSCI China Index captures large and mid-cap representation across China A shares, H shares, B shares, Red chips, P chips and foreign listings (e.g. ADRs). With 703 constituents, the index covers about 85% of this China equity universe. Currently, the index includes Large Cap A and Mid-Cap A-shares represented at 20% of their free float-adjusted market capitalization. The index was launched on October 31, 1995.
MSCI Thailand Index: (Referred to as "Thailand" herein) Inception date: Jan 01, 2001. The MSCI Thailand Index is designed to measure the performance of the large and mid cap segments of the Thailand market. With 43 constituents, the index covers about 85% of the Thailand equity universe.
MSCI Indonesia Index: (Referred to as "Indonesia" herein) Inception date: Jan 01, 2001. The MSCI Indonesia Index is designed to measure the performance of the large and mid cap segments of the Indonesian market. With 22 constituents, the index covers about 85% of the Indonesian equity universe.
MSCI Turkey Index: (Referred to as "Turkey" herein) Inception date: Jan 31, 1990. The MSCI Turkey Index is designed to measure the performance of the large and mid cap segments of the Turkish market. With 11 constituents, the index covers about 85% of the equity universe in Turkey.
MSCI Philippines Index: (Referred to as "Philippines" herein) Inception date: Jan 01, 2001. The MSCI Philippines Index is designed to measure the performance of the large and mid cap segments of the Philippines market. With 17 constituents, the index covers about 85% of the Philippines equity universe.
MSCI Mexico Index: (Referred to as "Mexico" herein) Inception date: Jan 01, 2001. The MSCI Mexico Index is designed to measure the performance of the large and mid cap segments of the Mexican market. With 23 constituents, the index covers approximately 85% of the free float-adjusted market capitalization in Mexico.
MSCI Emerging Markets Health Care Index: (Referred to as "Health Care" herein) Inception date: Jan 01, 2001. The MSCI Emerging Markets Health Care Index is designed to capture the large and mid cap segments across 27 Emerging Markets (EM) countries around the world. All securities in the index are classified in the Health Care sector as per the Global Industry Classification Standard (GICS®).
MSCI Emerging Markets Industrials Index: (Referred to as "Industrials" herein) Inception date: Sep 15, 1999. The MSCI Emerging Markets Industrials Index captures large and mid cap representation across 27 Emerging Markets (EM) countries. All securities in the index are classified in the Industrials sector as per the Global Industry Classification Standard (GICS®).
MSCI Emerging Markets Energy Index: (Referred to as "Energy" herein) Inception date: Jan 01, 2001. The MSCI Emerging Markets Energy Index includes large and mid cap securities across 27 Emerging Markets (EM) countries. All securities in the index are classified in the Energy sector as per the Global Industry Classification Standard (GICS®).
MSCI Emerging Markets Materials Index: (Referred to as "Materials" herein) Inception date: Sep 15, 1999. The MSCI Emerging Markets Materials Index captures large and mid cap representation across 27 Emerging Markets (EM) countries. All securities in the index are classified in the Materials sector as per the Global Industry Classification Standard (GICS®).
MSCI Emerging Markets Consumer Staples Index: (Referred to as "Consumer Staples" herein) Inception date: Sep 15, 1999. The MSCI Emerging Markets Consumer Staples Index captures large and mid-cap representation across 27 Emerging Markets (EM) countries. All securities in the index are classified in the Consumer Staples sector as per the Global Industry Classification Standard (GICS®).
MSCI Emerging Markets Financials Index: (Referred to as "Financials" herein) Inception date: Jan 01, 2001. The MSCI Emerging Markets Financials Index captures large and mid cap representation across 27 Emerging Markets (EM) countries. All securities in the index are classified in the Financials sector as per the Global Industry Classification Standard (GICS®).
MSCI Emerging Markets Communication Services Index: (Referred to as "comm. services" herein) Inception date: Sep 15, 1999. The MSCI Emerging Markets Communication Services Index captures large and mid cap representation across 27 Emerging Markets (EM) countries. All securities in the index are classified in the Communication Services sector as per the Global Industry Classification Standard (GICS®).
MSCI Emerging Markets Consumer Discretionary Index: (Referred to as "Consumer Discretionary" herein) Inception date: Jan 01, 2001. The MSCI Emerging Markets Consumer Discretionary Index captures large and mid cap representation across 27 Emerging Markets (EM) countries*. All securities in the index are classified in the Consumer Discretionary sector as per the Global Industry Classification Standard (GICS®).
MSCI Emerging Markets Information Technology Index: (Referred to as "Information Technology" herein) Inception date: Sep 15, 1999. The MSCI Emerging Markets Information Technology Index is designed to capture the large and mid-cap segments across 27 Emerging Markets (EM) countries*. All securities in the index are classified in the Information Technology sector according to the Global Industry Classification Standard (GICS®).
MSCI Emerging Markets Utilities Index: (Referred to as "Utilities" herein) Inception date: Sep 15, 1999. The MSCI Emerging Markets Utilities Index captures large and mid-cap representation across 27 Emerging Markets (EM) countries*. All securities in the index are classified in the Utilities sector as per the Global Industry Classification Standard (GICS®).