Are Emerging Markets a Pain Point? Or is it Your Approach?

Investing pain comes in many flavors. “Shoulda woulda coulda” is one of our personal favorites, quickly followed by “position sizing”. Rebalancing can be easy on paper, but incredibly hard in practice. Holding a laggard over a long period of time is frustrating, and can feel like death by a thousand cuts. Eventually, the protracted pain of underperformance can be more than an investor can take. Today, it seems that US investors have reached the underperformance pain point with broad Emerging Markets (EM).
The three largest broad EM ETFs listed in the United States have seen redemptions of $13 billion year-to-date through June 30th, 20201. Investors not yet ready to throw in the towel completely on broad EM are growing increasingly creative with their strategy selection, it has to be the state-owned-enterprises (SOEs) that caused a decade of EM underperformance, right?
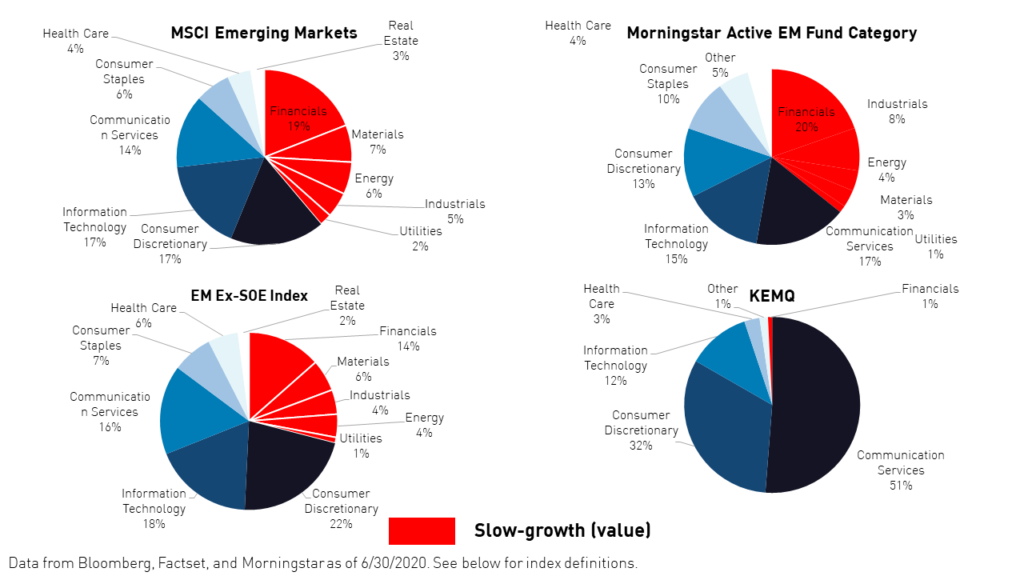
We have previously noted that broad EM has actually been dragged down by heavy weightings to “slow growth” sectors such as energy, financials, and materials. We would all agree that for the last decade growth stocks have outperformed value stocks handily in the United States and globally. We believe the same trend is materializing in Emerging Markets and that re-balancing accordingly may provide performance benefits.
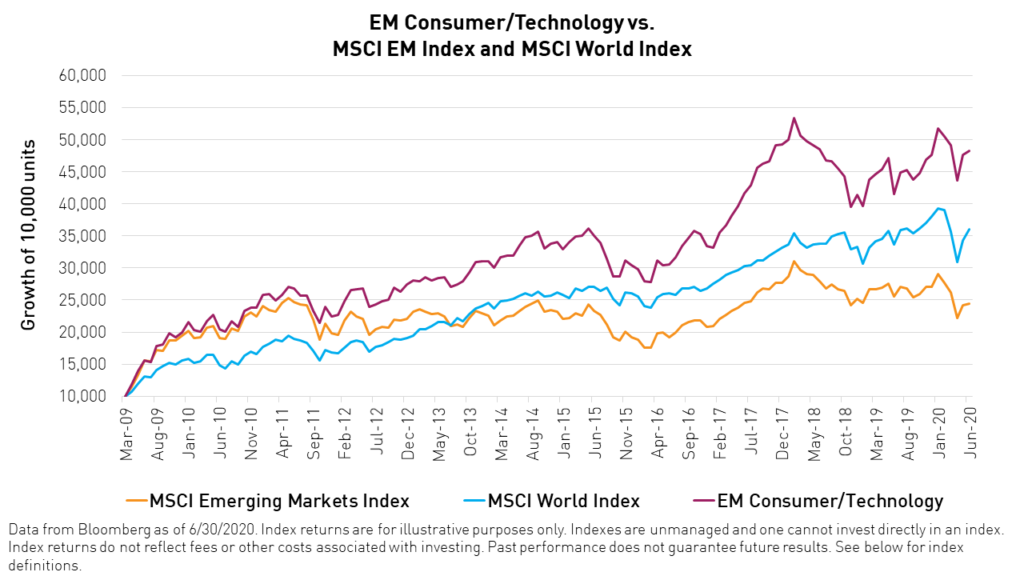
While taking a narrower approach to EM investing may involve higher volatility and industry concentration and non-diversification risks, many investors are downsizing their EM exposure anyway. In fact, investing only a small portion of one’s portfolio in EM may merit taking on a riskier allocation in order to achieve the desired result. Over the past decade, investors who adopted greater exposure to consumer technology in EM were rewarded as these sectors have outperformed broad EM and developed markets (as defined by the MSCI World Index).
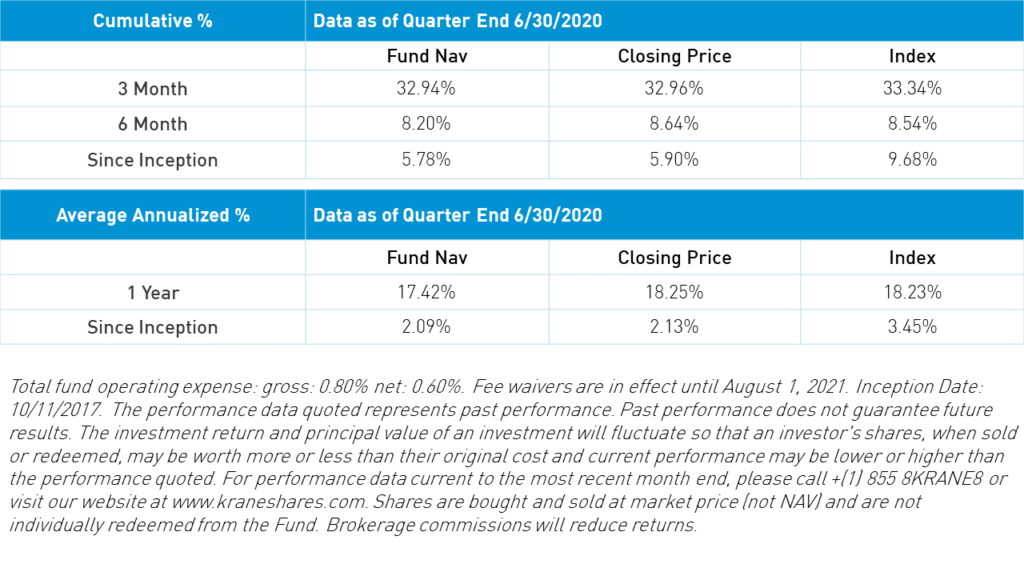
Investors can gain exposure to EM consumer technology through the KraneShares Emerging Markets Consumer Technology ETF (Ticker: KEMQ).
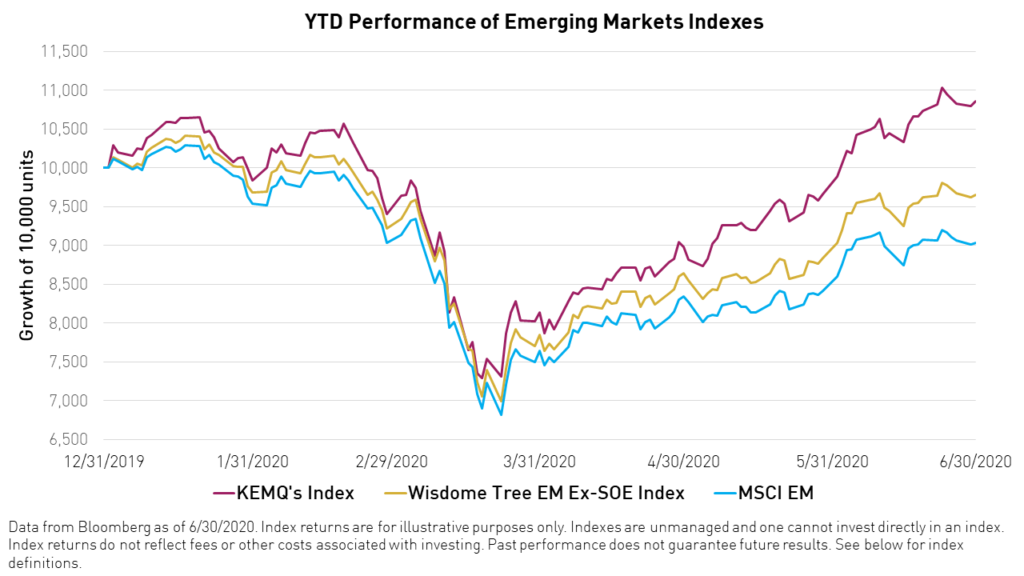
The outperformance of the KEMQ's index, the Solactive Emerging Markets Consumer Technology Index, which is designed to track the performance of consumer technology in EM, was notable during the Covid-19 Pandemic.
KEMQ offers a significantly higher exposure to growth sectors than broad-based Emerging Market benchmarks such as the Wisdom Tree EM Ex-SOE Index (EM Ex-SOE Index).
Year-to-date, sector allocation has accounted for most of the divergence between KEMQ and broad EM indexes. 2-factor attribution analysis is often used by portfolio managers to determine the underlying cause of the underperformance or outperformance of one portfolio compared to another. 2-factor attribution tells us whether sector selection or stock selection has had the greatest impact on portfolio performance over a period of time.
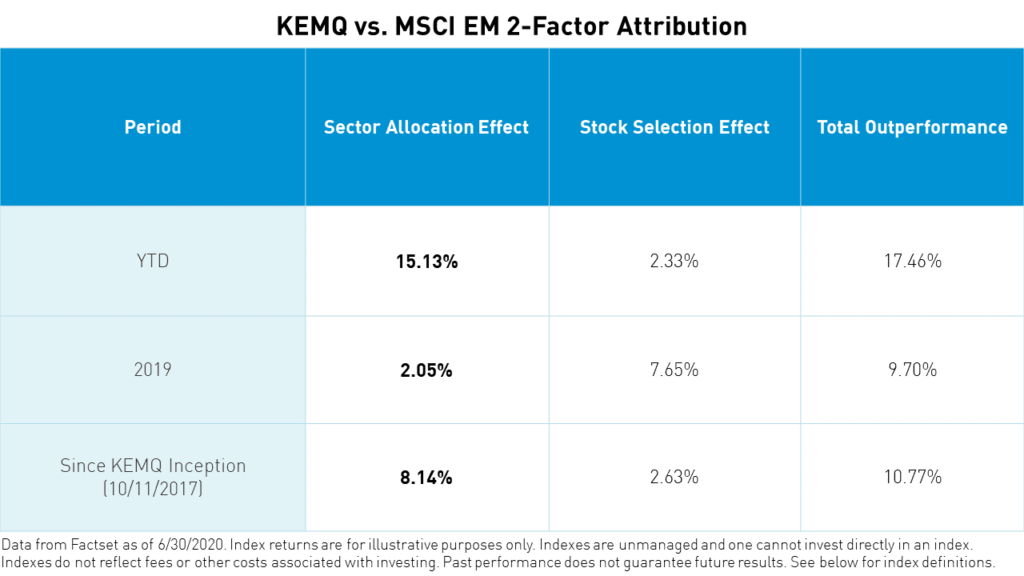
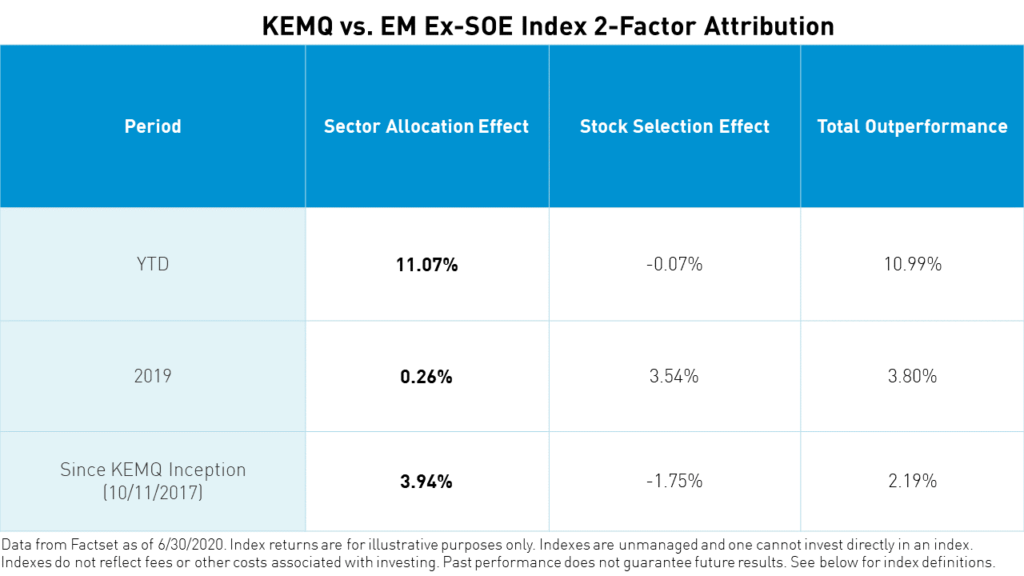
Based on our analysis, the year-to-date outperformance of the KEMQ ETF versus both Ex-SOE and broad EM benchmarks can be mostly attributed to sector selection. Year-to-date, KEMQ outperformed the Ex-SOE index by a total of 9.89%, of which 9.85% was due to sector selection. Similarly, over the same period, KEMQ outperformed MSCI EM by 14.86%, of which 12.75% was due to sector selection.
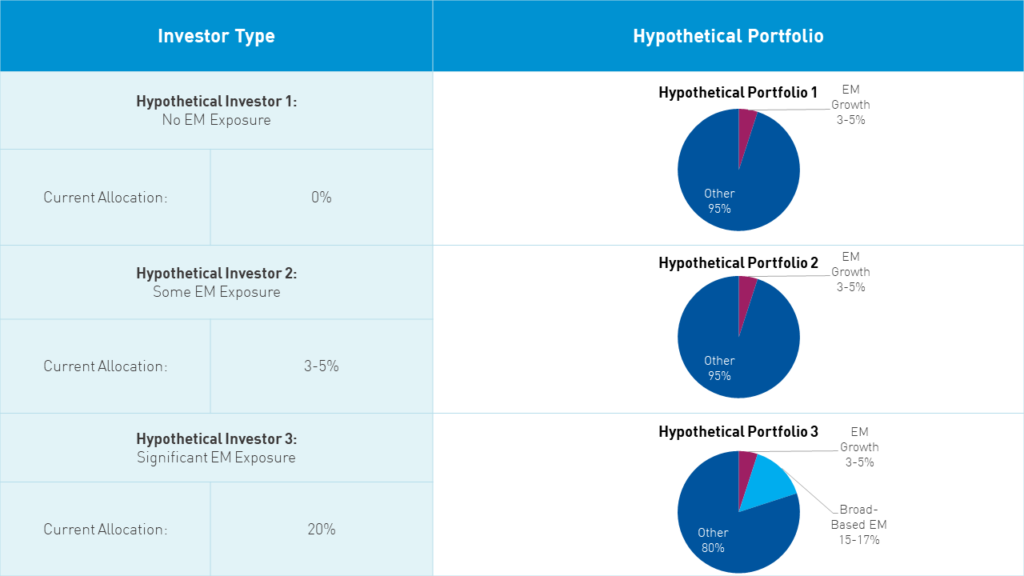
Now that we have demonstrated the potential benefits of a growth-oriented strategy to Emerging Markets, many investors who are accustomed to investing in broad-based EM might be unsure how to implement such an approach. We find that investors tend to fall into one of three camps, those who avoid EM, those who have little exposure, and those who have significant exposure. We created a chart below that shows hypothetical portfolio weightings of EM growth and broad-based EM based on the current portfolios of these three types of investors.
Over the past decade, we believe broad EM has failed to provide an adequate risk/return tradeoff. As investors are beginning to reconsider EM investments, it may not make sense to continue taking the same approach that has been a pain point for so long. Instead, we believe investors may wish to consider a larger allocation to emerging market growth sectors. The KraneShares Emerging Markets Consumer Technology ETF (ticker: KEMQ) could be an attractive source of growth for Emerging Market investors into the future.
Citations
1. Data from Bloomberg as of June 30, 2020.
Index Definitions
MSCI Emerging Markets (EM) Index: The MSCI Emerging Markets Index is a free-float weighted equity index that captures large and mid cap representation across Emerging Market (EM) countries. The index covers approximately 85% of the free-float adjusted market capitalization in each country. The index was launched on January 1, 2001.
Emerging Markets Ex-SOE Index: The Wisdom Tree Emerging Markets ex State Owned Enterprises Index is comprised of emerging market stocks that are not state owned enterprises. The index had a base value of 200 on August 2014. The index was launched on August 18, 2014.
Morningstar Active EM Category (Morningstar Diversified Emerging Markets Universe): This is an index composed of funds and their constituents that have been identified by Morningstar as falling under the category of "Diversified emerging-markets portfolios." Diversified emerging-markets portfolios tend to divide their assets among 20 or more nations, although they tend to focus on the emerging markets of Asia and Latin America rather than on those of the Middle East, Africa, or Europe. These portfolios invest at least 70% of total assets in equities and invest at least 50% of stock assets in emerging markets.
The Solactive Emerging Markets Consumer Technology Index (KEMQ's Index): The Solactive Emerging Markets Consumer Technology Index selects companies from 26 eligible countries within emerging markets whose primary business or businesses are internet retail, internet software/services, purchase, payment processing, or software for internet and E-Commerce transactions.
MSCI World Index: The MSCI World Index is a free-float weighted equity index. It was developed with a base value of 100 as of December 31, 1969. The index includes developed world markets and does not include emerging markets.
Terms
Emerging Markets Consumer/Technology: Prior to the GICS reclassification in October 2018, this is defined as 28% MSCI Emerging Markets Information Technology Index, 10% the MSCI Emerging Markets Consumer Discretionary Index, and 5% the MSCI Emerging Markets Communication Services Index. After the reclassification, this is defined as 15% the MSCI Emerging Markets Information Technology Index, 14% the MSCI Emerging Markets Consumer Discretionary Index, and 11% the MSCI Emerging Markets Communication Services Index.