Characteristics of Great Companies
While allocation to Chinese internet stocks has expanded recently, investors may not be as familiar with these companies as they are with their U.S. equivalents.

The recent inclusion of U.S. listed Chinese internet and technology companies into MSCI's indexes has increased investor exposure to this market. While allocation to Chinese internet stocks has expanded, investors may not be as familiar with them as they are with their U.S. equivalents. We believe that upon closer examination, investors will find that the U.S. and Chinese internet sectors have a lot in common.
One key similarity between the top U.S. and Chinese internet companies is that they are typically led by iconic founders who maintain a great deal of influence in terms of shares and voting power. We believe this is important because it shows the founders’ continued belief in their products even after attaining great wealth and success. Just recently at the annual Chinese Economic Summit in Beijing, Facebook founder, Mark Zuckerberg, sat down with Alibaba founder, Jack Ma, to discuss their excitement over cutting-edge virtual reality technologies each is preparing to bring to market.
U.S. and Chinese Tech Company Founders Still Exert Huge Influence After Taking Companies Public
| Company | Founder | Current Role | % Voting Power1 | Shares Held (mm) |
| Baidu | Robin Li | CEO & Founder | 16 | 5.6 |
| Alibaba | Jack Ma | Executive Chairman & Founder | 7.8 | 194 | Tencent | Pony Ma | CEO & Founder | 9 | 846.7 |
| Netease | Ding Lei | CEO & Founder | 44.9 | 1,456 |
| Mark Zuckerberg | CEO & Founder | 53.8 | 423 | |
| Amazon | Jeff Bezos | CEO & Founder | 17.6 | 82.9 |
| Netflix | Reed Hastings | CEO & Co-Founder | 2.94 | 12.8 |
| Alphabet (Google parent company) | Larry Page | CEO & Co-Founder | 26.6 | 21 |
| Alphabet (Google parent company) | Sergey Brin | President & Co-Founder | 25.9 | 20 |
|
Data gathered from SEC filings (either 10-K or 20-F) for Year Ended March, 2016
Weighting of companies in KWEB as of 5/31/2016: Baidu (8.41%), Alibaba (11.02%), Tencent (14.07%), Netease (4.68%) The Fund's Holdings Are Subject to Change. Click Here for latest full fund holdings. | ||||
Differences in Potential
Many technology companies, like the ones mentioned above, have huge user bases that drive demand for their stock. The strong investor appetite for these companies combined with non-traditional revenue streams can sometime cause valuations to soar. However unlike the U.S. tech sector, the China overseas Internet sector has not been as affected by this phenomenon.
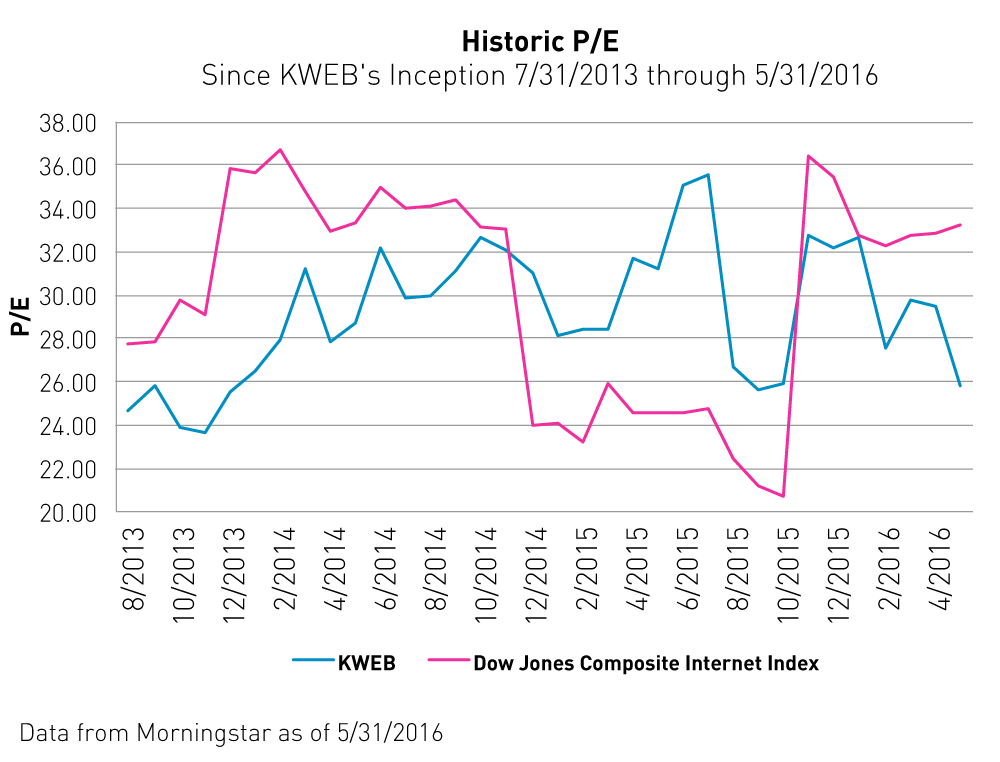
The KraneShares CSI China Internet ETF: ticker KWEB, has a Price to Earnings (P/E)2 ratio of 25.77 while the U.S. internet sector, as defined by the Dow Jones Internet Composite Index3, has a P/E of 33.22.4 One potential explanation for this disparity is that Mainland Chinese investors, the primary users of the Internet companies KWEB holds, are restricted from buying stocks listed in Hong Kong and the United States.
While P/E is a great tool for measuring whether a stock is inexpensive, it fails to take into consideration the company’s growth prospects. A company with a low P/E does not necessarily represent a good value. In order to analyze both growth and value, analysts sometimes use the P/E To Growth5 (PEG) ratio, this calculation divides a stock’s P/E by its earnings per share growth (EPS)6. A stock with a lower PEG ratio may potentially have greater growth prospects and could represent a good value. KWEB has a PEG of 1.04.7 In contrast, the average PEG of the Dow Jones Internet Composite Index is currently 2.18.8 Based on the PEG ratio, Chinese internet companies may have greater growth potential than U.S. Internet companies.
As shown, KWEB's current P/E is at the low end of its historical range and currently much lower than the P/E of the Dow Jones Internet Composite Index.9
Government Catalysts
In addition to their management's ingenuity, the KWEB companies have also benefitted from current macro trends and government policies. As China shifts from a manufacturing focused economy to one focused on domestic consumption, the services sector is emerging as a key beneficiary.
By the end of Q1 2016, retail sales increased 10% and online retail sales followed suit with a significant 28% increase.10 We believe this trend will continue because by the end of 2015, only around half of China's population was connected to the internet, leaving room for more adoption.11
China's government is also actively promoting growth in its internet and eCommerce sector through initiatives such as the Internet Plus policy and Value Added Tax (VAT) reform. Internet Plus looks to integrate technology into China's other economic sectors while VAT reform aims to decrease tax rates and lower operating costs.12, 13
Three key points emerge from the analysis above. First, Chinese internet companies, like their American counterparts, are commonly led by innovative founders who have a large stake in the business and its future success. Second, these companies are currently exhibiting attractive valuations and trading at a historic low P/E. Last, favorable government regulation and increases in domestic consumption may continue to spur growth in the eCommerce sector.
More Change to Come
As mentioned, MSCI already included the U.S. listed Chinese stocks into their indexes. While this event significantly expanded the sector’s shareholder base, it pales in comparison to the upcoming June 14 decision around the timeline for including China's onshore stocks (A shares) into MSCI's international indexes.14
We will be conducting a live webinar on Wednesday, June 15th from 11:00am to 12:00pm EST where we will review the results of MSCI’s announcement and discuss its impact on the Mainland Chinese markets. Click here to subscribe to the webinar.
- All companies issue Class A and Class B stocks. Owners hold majority Class B stocks, which have ten times the voting power as Class A.
- Price to Earnings ratio is a valuation ratio of a company’s current share price compared to its per-share earnings. It is calculated as: Market Value per Share / Earnings per Share (EPS).
- The Dow Jones Internet Composite Index tracks the largest and most actively traded stocks in the U.S. Internet industry.
- Data from Morningstar as of May 31, 2016
- The price/earnings to growth ratio (PEG ratio) is a stock's price-to-earnings ratio divided by the growth rate of its earnings for a specified time period.
- Earnings per share (EPS) is the portion of a company's profit allocated to each outstanding share of common stock. Earnings per share serves as an indicator of a company's profitability.
- Data calculated by KFA from Morningstar as of May 31, 2016.
- Data calculated by KFA from Morningstar as of May 31, 2016.
- Data from graph taken from Morningstar as of May 31, 2016
- Data from the National Bureau of Statistics of China released on April 15, 2016
- Date from China Internet Network Information Center as of December 31, 2015
- Information on Internet Plus from The State Council of the People's Republic of China
- Information on VAT reform from The State Council of the People's Republic of China
- Information on A share inclusion from MSCI