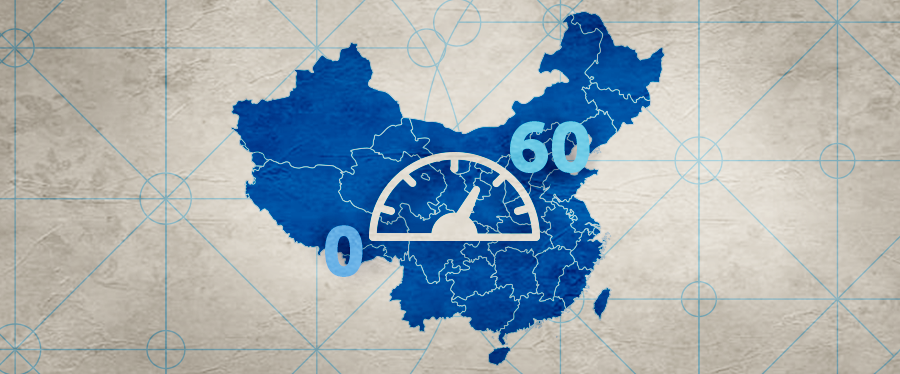
Zero to Sixty: The Rise of China In Global Indexes
By Brendan Ahern, Chief Investment Officer at KraneShares
Five years ago on a cold winter day in Beijing, KraneShares’ founder Jonathan Krane and I had a meeting at the offices of China’s top financial regulator, the China Securities Regulatory Commission (CSRC) that would prove to be one of the highlights of my 17 years working in the ETF industry. During the meeting we introduced the idea of listing an exchange traded fund in New York comprised of stocks listed on the Shanghai and Shenzhen Stock Exchanges (A-shares). The CSRC was amazingly receptive to the idea and even recommended a local asset management partner to help get the fund launched. As we exited the nondescript government building in the heart of Beijing, a university class on a field trip passed us by. I could tell they were looking at us and thinking “those two Americans mean business.”
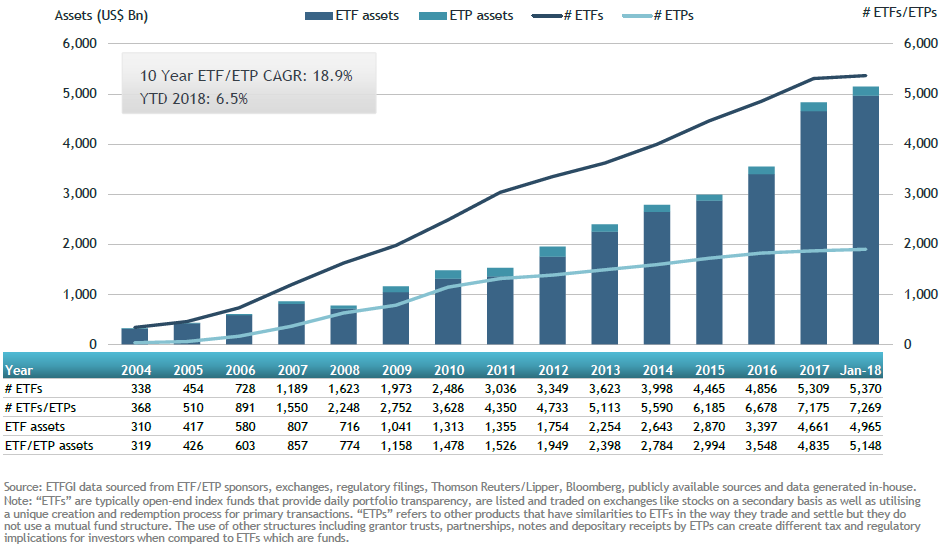
The first time I met Jonathan Krane, we discussed how great of an opportunity it would be for US investors to own an MSCI-linked China A-share ETF ahead of the inclusion into MSCI’s indexes. As an early employee at one of the largest global ETF providers, I saw the growth of the ETF industry firsthand and came to recognize the corresponding influence index providers, like MSCI, and their index methodologies have on the markets. Today, this influence has grown even stronger as global ETF assets have doubled since 2013 when we founded KraneShares. By January 2018, global assets benchmarked to exchange traded funds and products exceeded $5 trillion1.
MSCI is the largest index provider to the global ETF industry in terms of number of products tracking their indexes2. MSCI influences the way $12.4 trillion in both active and passive assets are invested globally through their Global Investable Markets Index Methodology3. While the inclusion of China A-shares into MSCI’s Global Standard Indexes may trigger one of the largest asset rebalances in recent history, the details around the inclusion are relegated to Appendix Seventeen on page 161 of the document.
While the inclusion has received a fair amount of media coverage, its potential impact has been relatively understated because few have taken the time to understand the entire process. Most reports focus on the first stage of inclusion, which will be relatively small, and not the entire process. We believe that when you have the second largest equity market in the world added by the world's largest index provider there is bound to be a big impact.
Understanding the Imbalance
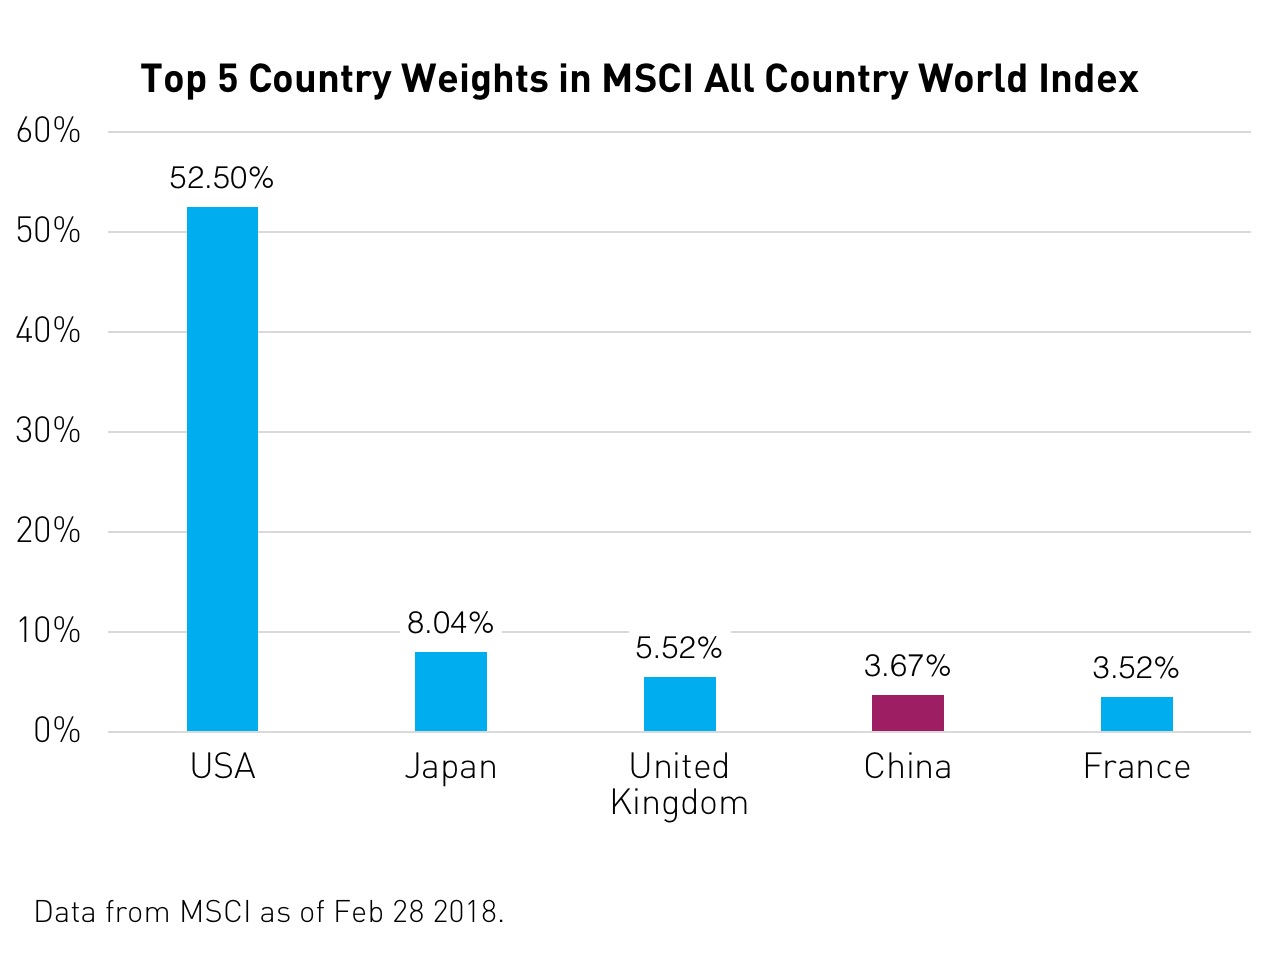
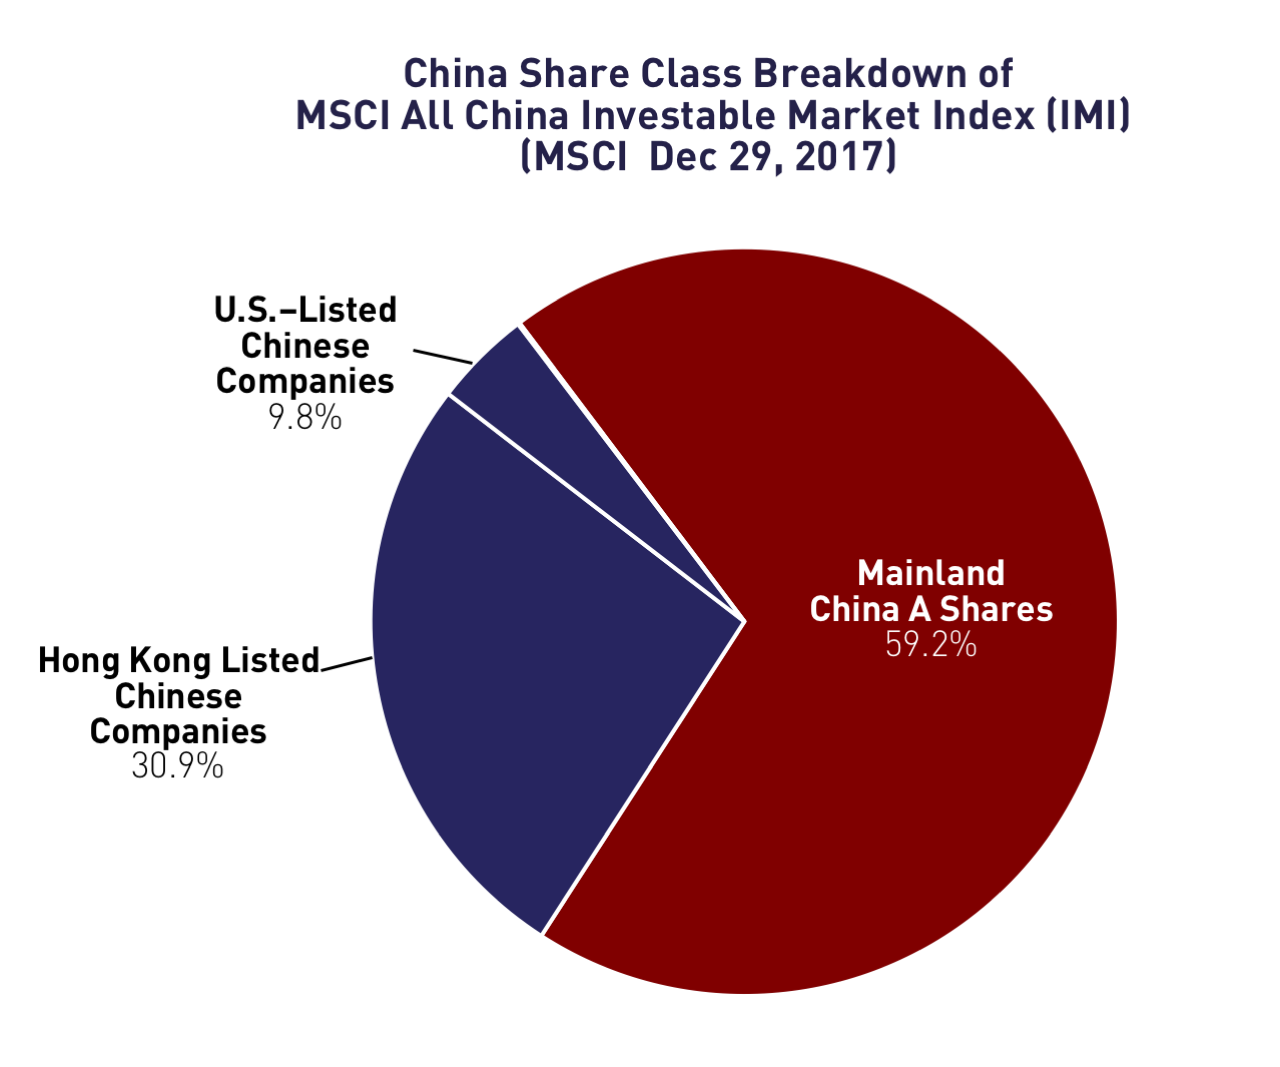
One of the most important benchmarks for institutional investors around the world is MCSI’s All Country World Index (ACWI). The United States is the largest economy in the world by GDP so it is not surprising that it comprises the largest weight at 52% of ACWI4. What weight does China, the second largest economy in the world by GDP, comprise? A mere 3.67%4. China has only half the weight of Japan despite the fact that its economy is twice as large. Compared to China, the United Kingdom has a larger weight and France nearly the same weight in ACWI, even though China’s GDP is twice as large as both countries combined. While this imbalance may leave investors scratching their heads there is a logical reason behind it. The historical definition of China for active and passive investors has been a mere 150 Chinese companies listed in Hong Kong out of a universe of several thousand companies. Only in 2016 were US listed Chinese companies added to MSCI indexes. This means stocks listed on the Shanghai and Shenzhen stock exchanges, the 4th and 8th largest in the world5, and the bulk of China's equity universe, have largely been left out of global fund benchmarks.
A Brief History of the Opening of China’s Mainland Market
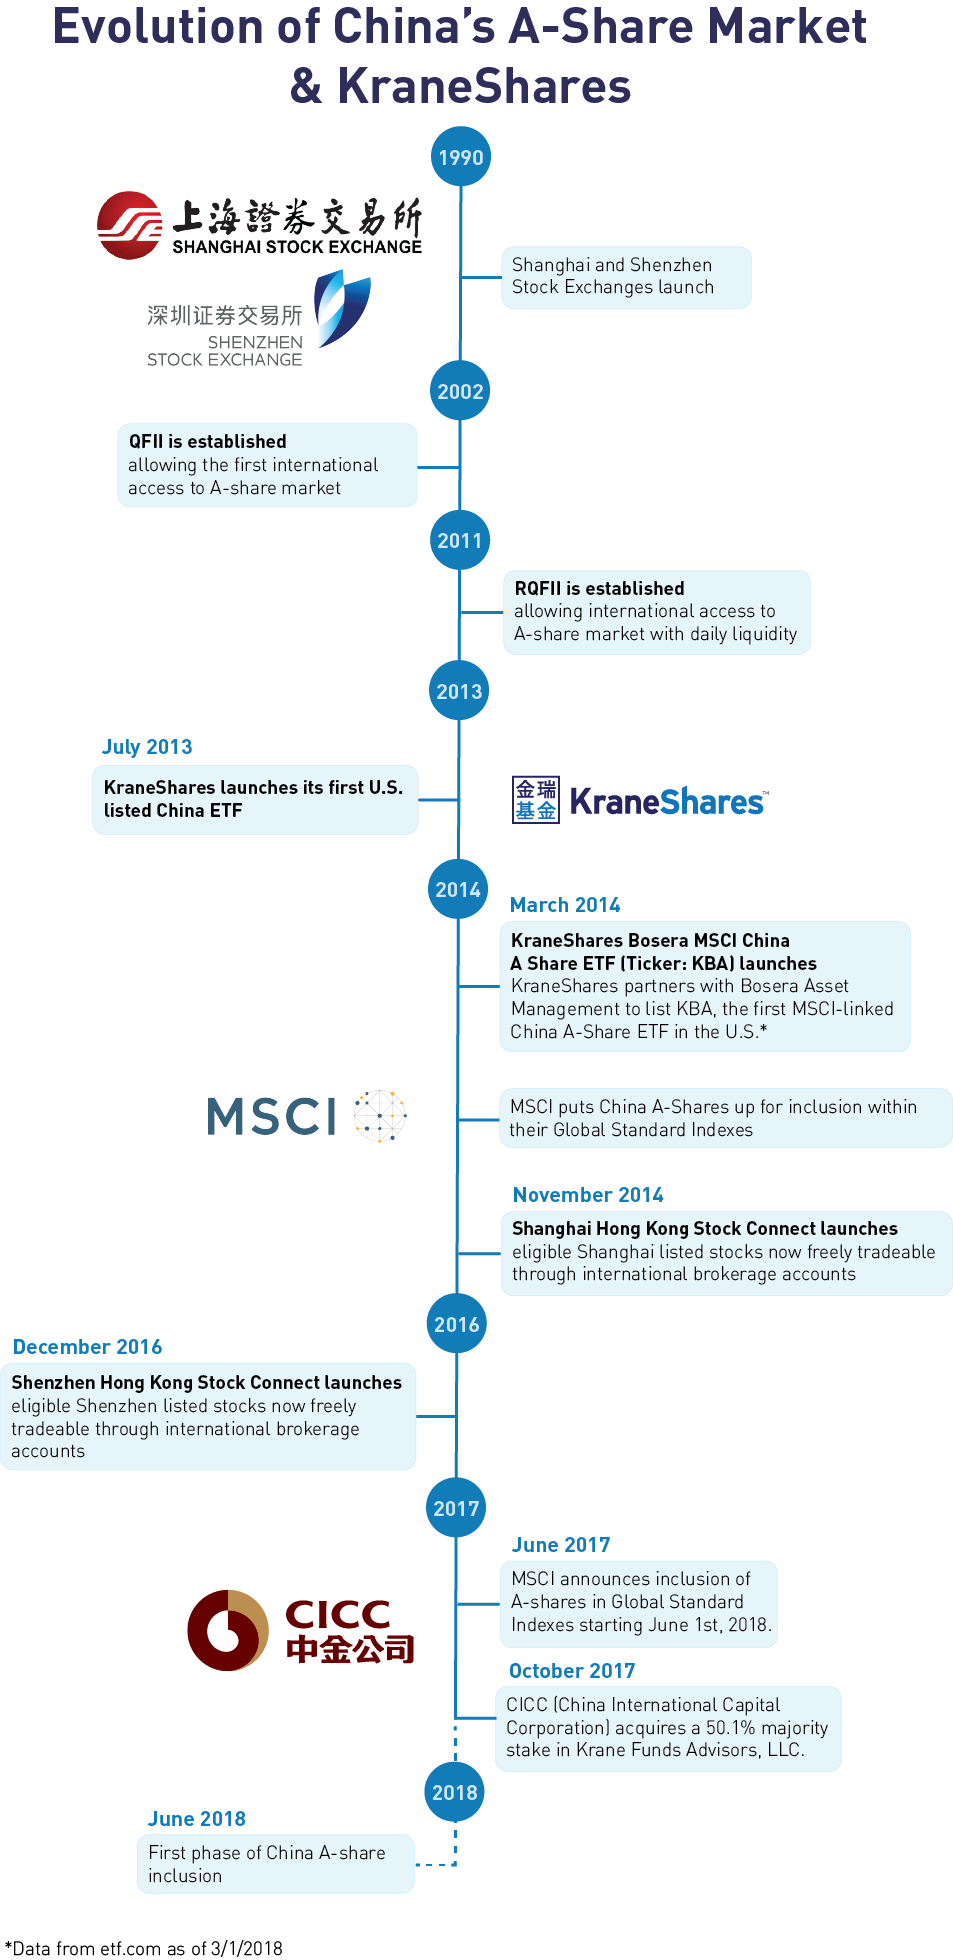
The Shanghai and Shenzhen exchanges were launched in 1990. They were totally closed off to investors outside of China until 2002 when the Qualified Foreign Institutional Investor (QFII) quota program was launched. QFII was established for long term investors, with limited ability to repatriate investments back into US dollars. As we have often witnessed, China implements such policies in an incremental fashion allowing for a period of observation to monitor a reform’s impact before opening further.
A decade after QFII was launched, in 2011, a new quota access program called Renminbi QFII (RQFII) was established that allowed for daily repatriation, (daily ability to convert an investment back into US dollars). Initially, RQFII was only given to Chinese asset managers listing RQFII ETFs in Hong Kong. This was the first time asset managers had the ability to list international ETFs giving exposure to Shanghai and Shenzhen securities. On March 4, 2014, our firm listed the KraneShares Bosera MSCI China A-Share ETF (Ticker: KBA) by utilizing RQFII, obtained thanks to our meeting with the CSRC and subsequent partnership with Bosera Asset Management, the investment arm of China Merchants Bank. That same year, MSCI put the Shanghai and Shenzhen-listed stocks that we hold in KBA up for inclusion within their Global Standard Indexes for the first time. MSCI declined to add Mainland stocks that year due to liquidity concerns from the QFII program which was still the dominant mode of access at the time.
In November 2014, a new access program was launched called Shanghai Hong Kong Stock Connect. It gave investors the ability to buy and sell Shanghai listed stocks without prior approval from China’s regulatory bodies through opening an institutional brokerage account in Hong Kong. MSCI in 2015 and 2016 declined to include Mainland stocks due to the lack of Connect access to Shenzhen stocks. The Shenzhen Hong Kong Stock Connect launched in December 2016. On June 20, 2017 MSCI announced they would include A-shares in their Global Standard Indexes starting June 1st 2018.
China’s Path to 60%
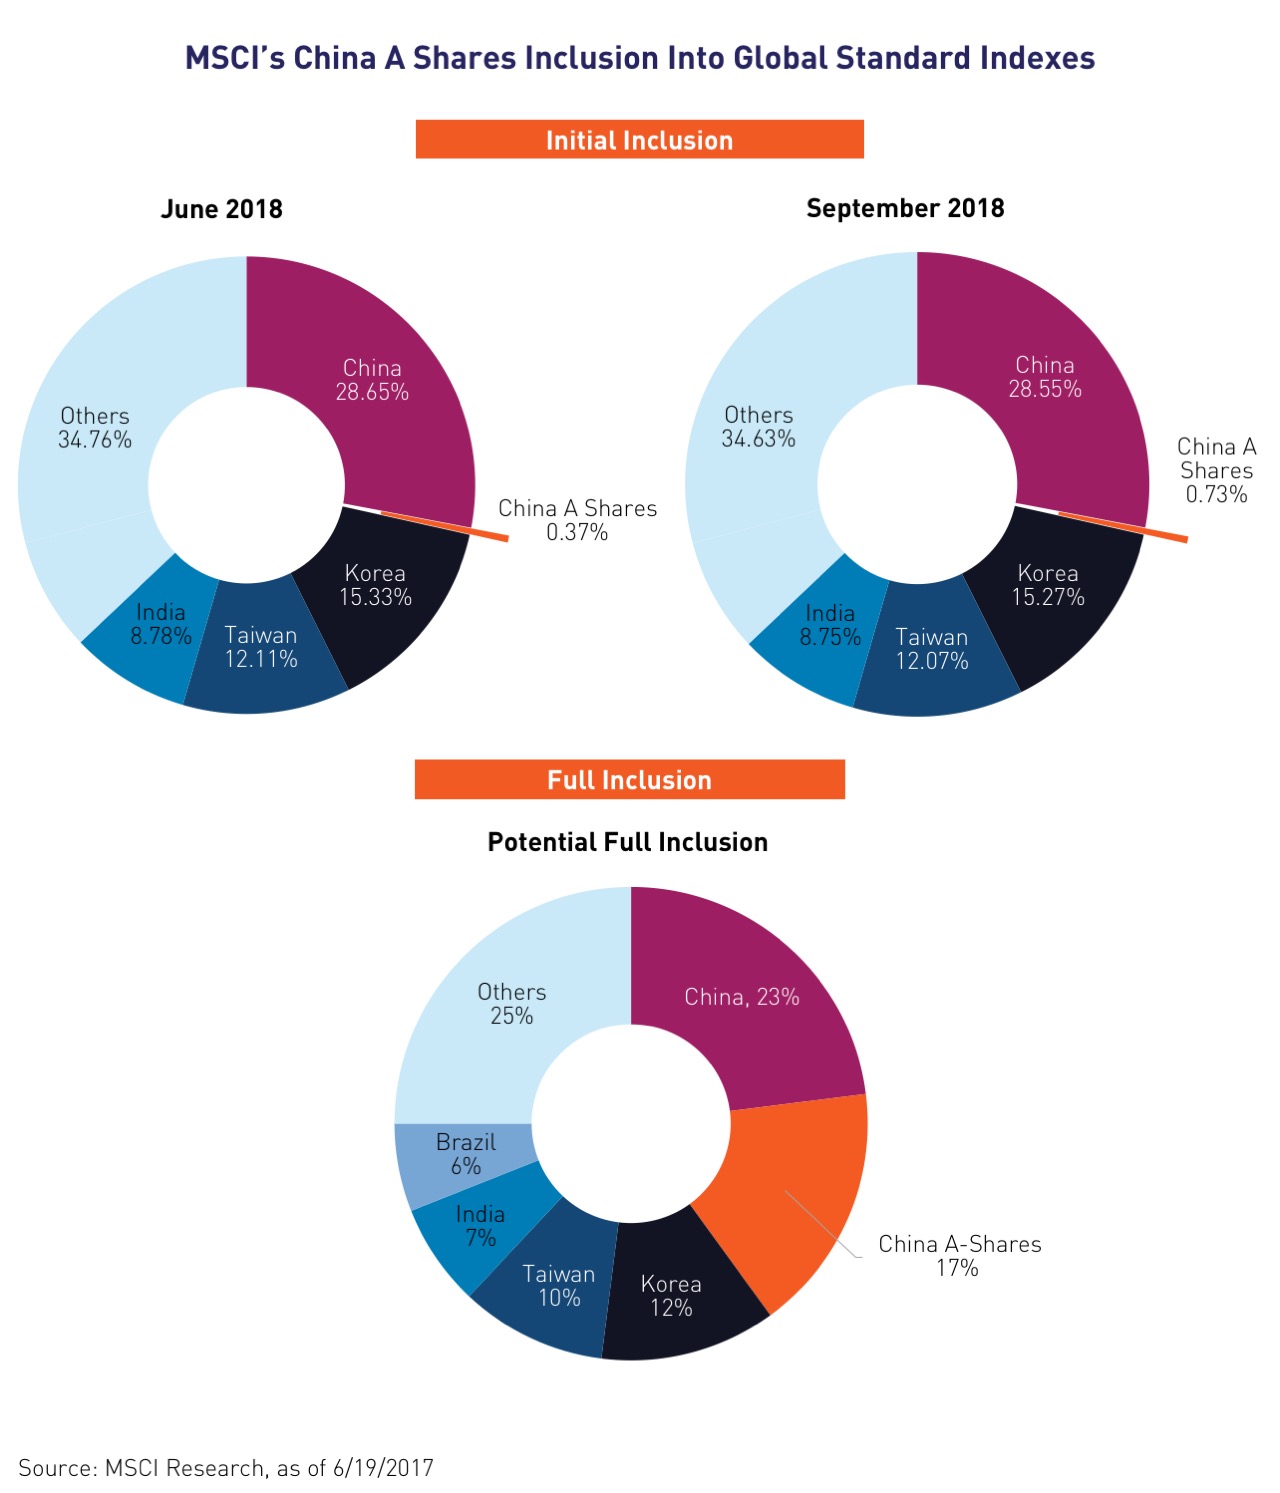
Due to the large market capitalization of the inclusion stocks, MSCI announced they will begin with two partial inclusions totaling 1% on June 1st and September 1st of 2018, followed by subsequent inclusions in the coming years. Since their initial announcement of the A-Shares inclusion, MSCI has not yet published the exact schedule or revised weight for full inclusion, although, they have projected a final weight of 17% occurring in several phases over the next three to five years in previous statements6. The full inclusion of the stocks within KBA may add 17% more exposure to China within the MSCI Emerging Market Index in addition to its current weight of 30%7. We believe this could cause China’s weight to grow to 40% of the MSCI Emerging Markets Index over multiple inclusions spanning the next three to five years.
Changes to MSCI’s Global Standard Index definitions can have a dramatic impact on the affected markets due to fund flows from asset managers that benchmark to MSCI indexes. Over the course of the year between announcement to inclusion (6/01/2013 – 6/01/2014), the MSCI UAE and MSCI Qatar indexes rose 85.6% and 49.1% respectively8. After the Pakistan inclusion was announced in June 2016, the MSCI Pakistan index rose 32.28% during the period between announcement and inclusion (6/01/2016 – 6/01/2017)8.
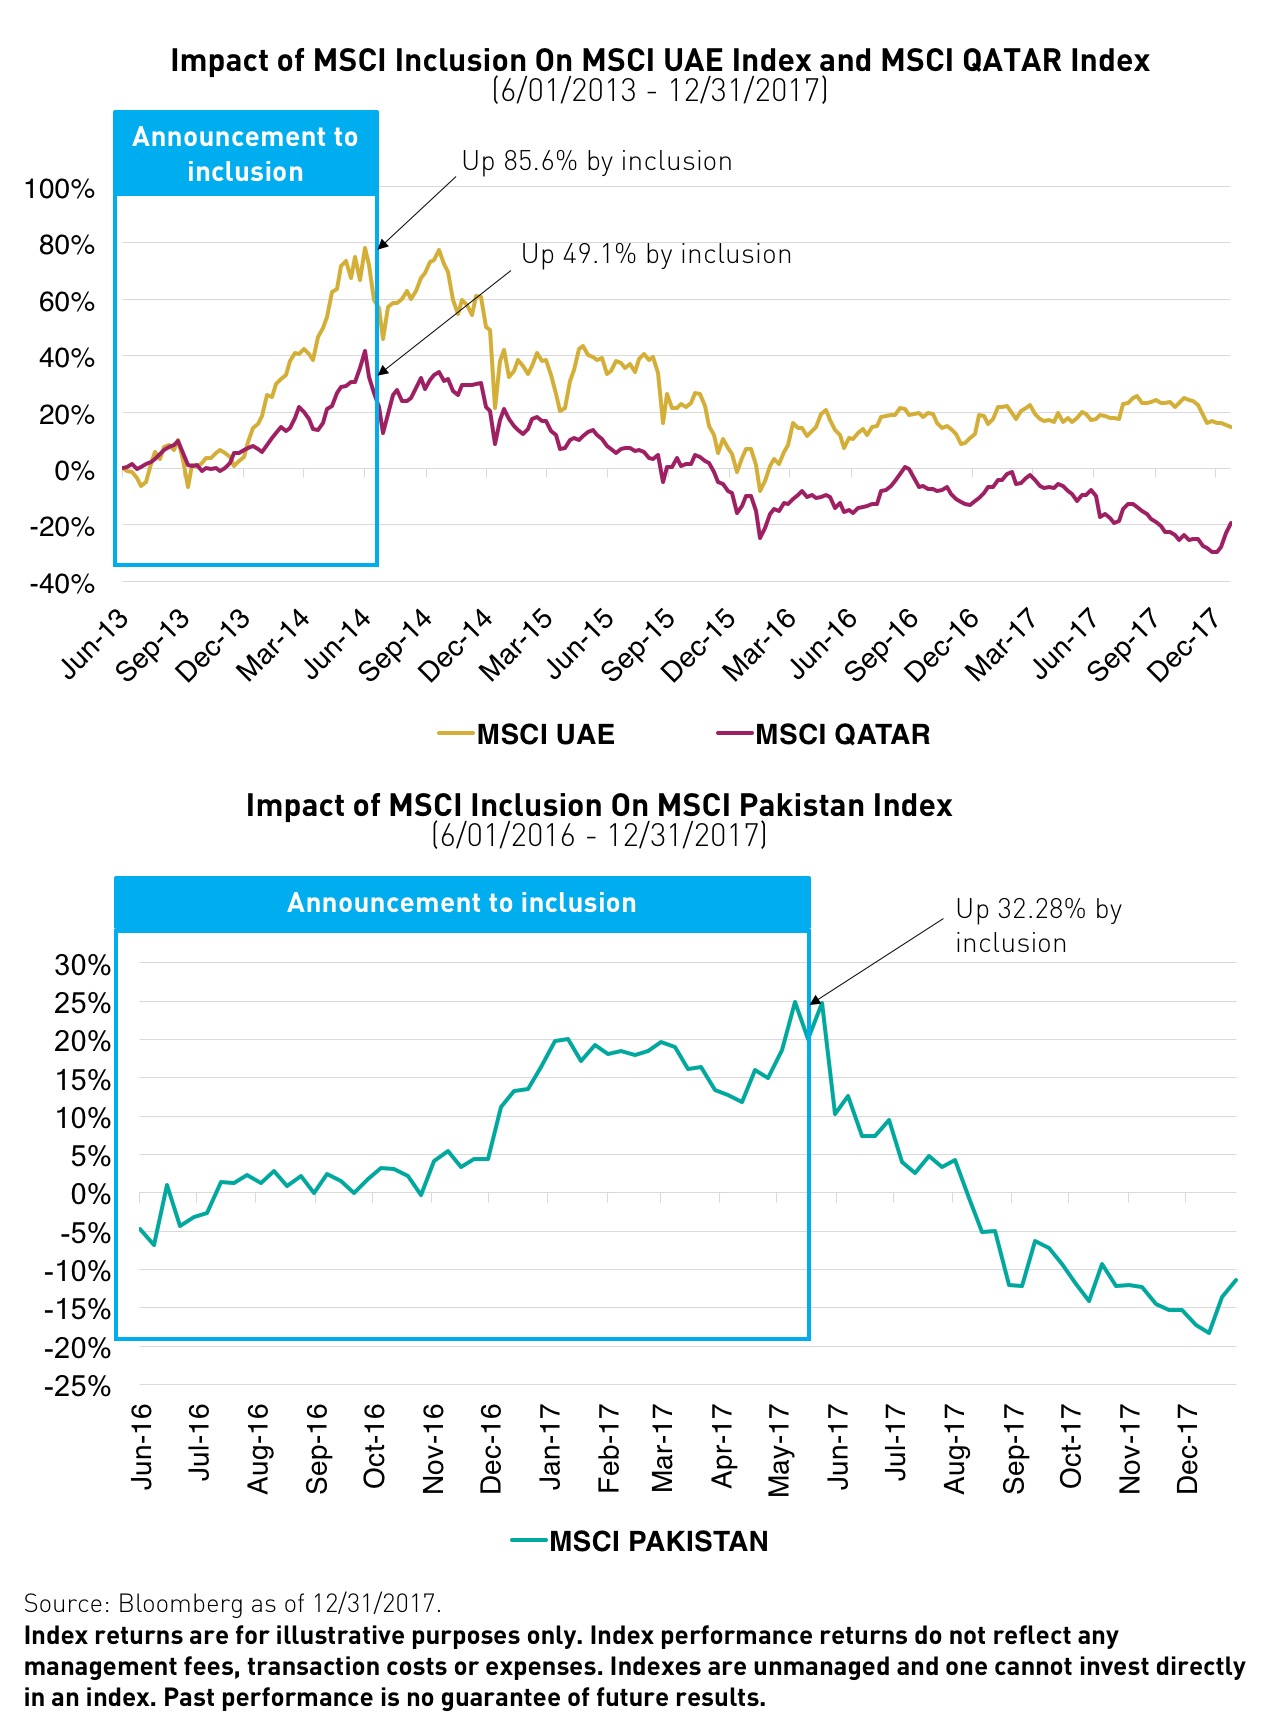
Relatively speaking, these inclusions were small and occurred in their entirety in a single rebalance. UAE, Qatar, and Pakistan currently only comprise 0.59%, 0.51%, and 0.08% of the MSCI Emerging Markets Index respectively9. We estimate it may take MSCI upward of 10 rebalances to include the entire A-share segment. KBA is benchmarked to the MSCI China A Inclusion Index, which is designed to track the progressive partial inclusion of A shares in the MSCI Emerging Markets Index over time.
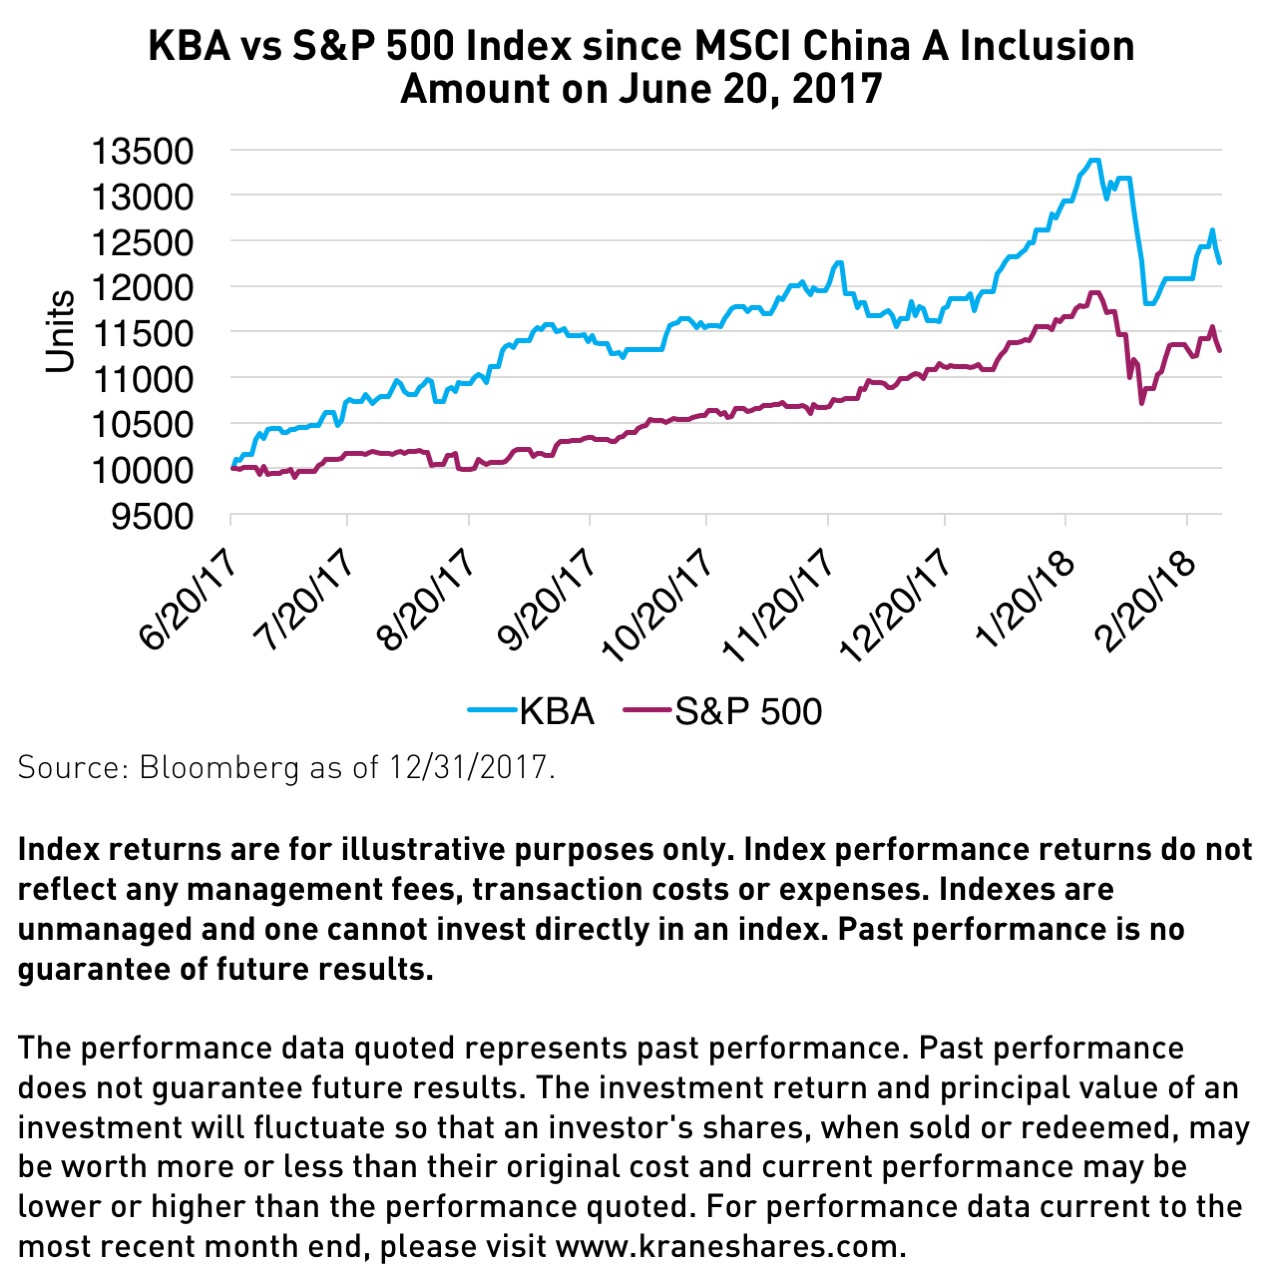
Prior to the first phase of inclusion scheduled for June 1st, the affected segment of China A-Share stocks have followed a similar trend. From 6/20/2017 to 2/28/2018, KBA has returned 22.57% outperforming the S&P 500 by 9.71%.10
View KBA standard performance and performance as of most recent month end
Beyond A-share inclusion, there are two potential changes to MSCI’s indexes on the horizon that could also increase China’s weight in their Global Standard Indexes even further. MCSI’s primary criterion for determining which countries are developed and which are emerging is GDP per capita. Both South Korea and Taiwan meet MSCI’s GDP criteria but have yet to be reclassified as developed markets. If either one were to be upgraded, the resulting redistribution could raise China’s weight in emerging markets to over 50%11. The upgrade of both countries could raise China to over 60% of the MSCI Emerging Markets Index11. We believe both countries have the potential to be upgraded to developed market status in the next five to ten years. Some investors are skeptical MSCI would allow China to hold such a large weight in their Emerging Markets Index. However, there is precedent to support it. In 1980, Japan went from 30% of the MSCI developed market index (EAFE)to nearly 60% by the end of the decade12. MSCI does not institute country caps. In theory, China could also see a similar dramatic rise to 60% of the Emerging Markets Index over the next decade.
For many of my fellow index enthusiasts in the ETF industry, the prospect of the inclusion of China A-shares into MSCI’s indexes has grown to occupy a historic sense of significance for global markets. The second largest equity market in the world is entering one of the largest indexes in the world for the first time. Hundreds of billions of dollars could be rebalanced in the coming years. Five years ago, mere rumors this was coming were enough for me to drop everything and help found a China-focused ETF company that could deliver this opportunity to global investors. Today, I am proud to say the fund we started, the KraneShares Bosera MSCI China A Share ETF (Ticker: KBA) has the longest track record and is the largest MSCI linked China A-share ETF in the United States13. KBA is also the only US ETF to track the MSCI China A Inclusion Index, designed to track the exact securities MSCI will add to its indexes across multiple phases of inclusion as they take place over the coming years.14
Our most important value add over the next decade will be helping investors make an educated decision based on our distinct insights into China’s economy and capital markets. We welcome the opportunity to further discuss China’s rise from zero to sixty. We will be holding an eight city China A-Share Inclusion Roadshow to discuss the inclusion with investors beginning in late April and early May. Click here to register.
This article is intended for educational purposes only and should not be construed as investment advice. All opinions or views expressed in this article are current only as of the date of this article and are subject to change without notice.
Past performance does not guarantee future results. The Fund's holdings are subject to change.
- The MSCI Emerging Markets Index: captures large and mid cap representation across 23 Emerging Markets (EM) countries. With 834 constituents, the index covers approximately 85% of the free float-adjusted market capitalization in each country.
- The MSCI China A International Index: is a free-float adjusted market capitalization weighted index that is designed to track the equity market performance of large-cap and mid-cap Chinese securities listed on the Shanghai and Shenzhen Stock Exchanges. The Index is based on the concept of the integrated MSCI China equity universe with mainland Chinese securities included.
- MSCI ACWI Index: captures large and mid cap representation across 23 Developed Markets (DM) and 23 Emerging Markets (EM) countries*. With 2,481 constituents, the index covers approximately 85% of the global investable equity opportunity set.
- The MSCI EAFE Index: is an equity index which captures large and mid cap representation across Developed Markets countries around the world, excluding the US and Canada. With 930 constituents, the index covers approximately 85% of the free float-adjusted market capitalization in each country.
- The MSCI United Arab Emirates (UAE) Index: designed to measure the performance of the large and mid cap segments of the UAE market. With 10 constituents, the index covers approximately 85% of the UAE equity universe.
- The MSCI Qatar Index: designed to measure the performance of the large and mid cap segments of the Qatari market. With 12 constituents, the index covers approximately 85% of the free float-adjusted market capitalization in Qatar.
- The MSCI Pakistan Index: designed to measure the performance of the large and mid cap segments of the Pakistan market. With 16 constituents, the index covers approximately 85% of the Pakistan equity universe.
- The MSCI China A Inclusion Index is designed to track the progressive partial inclusion of A shares in the MSCI Emerging Markets Index over time. The index is designed for global investors accessing the A shares market using the Stock Connect framework and is calculated using China A Stock Connect listings based on the offshore RMB exchange rate (CNH).
- Index Definitions
- Data from ETFGI as of Jan 2018. Retrieved on Feb 9 2018.
- Data from MSCI As of Mar, 2017; defined as each share class of an exchange traded fund, as identified by a separate Bloomberg ticker. Only primary listings, and not cross-listings, are counted
- Data reported by CBOE, DGX, Eurex, ICE Futures Europe, ICE Futures US, JSE, SGX as of September 30, 2017.
- Data from MSCI ACWI as of Dec 31 2017.
- Data from The World Federation of Exchanges as of Jan 31 2018.
- MSCI Research, as of 9/30/2016
- Data from MSCI EM Index, as of Feb 28 2018.
- Data from Bloomberg as of Dec 31 2018.
- Data from MSCI EM Index, as of Mar 12 2018.
- Data from Bloomberg as of Feb 28 2018.
- Data from MSCI EM Index as of Feb 28 2018.
- Data from MSCI EAFE. Retrieved on Mar 13 2018.
- Data from MSCI as of 2/28/2018.
- Data from etf.com as of 3/1/2018.
The KraneShares ETFs are distributed by SEI Investments Distribution Company (SIDCO), 1 Freedom Valley Drive, Oaks, PA 19456, which is not affiliated with Krane Funds Advisors, LLC, the Investment Adviser for the Fund. Additional information about SIDCO is available on FINRA’s BrokerCheck.