Where to invest nearly $1 trillion a year?
Why we believe Mainland Chinese equities may be poised to rally

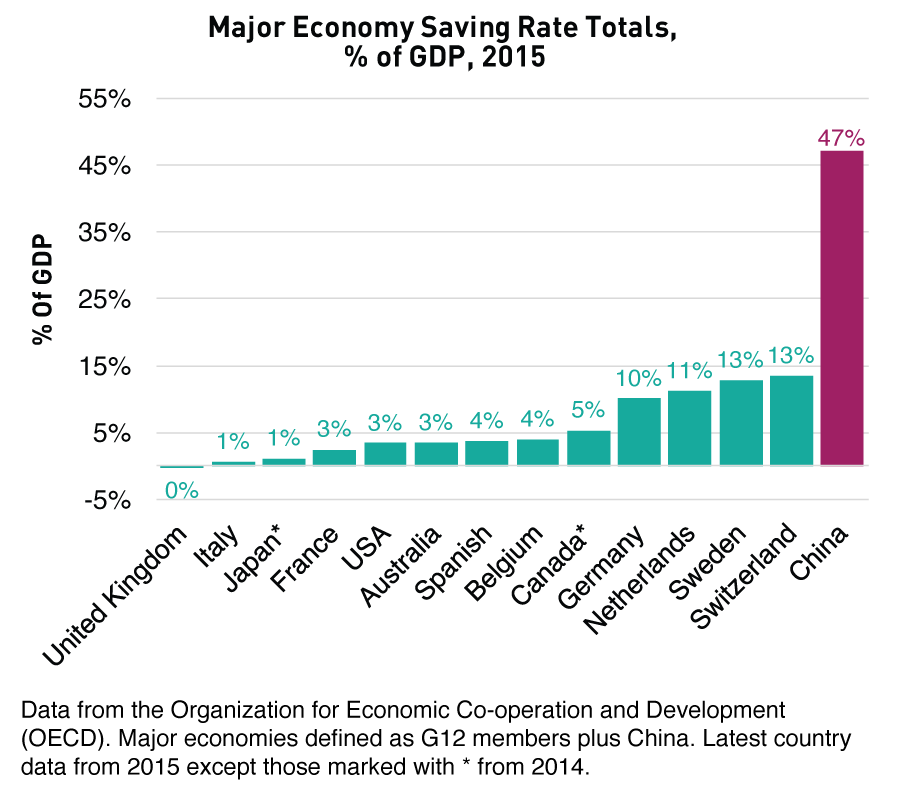
With an average household savings rate as percentage of GDP over fifteen times higher than that of the United States, Chinese families have trillions of dollars in the bank1. Any change in the way Chinese people allocate their savings can have a dramatic impact on the markets. We believe there is a shift currently underway from traditional savings options to China’s Mainland equity markets (A-shares).
The average household savings rate in China dwarfs that of other nations. From 2015 to 2016, Chinese savers added $875 billion in total bank deposits. Since the year 2000, China has added an average of $1 trillion in bank deposits each year2.
Overall, China currently has $22 trillion in bank deposits versus $13 trillion in the United States2. The Organization for Economic Co-operation and Development (OECD) reported that, as a percentage of GDP, China’s 2015 savings rate was 47.1% compared to 3.4% in the United States and similar rates across Europe1.
Why does China save so much?
Filial piety is a term used by Chinese scholars to describe the deep respect for parents, elders and ancestors in Chinese society. Filial piety is a major contributor to China’s record high household savings rate. The philosophy emerged during Confucian times (around 400BC) and still influences modern society as many Chinese view saving up enough money to care for their parents and elderly as a solemn duty. In 2013 China issued the “Protection of the Rights and Interests of Elderly People” law, which mandates, among other things, that companies give employees enough time off to make parental visits.
Caring for family members is also a financial necessity in China due to the minimal social safety nets enjoyed by Western societies, such as extensive social security, healthcare assistance from Medicare and Medicaid, unemployment checks, and welfare.
Where does all this money go?
In the U.S. people saving for retirement can invest through a variety of options such as Individual Retirement Accounts (IRAs), 401(k)s and defined benefit pension plans. In China, these options are still in the early stages of being adopted. Individuals in China have limited opportunities to invest outside of China. Domestic solutions include:
- Bank Deposits (often referred to as demand deposits)
- Bond market (China’s Interbank Bond Market)
- Housing (real estate for investment and/or personal use)
- Wealth Management Products (such as peer to peer lending)
- Gold
- Stock Market (stocks listed on the Shanghai & Shenzhen Stock Exchanges)
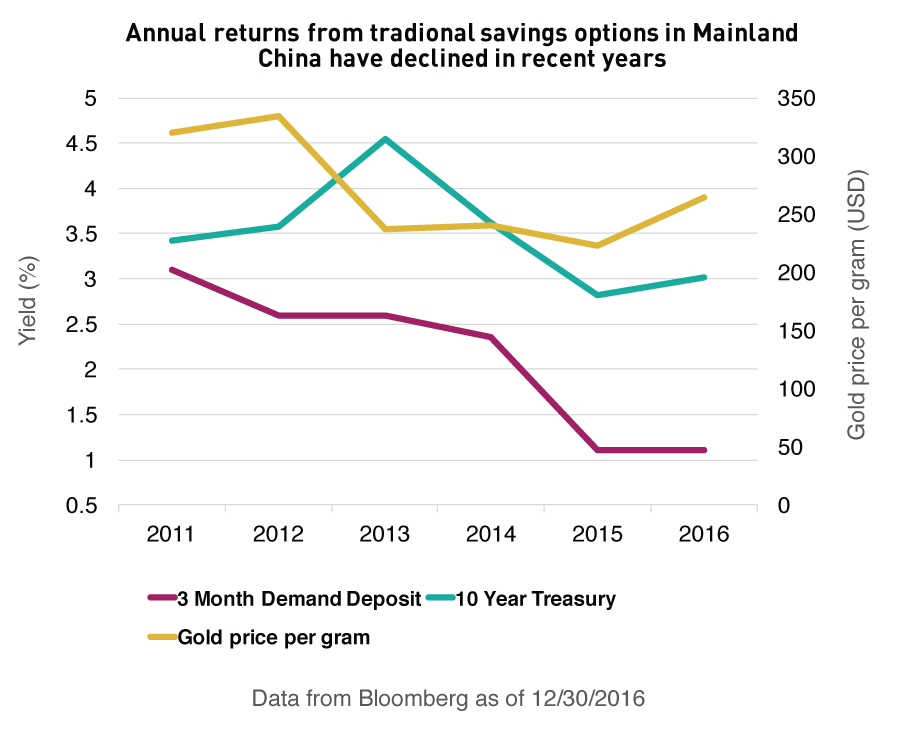
What has changed?
Amongst savers’ domestic options, bank accounts were a popular solution due to their low risk and high interest rates. While China’s interest rates still might appear high to foreign investors, China entered an easing cycle just over two years ago that brought yields down. The rates available today from savings accounts and bonds appear less compelling to domestic Chinese investors who recall more attractive returns just a few years ago.
China’s robust housing market, which posted strong gains in recent years, has begun facing increased oversight as policy makers monitor rising prices. Following December’s Central Economic Work Conference, a top economic conference in China, President Xi Jinping stated: “houses are built to be inhabited, not for speculation.3” There is also concern that further investment in real estate could create a bubble in the sector which may price out many first time homebuyers. Wealth management products have taken a hit as well because many of them provide loans to the same real estate developers now facing increased regulation.
Potential inflows to China's domestic stock market
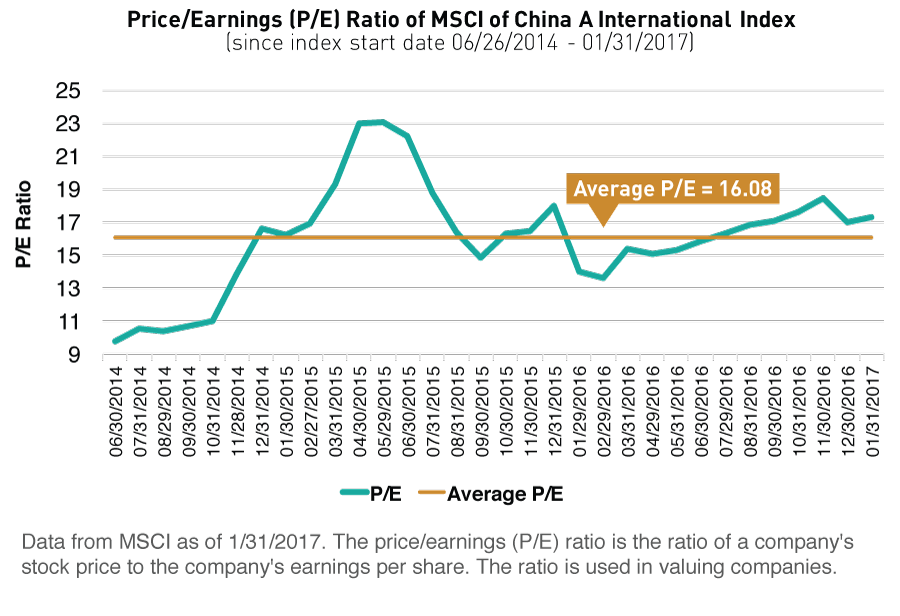
The Chinese stock market’s valuation remains relatively inexpensive compared to other markets. From the end of 2015 to the end of 2016, the price/earnings (P/E) ratio of the MSCI China A International Index, MSCI’s definition of China’s Mainland stock market, declined from 18.0 on 12/31/2015 to 17.0 on 12/30/20164. During that same period, the P/E ratio for many global markets increased.
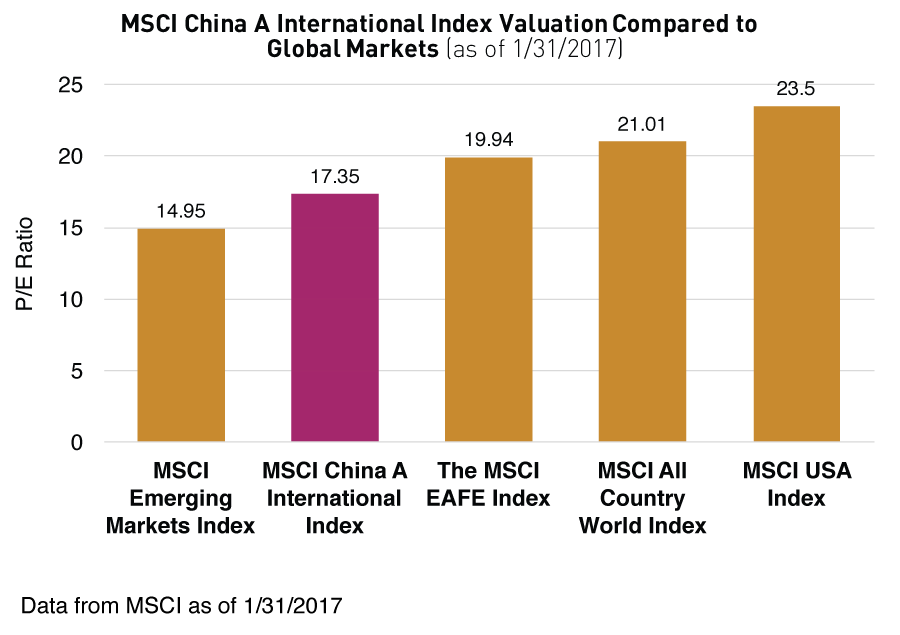
We believe a reorientation of Chinese savers to the domestic stock market could have a dramatic impact. Due to the diminished return profile of traditional saving vehicles, the stock market appears ripe for participation.
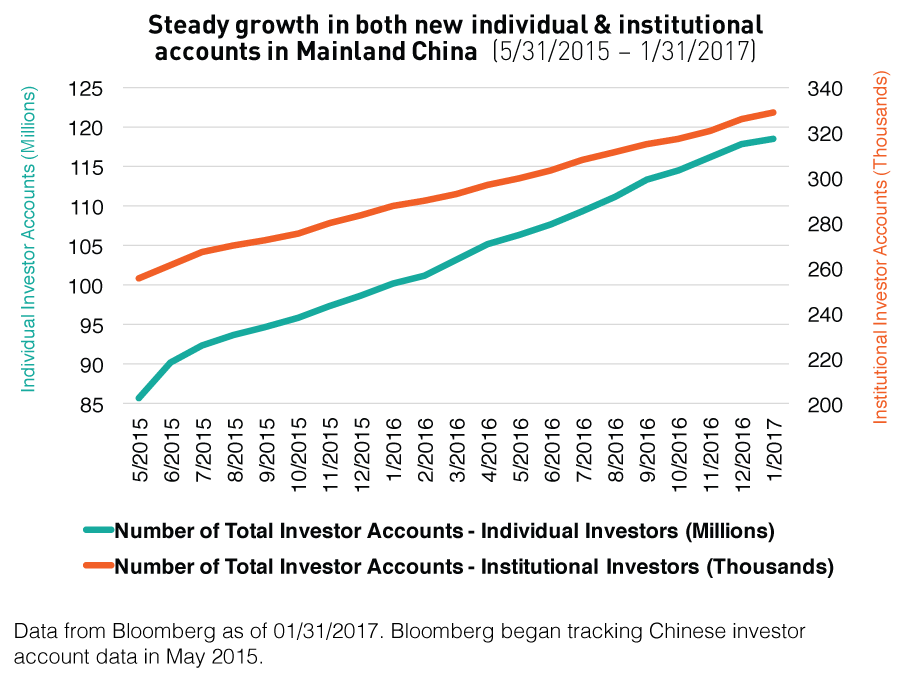
There is evidence that this shift is already occurring, as 2016 saw an increase in the number of accounts on Chinese exchanges, both from institutions and individuals.
How can international investors potentially benefit from this trend?
Because global markets are more connected than ever, this poses a challenge for investors seeking low correlating asset classes to diversify their portfolios. While many countries have a high level of foreign ownership, China’s Mainland equity market is still predominantly owned by domestic investors. The Financial Times recently estimated that foreign investors represent only 2% of the Mainland equity market5.
| ACWI | EAFE | EM | USA | China A | |
| MSCI ACWI Index (ACWI) | 1 | ||||
| MSCI EAFE Index (EAFE) | 0.98 | 1 | |||
| MSCI Emerging Markets Index (EM) | 0.90 | 0.88 | 1 | ||
| MSCI USA Index (USA) | 0.96 | 0.90 | 0.79 | 1 | |
| MSCI China A Index (China A) | 0.43 | 0.39 | 0.52 | 0.39 | 1 |
| Source: Table from Bloomberg, monthly average correlation from January 31, 2007 to January 31, 2017 | |||||
China may see an influx of international investors soon if Mainland A-shares are included into MSCI's definition of China within their Global Standard Indexes. For the last three years the global index provider has debated including the stocks tracked by the MSCI China A International Index within popular benchmarks like the MSCI All Country World (ACWI) Index and the MSCI Emerging Markets (EM) Index. The inclusion of China A shares in these indexes should have a dramatic effect. For example, the addition of these stocks should raise China’s weight within MSCI EM from 26% to over 40%. The next evaluation will be made public in June 2017. It is estimated $272 billion could flow into the stocks tracked by the MSCI China A International Index from inclusion into the MSCI EM Index alone6.
We believe that in addition to perceiving the Mainland markets as favorably priced right now, Mainland Chinese investors are also well aware of the MSCI decision and could pivot to buy the securities within the MSCI China A International Index ahead of inclusion. The potential capital infusion into the Chinese stock market—from both domestic and foreign investors—could impact the specific subset of securities held by the KraneShares Bosera MSCI China A ETF (ticker KBA).
For investors who do not break out country positions, the KraneShares FTSE Emerging Markets Plus ETF (ticker KEMP) offers exposure to the Mainland equity market within a broad emerging markets investment.
We believe that as Mainland Chinese investors look to strike the right balance between their investment options and the shifting landscape of government regulation, the Mainland A-share market could be poised to rally. Meanwhile investors outside of China may potentially benefit from allocating to this largely uncorrelated asset class category.
Index definitions:
The MSCI Emerging Markets Index captures large and mid cap representation across 23 Emerging Markets (EM) countries. With 834 constituents, the index covers approximately 85% of the free float-adjusted market capitalization in each country. (Start Date: Jan 1 2001)
The MSCI China A International Index: is a free-float adjusted market capitalization weighted index that is designed to track the equity market performance of large-cap and mid-cap Chinese securities listed on the Shanghai and Shenzhen Stock Exchanges. The Index is based on the concept of the integrated MSCI China equity universe with mainland Chinese securities included. (Start Date: June 26 2014)
The MSCI China A Index: captures large and mid cap representation across China securities listed on the Shanghai and Shenzhen exchanges. (Start Date: May 10, 2005)
MSCI ACWI Index: captures large and mid cap representation across 23 Developed Markets (DM) and 23 Emerging Markets (EM) countries*. With 2,481 constituents, the index covers approximately 85% of the global investable equity opportunity set. (Start Date: May 31, 1990)
The MSCI EAFE Index: is an equity index which captures large and mid cap representation across Developed Markets countries around the world, excluding the US and Canada. With 930 constituents, the index covers approximately 85% of the free float-adjusted market capitalization in each country (Start Date: Mar 31, 1986)
The MSCI USA Index (USD): The MSCI USA Index is designed to measure the performance of the large and mid cap segments of the US market. With 622 constituents, the index covers approximately 85% of the free float-adjusted market capitalization in the US. (Start Date: Mar 31, 1986)
- Data from The Organization for Economic Co-operation and Development (OECD) as of 12/31/2015. Retrieved 02/15/2017
- Data from Bloomberg as of 12/30/2016
- Summer Zhen, Zheng Yangpeng, "China property developers cut new home prices in compliance with government curbs designed to cool market", South China Morning Post, 02/13/2017
- Data from MSCI as of 1/31/2017
- Peter Wells, Jennifer Hughes, "Will foreign investors bite at China’s Shenzhen link?", Financial Times, 11/14/2016
- Annual data from MSCI as of 6/30/2016, as reported on 9/30/2016
The KraneShares ETFs are distributed by SEI Investments Distribution Company (SIDCO), 1 Freedom Valley Drive, Oaks, PA 19456, which is not affiliated with Krane Funds Advisors, LLC, the Investment Adviser for the Fund. Additional information about SIDCO is available on FINRA’s BrokerCheck.