MSCI China A-Share Phase Two Inclusion And Mainland Market Outlook
It is hard to believe Labor Day has come and gone and the end of summer is upon us. While we were barbecuing in the United States over the long weekend, a significant event was taking place on the other side of the world. The second phase of mainland China A-share inclusion within MSCI’s Global Standard Indexes occurred on Monday, September 3rd, following the first inclusion that happened on June 1st, 2018. Over the next several years, global asset managers will continue to reallocate billions of MSCI benchmarked assets to China A-shares. We believe this reallocation is a long-term catalyst for the potential outperformance of stocks within MSCI’s specific definition of inclusion. While recent trade tensions and headlines have tested our thesis, we still believe there is significant upside potential for the KraneShares Bosera MSCI China A Share ETF (Ticker: KBA). KBA is benchmarked to the MSCI China A-Share Inclusion Index, designed to track the progressive inclusion of A-shares within broad MSCI indexes over time.
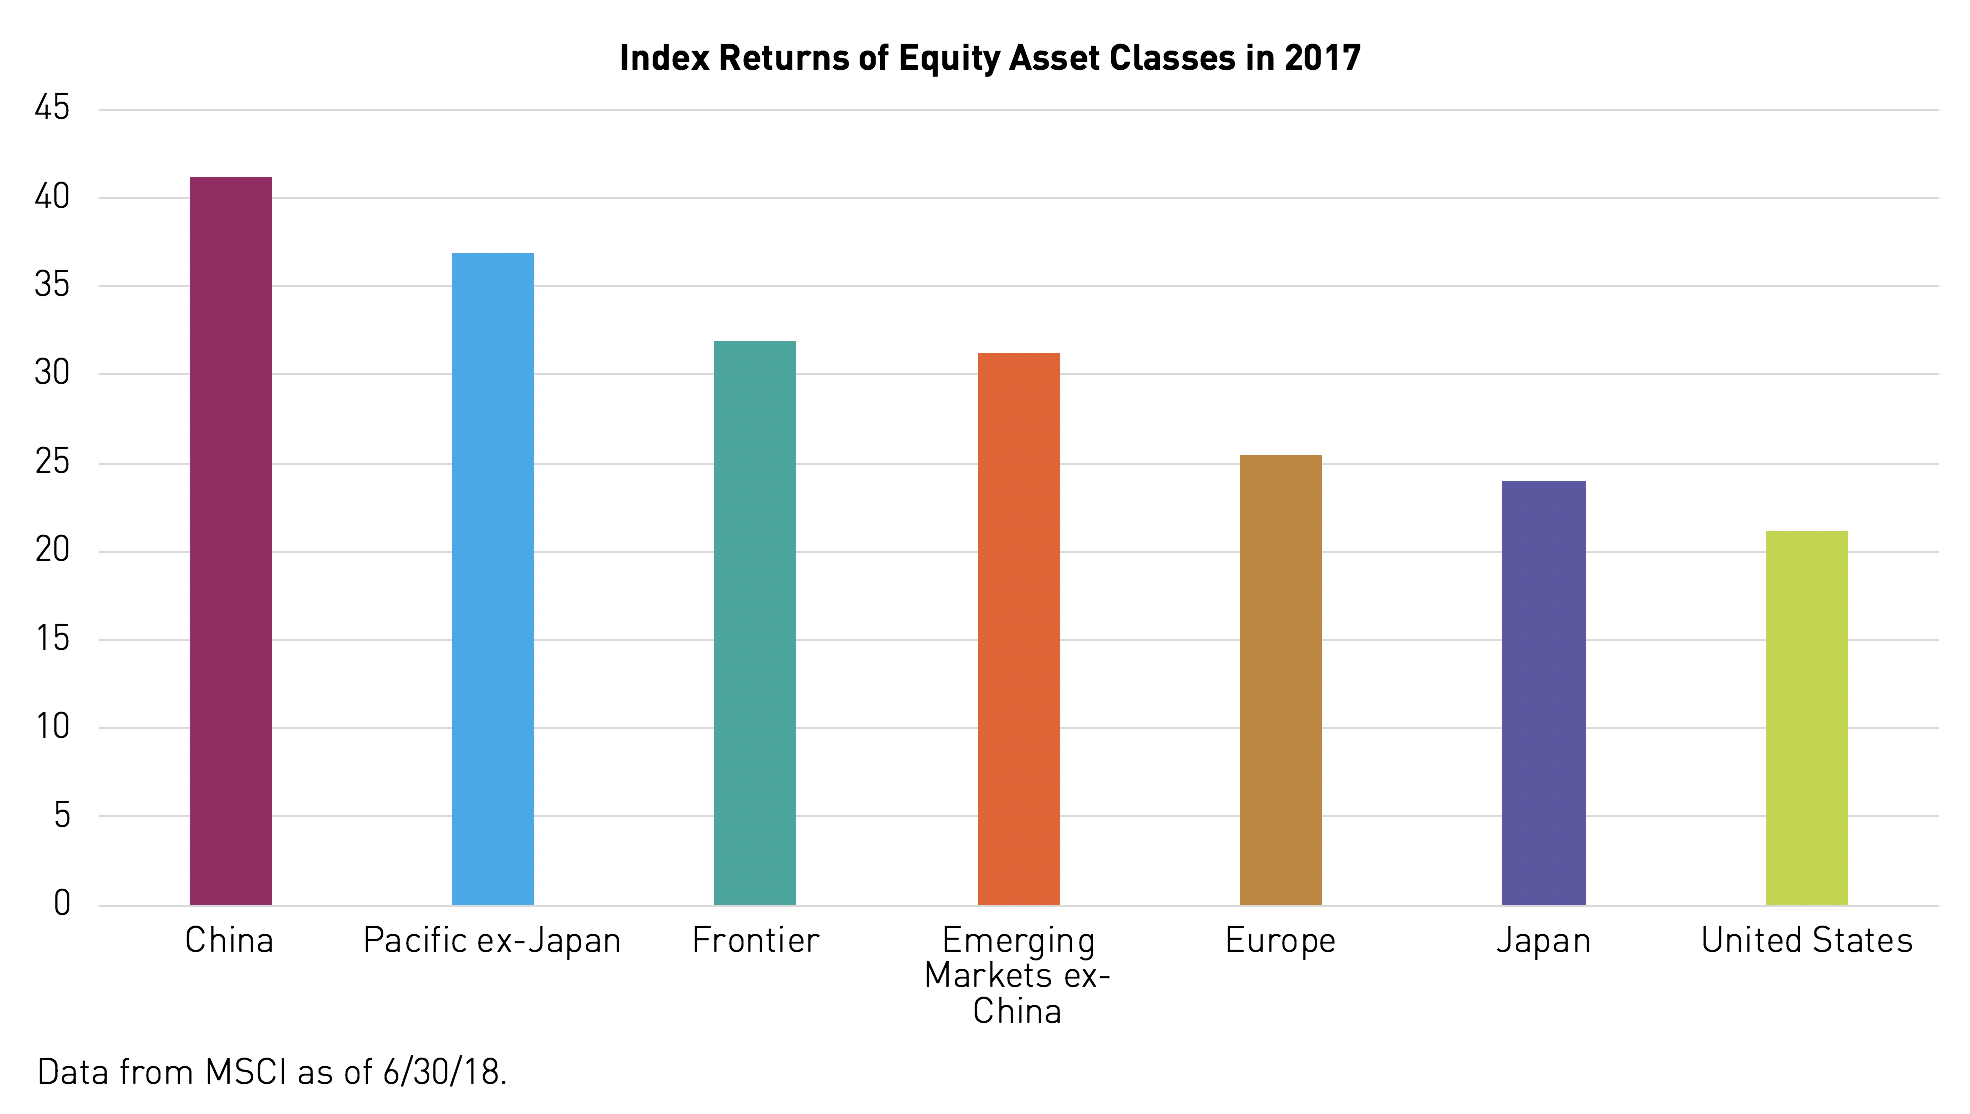
Investors looking for evidence of MSCI index inclusion’s effects need look no further than the 2017 ranked returns of major equity assets classes. It is easy to forget that in 2017, the Chinese markets were the best performing asset class globally, outperforming the number two market Pacific ex-Japan by 4.87% and the worst performer, the United States, by 19.99%1.
Click here for definitions.
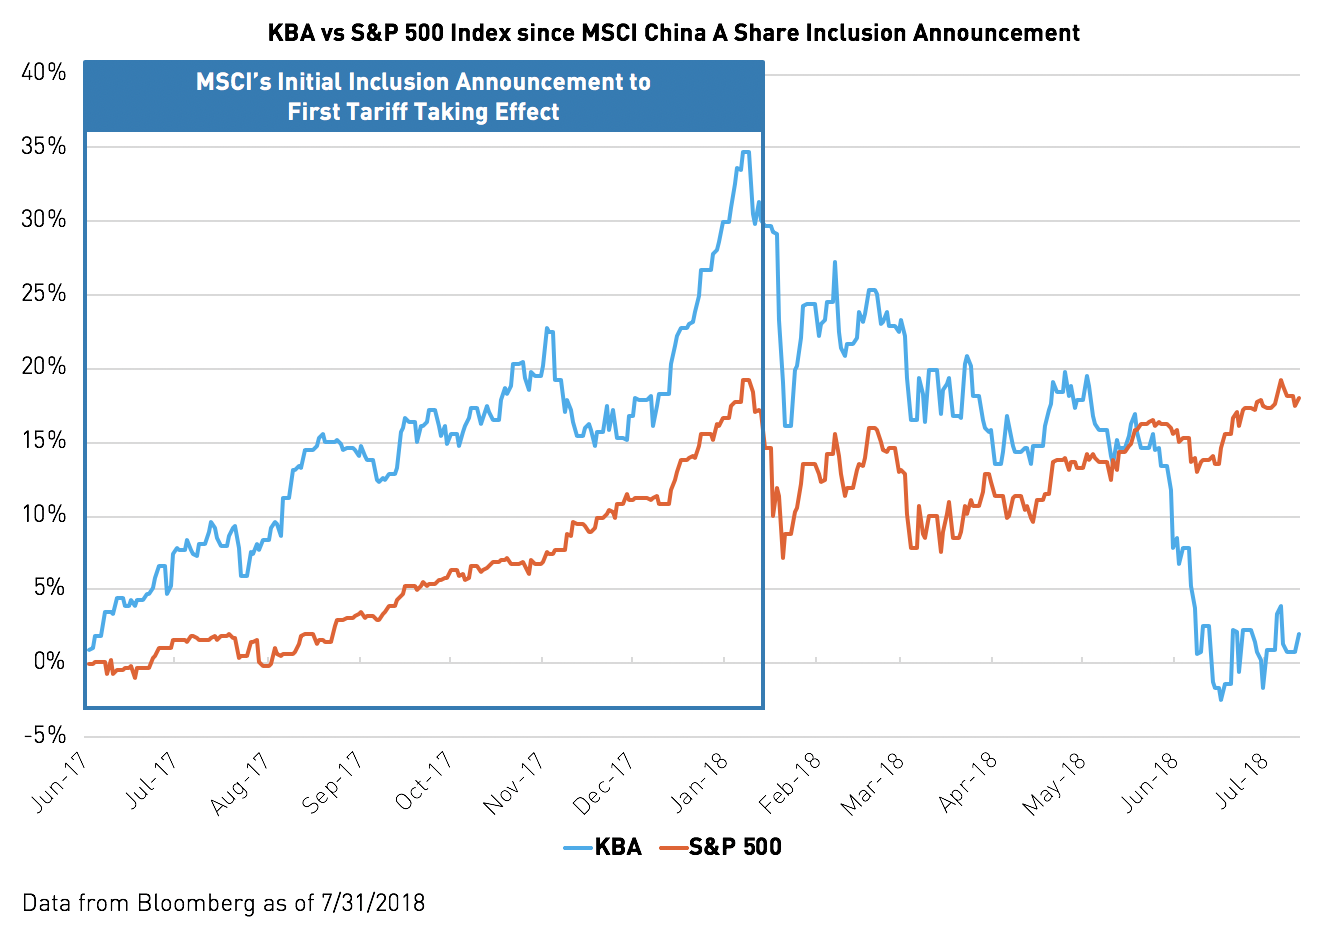
From MSCI’s initial inclusion announcement on June 20, 2017, through the end of January 2018, KBA outperformed the S&P 500 by 14.23%2. Over the same period China’s currency, the renminbi (RMB), rose 8.29% against the U.S. dollar, which was the dollar’s first substantial drop since 2015.
Click here for KBA standard performance as of most recent month-end.
However, after a year of stellar performance, the Chinese markets were challenged in the second quarter due to trade war headlines. At the same time, the U.S. dollar rallied on potential U.S. interest rate hikes causing the RMB to fall 5% against the USD3. Note, the trade-weighted dollar appreciated by 6.22% over this period, indicating broad dollar strength, not just RMB weakness4.
Recent trade concerns and currency weakness accompanied slowing economic growth, due in part to long-term reforms by the Chinese government. First, since 2015, China has waged an antipollution campaign targeting high polluting factories from industries such as coal, aluminum, and steel. Second, in late 2017, China embarked on a deleveraging campaign to control credit growth in the country. China’s high household savings rate means Chinese banks have ample deposits to lend. State Owned Enterprises have typically been the primary beneficiaries of this easy access to credit. As a part of the new campaign, China is making it harder for large SOEs to get loans and directing new lending toward small- and medium-sized enterprises. While these efforts are ultimately beneficial to China’s long-term economy, GDP growth has slowed slightly. China has been willing to suspend high rate growth for slower albeit healthier growth.
Many individual investors in China are experiencing sub 10% GDP growth for the first time in their lives. Estimates for the percent of stock ownership and trading accounted for by individual investors within Mainland China ranges from 80% to 85%5. The exact opposite is true in the United States’ market, where institutional investors, like pension funds and asset managers, own 80% of U.S. market value6. This high concentration of retail investor ownership makes the Mainland markets far more sensitive to individual investor sentiment.
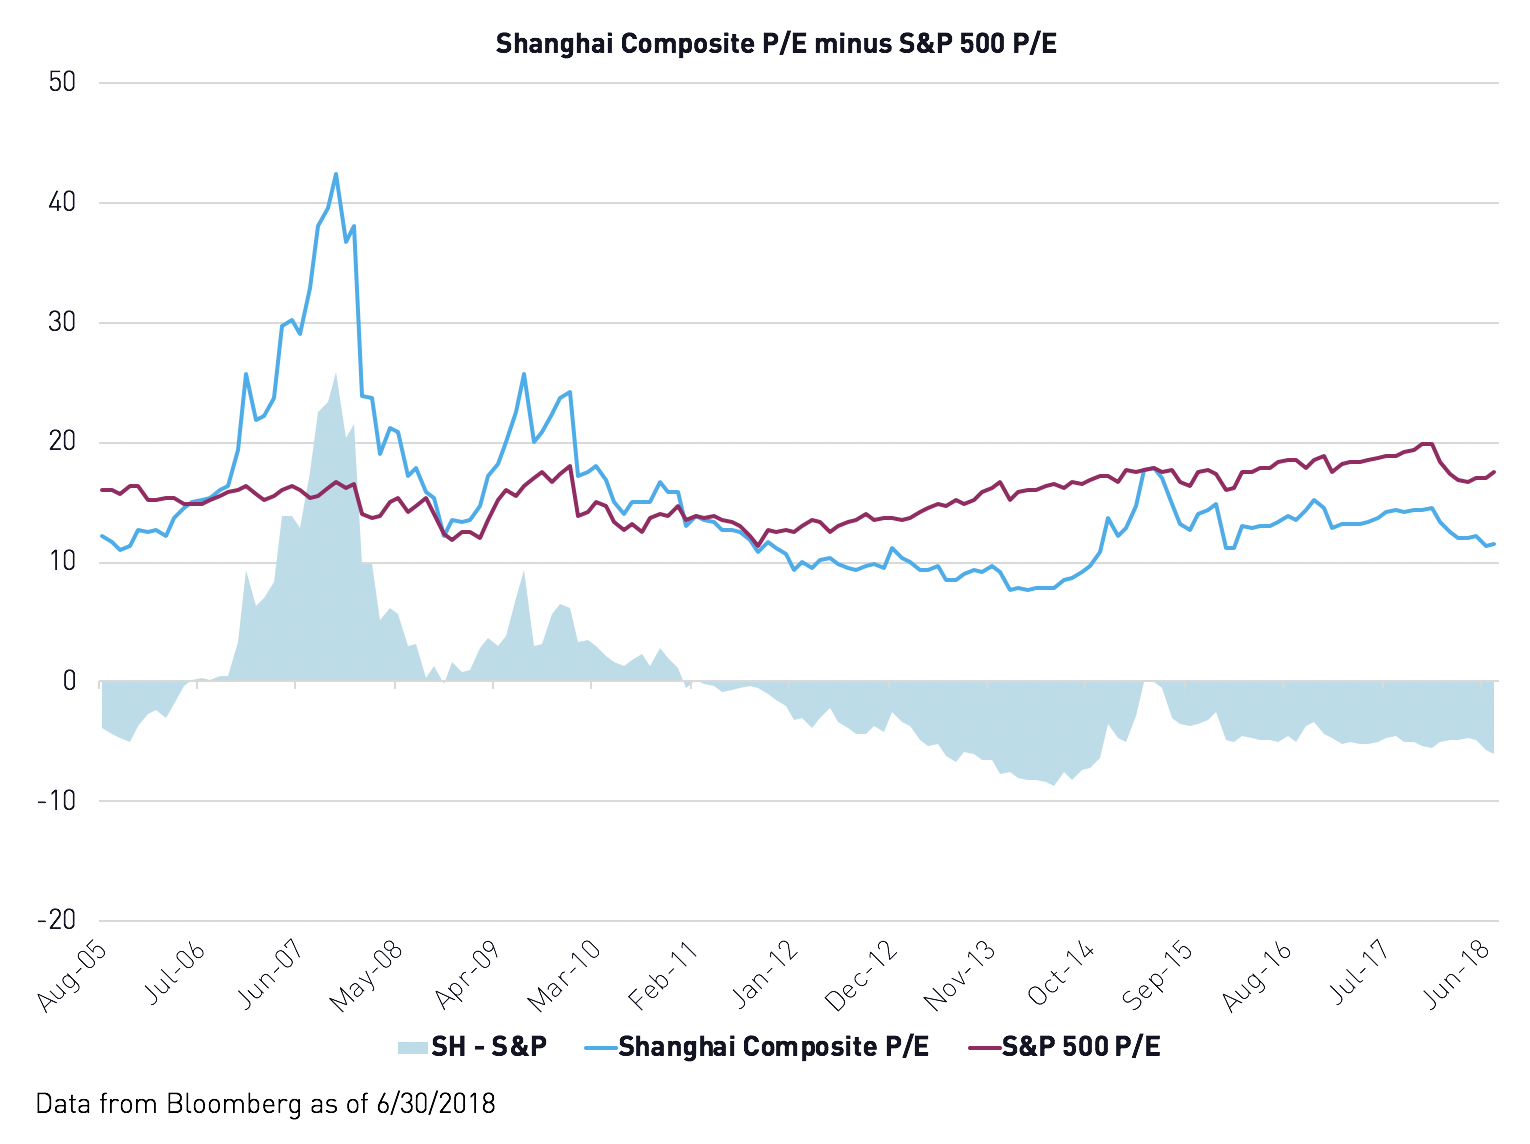
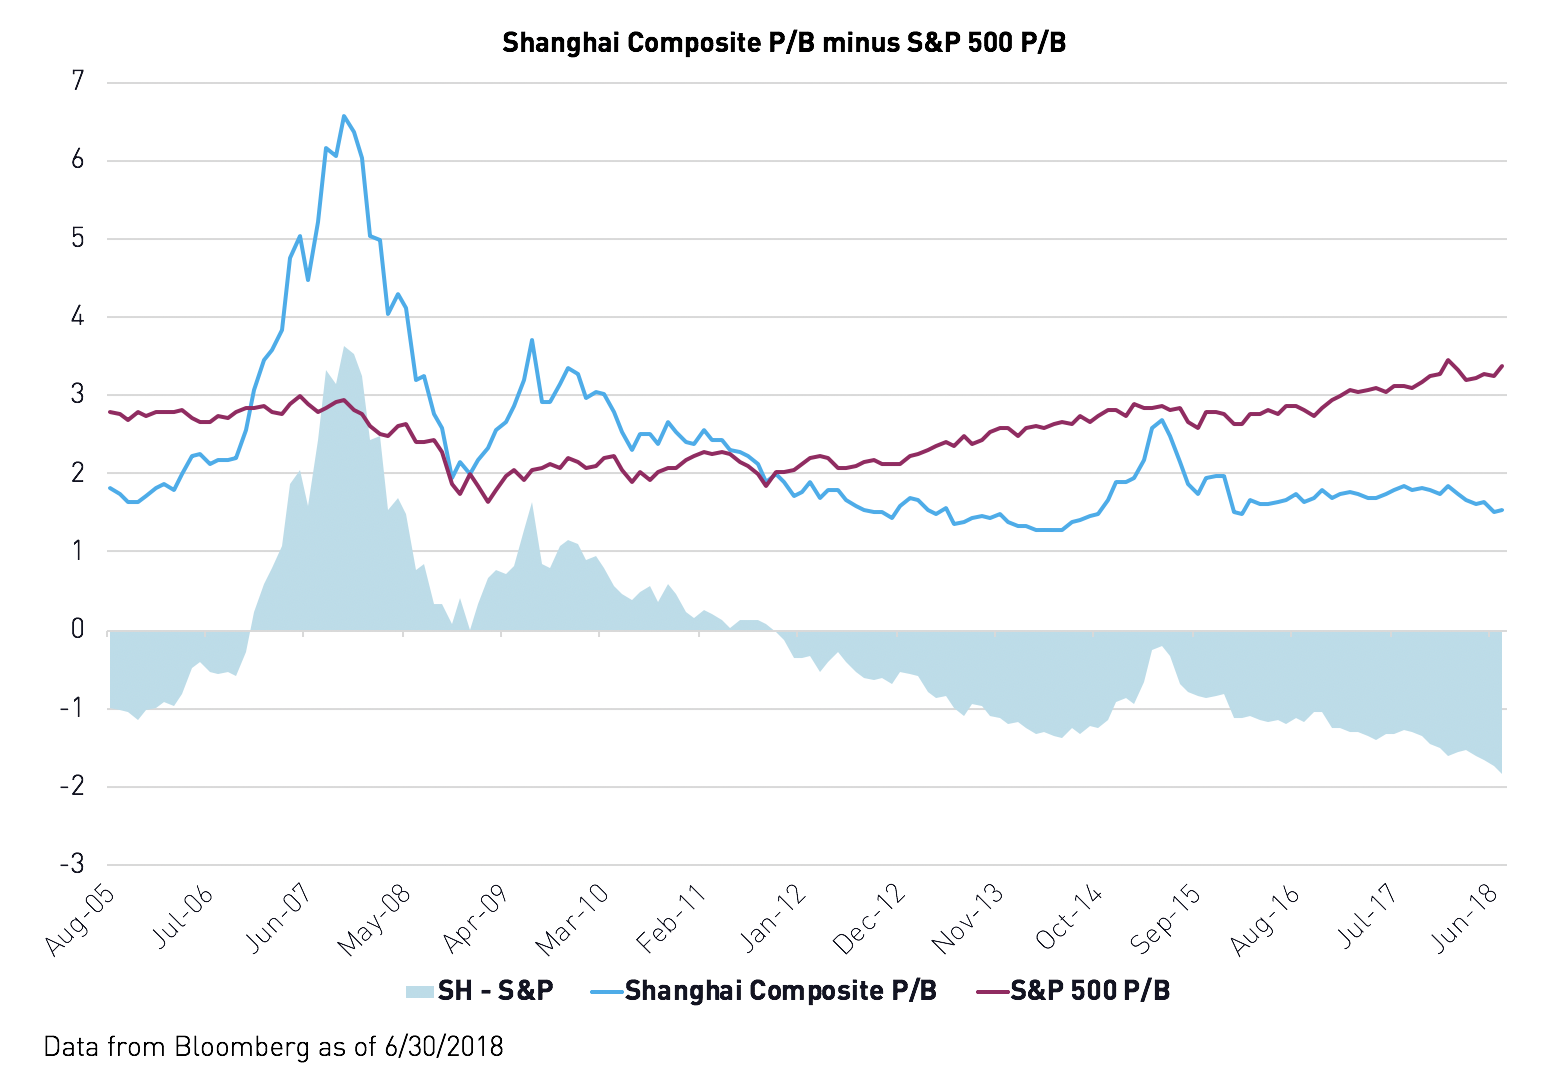
We believe there is a strong disconnect between sentiment and fundamentals in the Mainland market. Despite short-term performance, earnings remain strong with year over year earnings growth up over 22%. At the same time valuations are looking attractive with price to earnings (P/E) and price to book (P/B) ratios at historic lows compared to the U.S. market7.
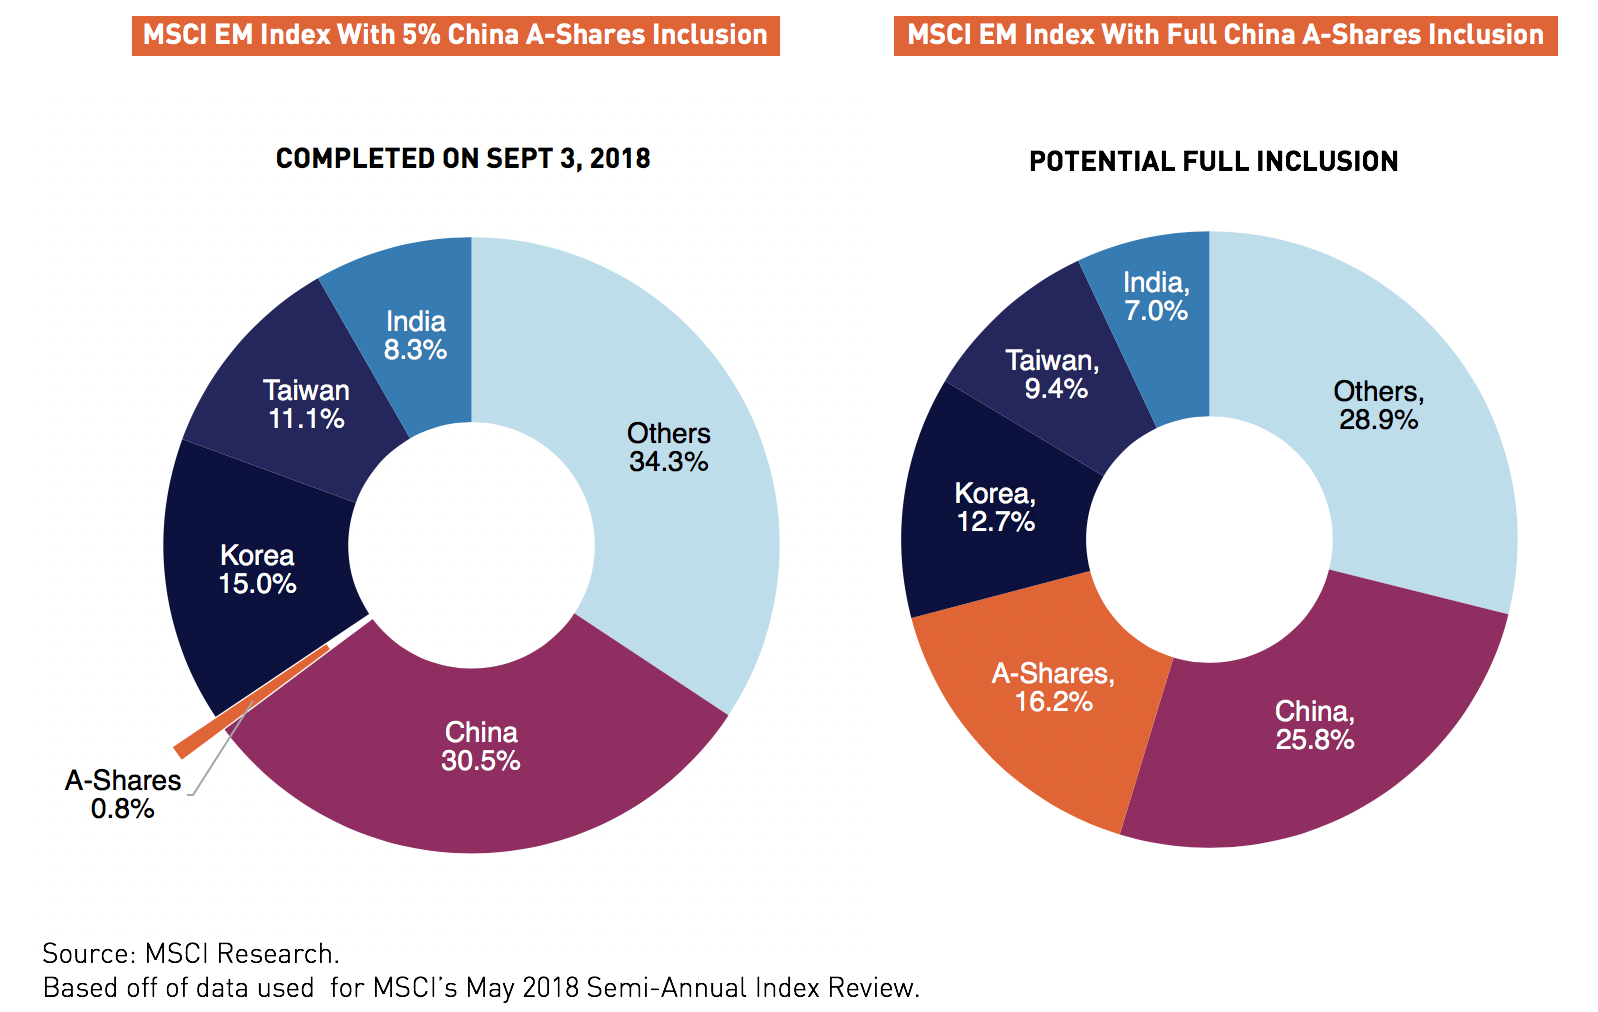
We also believe KBA may benefit from the further institutionalization of the mainland markets brought on by subsequent rounds of inclusion as MSCI intends to increase A-share weight within the Emerging Markets Index to over 16%8.
MSCI provided a pro forma index for the second inclusion in mid-August. It shows the dramatic effect of the inclusion on KBA stocks and highlights the size and continued rise of China within MSCI Emerging Markets Index.
- 461 of 1,151 of EM stocks will be from China
- China’s weight will increase from 31.9% to 32.3%
- The second largest country in the MSCI Emerging Markets Index is South Korea with 115 stocks (China 4X) while it’s market cap weight is 13.9% (less than half of China)
- Taiwan, the third largest weighted country has 89 stocks (China 5X) while the market cap weight is 11.7% (less than a third of China)
- China’s % weight within EM is 2X all of EM Europe, Middle East and Africa (14.3%)
- China’s % weight within EM is almost 3X all of EM Latin America (11.5%)
- China’s market cap at $1.7 trillion (free float market cap with foreign ownership inclusions) is 14X larger than MSCI Frontier Markets
- MSCI China All Shares Index: the MSCI China All Shares Index captures large and mid-cap representation across China A‐shares, B‐shares, H‐shares, Red‐chips, P‐ chips and foreign listings (e.g. ADRs). The index aims to reflect the opportunity set of China share classes listed in Hong Kong, Shanghai, Shenzhen and outside of China. It is based on the concept of the integrated MSCI China equity universe with China A-shares included.
- MSCI Pacific ex Japan Index: The MSCI Pacific ex Japan Index captures large and mid cap representation across 4 of 5 Developed Markets (DM) countries in the Pacific region (excluding Japan). With 148 constituents, the index covers approximately 85% of the free float-adjusted market capitalization in each country.
- MSCI Frontier Markets Index: The MSCI Frontier Markets Index captures large and mid cap representation across 29 Frontier Markets (FM) countries. The index includes 109 constituents, covering about 85% of the free float-adjusted market capitalization in each country.
- Emerging Markets ex China The MSCI Emerging Markets ex China Index used from 3/09/2017 through 12/31/2017 Prior to 3/09/2017, performance represented by MSCI Emerging Markets Index minus the returns of securities from China, which were removed at a fixed weight of 13.1%.
MSCI Emerging Markets ex China: captures large and mid cap representation across 23 of the 24 Emerging Markets (EM) countries* excluding China. With 692 constituents, the index covers approximately 85% of the free float-adjusted market capitalization in each country.
MSCI Emerging Markets Index: MSCI Emerging Markets Index captures large and mid cap representation across 23 Emerging Markets (EM) countries. With 834 constituents, the index covers approximately 85% of the free float-adjusted market capitalization in each country. - MSCI Europe Index: The MSCI Europe Index captures large and mid cap representation across 15 Developed Markets (DM) countries in Europe. With 443 constituents, the index covers approximately 85% of the free float-adjusted market capitalization across the European Developed Markets equity universe.
- MSCI Japan Index: the MSCI Japan Index is designed to measure the performance of the large and mid cap segments of the Japanese market. With 321 constituents, the index covers approximately 85% of the free float-adjusted market capitalization in Japan.
- The MSCI USA Index (USD): The MSCI USA Index is designed to measure the performance of the large and mid cap segments of the U.S. market. With 622 constituents, the index covers approximately 85% of the free float-adjusted market capitalization in the U.S. (Start Date: Mar 31, 1986).
- Price-Earnings Ratio: (P/E ratio) is the ratio for valuing a company that measures its current share price relative to its per-share earnings.
- Price-Book Ratio: (P/B ratio) is used to compare a firm's market to book value by dividing price per share by book value per share.
- Data from MSCI as of 6/30/2018
- Data from Bloomberg as of 7/31/2018
- Data from Bloomberg as of 7/31/2018
- Data from Bloomberg as of 7/31/2018
- Peter Pham, “What Is The Value Of China's Stock Market?” Forbes. 2/28/2018
- Charles McGrath, “80% of equity market cap held by institutions” Pensions & Investments. 4/25/2017
- Data from Bloomberg as of 7/31/2018
- “May 2018 Semi-Annual Index Review” MSCI. 5/14/2018
- Data from Bloomberg as of 8/29/2018
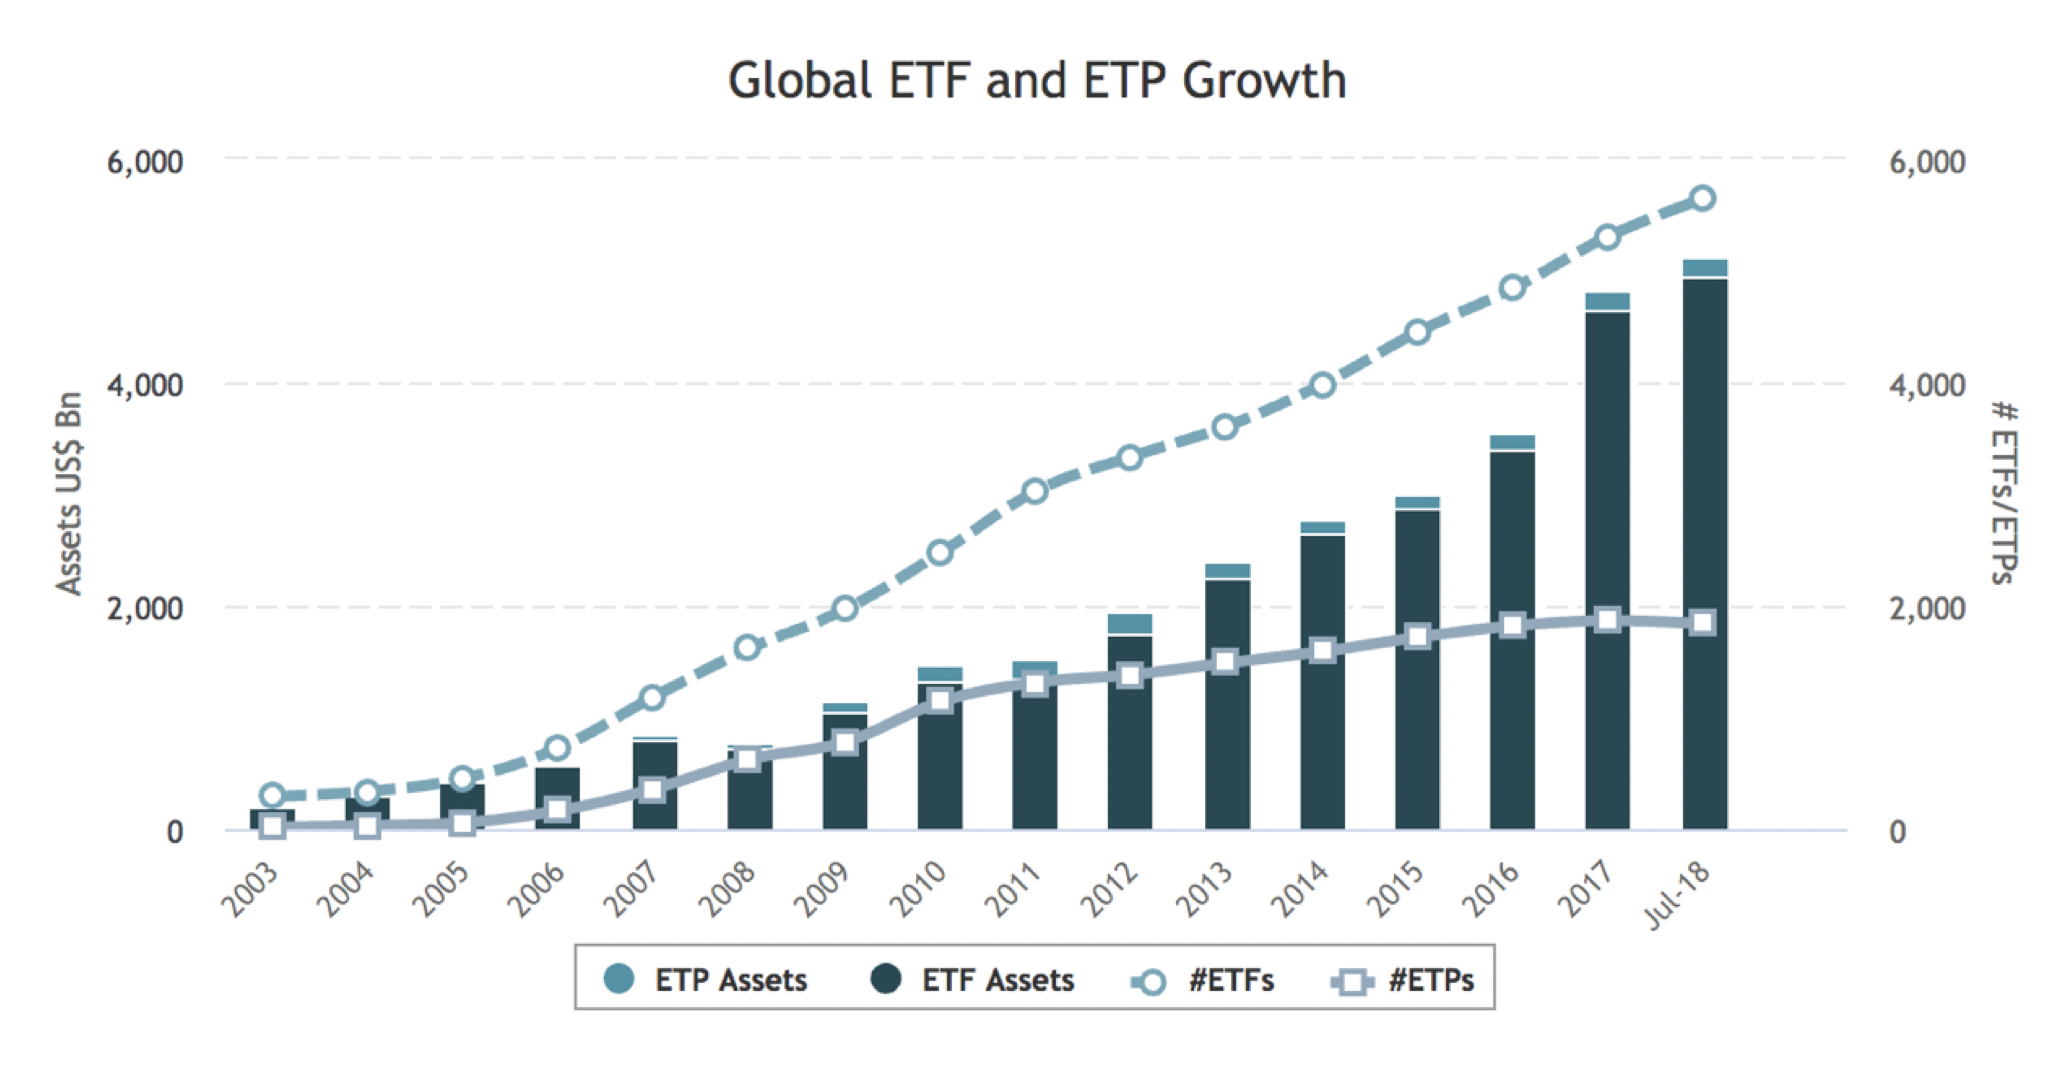
Why is this important? The assets invested in passive investment vehicles such as ETFs and index funds continue to grow rapidly. Passive investment vehicles are required to buy the underlying stocks within an index. As indexes incorporate more Chinese securities, passive funds will be required to mechanically buy those securities. We believe this reallocation to the stocks within KBA will have a positive effect on stock prices. It will also boost the influence of institutional investors, who are typically a more stable shareholder base.
Looking forward, we believe sentiment may improve in the near future. The Chinese government has recently introduced stimulus measures that could buoy investor sentiment ranging from targeted tax cuts to special bonds for infrastructure investment. Even though it was widely reported that resumed trade talks failed to lead to substantive progress, the RMB appreciated 0.30% against the USD over subsequent trading sessions9. Afterward, Treasury Secretary Steven Mnuchin appeared on CNBC praising China for supporting its currency, suggesting the trade talks may have been more productive then what the reports said.
While it is too early to speculate how long the trade war will continue, we do know that trade talks will resume in November and we feel optimistic that the two sides may reach a constructive agreement. Through our most recent meetings in China we understand that there is significant incentive to ensure the success of U.S. businesses operating in China. The one thing we know for certain is that MSCI will continue to increase China A-shares’ weight in its indexes and institutional investors will continue to allocate record amounts of money to the exact stocks we hold in the KraneShares Bosera MSCI China A Share ETF (Ticker: KBA).
The KraneShares ETFs are distributed by SEI Investments Distribution Company (SIDCO), 1 Freedom Valley Drive, Oaks, PA 19456, which is not affiliated with Krane Funds Advisors, LLC, the Investment Adviser for the Fund. Additional information about SIDCO is available on FINRA’s BrokerCheck.