Krane Funds Advisors, LLC is the investment manager for KraneShares ETFs. KraneShares offers innovative investment solutions tailored to three key pillars: China, Climate, and Alternatives. Our team is determined to provide industry-leading, differentiated, and high-conviction investment strategies that offer access to key market trends. Our mission is to empower investors with the knowledge and tools necessary to capture the importance of these themes as an essential element of a well-designed investment portfolio.

October 15, 2024 – China Has ‘Unleashed’ ‘Monetary Fiscal Bazooka’: KraneShares CIO
October 14, 2024 – China’s Fiscal Policy Has a Lot More Good News Coming, Says KraneShares’ Brendan Ahern

October 9, 2024 – Dr. Xiaolin Chen on China’s Policy Announcement | Bloomberg: The China Show 10/1/2024
October 8, 2024 – KraneShares Man Buyout Beta Index ETF (BUYO) Lists on NYSE: Applying Private Equity Selection Criteria To Public Equities
Our semi-monthly topical research reports. Subscribe to our weekly mailing list for more.

October 22, 2024 – KBA: China Rally – Could A-Shares Have More Room to Run?
October 17, 2024 – Invest in the A.I. Ecosystem with AGIX
October 16, 2024 – From Pilot to Powerhouse: The Evolution of China’s Carbon Emissions Trading System
October 8, 2024 – KraneShares Man Buyout Beta Index ETF (BUYO) Lists on NYSE: Applying Private Equity Selection Criteria To Public Equities
Information about KraneShares ETFs, China's markets and culture, and general investing resources.
Our market update is a collaboration between the KraneShares internal research department, our local Chinese partners, and select China thought leaders from around the world. Our goal is to deliver a differentiated perspective on Chinese capital markets, business, government, and culture.
280 Park Avenue, 32nd Floor
New York, NY 10017
1 Embarcadero Center, Suite 2350
San Francisco, CA 94111
181 Queen Victoria Street
London EC4V 4EG
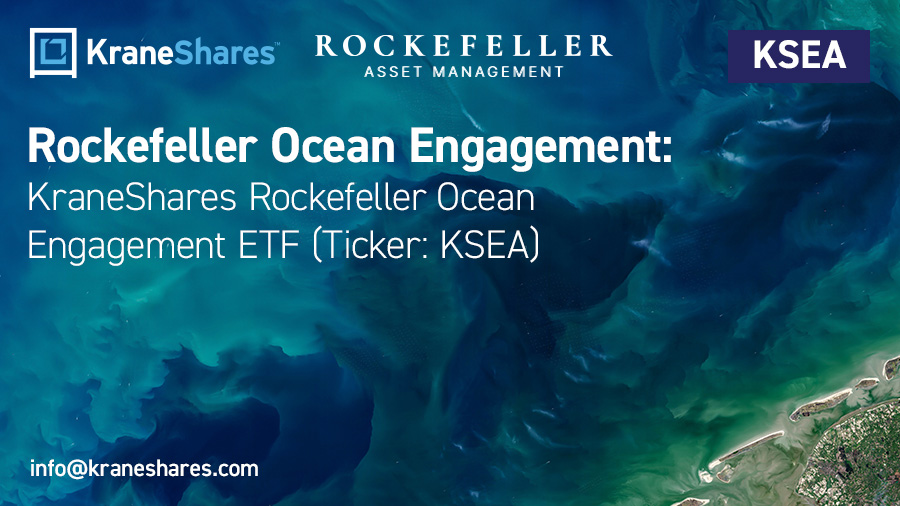
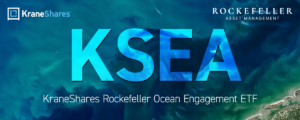
The KraneShares Rockefeller℠ Ocean Engagement ETF (KSEA) provides exposure to the rise of the "blue economy" by allocating to public companies whose business activities materially impact oceans and ocean resources. The blue economy is defined as economic activities that are based in and actively beneficial for the ocean. KSEA’s subadvisor Rockefeller Asset Management will proactively engage with companies held within KSEA on ocean related matters in pursuit of healthier oceans and outperformance versus its benchmark the MSCI All Country World Index. Holdings include companies from diverse sectors such as aquaculture, commercial fishing, waste management, renewable energy, and logistics, among others.
1. National Ocean Service, “Why should we care about the ocean?” retrieved 6/30/2024.
2. United Nations, Department of Economic and Social Affairs, “Making waves for a blue economy,” retrieved 6/30/2024.
3. Oceanpanel.org, “Why is the Ocean Important?” retrieved 6/30/2024.
4. NASA Sea Level Change, "Understanding Sea Level" Retrieved 6/30/2024.
| Ticker | KSEA |
| Primary Exchange | NYSE |
| CUSIP | 500767462 |
| ISIN | US5007674626 |
| Net Assets | $2,834,495 |
| Total Annual Fund Operating Expense | 0.86% |
| Inception Date | 9/11/2023 |
| Distribution Frequency | Annual |
| BBSMI
Broad-Based Securities Market Index – a broad-based index that represents the overall applicable domestic, international equity, or debt market, as appropriate.
|
MSCI ACWI Index |
| Underlying Index | N/A Active |
| Daily Net Asset Value (NAV) and Market Price | |
| NAV | $28.34 |
| NAV Daily Change | -1.01% |
| Market Price | $28.23 |
| Market Price Daily Change | -1.09% |
| 30 Day Median Bid/Ask Spread |
0.71% |
| The ETF’s 30 Day Median Bid-Ask Spread is calculated by identifying the ETF’s national best bid and national best offer ("NBBO") as of the end of each 10 second interval during each trading day of the last 30 calendar days and dividing the difference between each such bid and offer by the midpoint of the NBBO. The median of those values is identified and that value is expressed as a percentage rounded to the nearest hundredth. | |
| NAV | Market Price | Premium/Discount |
| $28.34 | $28.23 | $-0.11 |
| 2023 Full Year | Q1 2024 | Q2 2024 | Q3 2024 | Q4 2024 | |
| Days traded at premium | 74 | 177 | 96 | 9 | 0 |
| Days traded at NAV | 0 | 0 | 0 | 0 | 0 |
| Days traded at discount | 3 | 6 | 30 | 55 | 15 |
The Premium/Discount History chart demonstrates the difference between the daily market price of shares of the Fund and the Fund’s net asset value (NAV). The vertical axis of the chart shows the premium or discount of the daily market price as a percentage of the NAV. The horizontal axis shows each trading day in the time period, and each data point in the chart represents the Premium/Discount on that day. The data presented in the chart and table above represent past performance and cannot be used to predict future results.
| Fund NAV | Closing Price | BBSMI | |
| 1 Month | 3.13% | 3.21% | 2.32% |
| 3 Month | 11.10% | 10.68% | 6.61% |
| 6 Month | 8.28% | 7.23% | 9.67% |
| YTD | 10.63% | 10.00% | 18.66% |
| Since Inception | 16.28% | 15.84% | 26.93% |
| Fund NAV | Closing Price | BBSMI | |
| 1 Year | 19.68% | 19.18% | 31.76% |
| Since Inception | 15.37% | 14.96% | 25.37% |
Broad-Based Securities Market Index (BBSMI) is a broad-based index that represents the overall applicable domestic, international equity, or debt market, as appropriate.
MSCI All Country World Index "ACWI" (Net Total Return): The MSCI ACWI captures large and mid cap representation across 23 Developed Markets (DM) and 24 Emerging Market (EM) countries and is designed to track broad global equity-market performance as the index covers approximately 85% of the global investable equity opportunity set. The MSCI ACWI index was launched May 31, 1990.
The performance data quoted represents past performance. Past performance does not guarantee future results. The investment return and principal value of an investment will fluctuate so that an investor's shares, when sold or redeemed, may be worth more or less than their original cost and current performance may be lower or higher than the performance quoted.
| Ex-Date | Record Date | Payable Date | Amount |
Future calendar dates are subject to change. There is no guarantee that dividends will be paid. Past distributions are not indicative of future trends. This material is provided for educational purposes only and does not constitute investment advice.
Distributions are issued to brokers on the payable date, and are subject to broker payment schedules.
| 2023 Distributions |
| Ex-Date | Record Date | Payable Date | Amount |
| 12/18/2023 | 12/19/2023 | 12/20/2023 | 0.035253 |
Announcing the launch of the KraneShares Man Buyout Beta Index ETF (Ticker: $BUYO) on @NYSE. BUYO seeks to track the performance of the Man Buyout Beta Index, designed to apply the key return drivers of PE/buyout funds to public equities. The fund employs a systematic approach to… pic.twitter.com/xtAmWzdguD
— KraneShares (@KraneShares) October 8, 2024
@ahern_brendan joined @CNBCTheExchange to discuss #China’s #stimulus boost and rate cut "policy bazooka", how this has impacted the KraneShares CSI China Internet ETF (Ticker: $KWEB), and more.
— KraneShares (@KraneShares) September 27, 2024
Watch: https://t.co/OuENHKTcsf#investing #stocks #ETFs pic.twitter.com/gowPrmHeac


The Growth of $10,000 chart reflects an initial investment of $10,000 on the day prior to the selected time period and assumes reinvestment of dividends and capital gains. For the growth of $10,000 chart since inception, the initial investment of $10,000 is instead made on the inception date of the Fund. Fund expenses, including management fees and other expenses were deducted. The growth of a $10,000 investment in the fund is hypothetical and for illustration purposes only. Fund performance data used in this chart is based on Fund NAV and represents past performance. Past performance does not guarantee future results.
| Rank | Name | % of Net Assets | Ticker | Identifier | Shares Held | Market Value($) |
| 1 | WASTE MANAGEMENT INC | 3.95% | WM | US94106L1098 | 528 | 111,841 |
| 2 | CROWN HOLDINGS INC | 3.82% | CCK | US2283681060 | 1,124 | 108,264 |
| 3 | SSE PLC | 3.79% | SSE | GB0007908733 | 4,355 | 107,464 |
| 4 | TRIMBLE INC | 3.30% | TRMB | US8962391004 | 1,539 | 93,525 |
| 5 | TETRA TECH INC | 3.25% | TTEK | US88162G1031 | 1,875 | 92,119 |
| 6 | BUREAU VERITAS SA | 3.23% | BVI | FR0006174348 | 2,834 | 91,567 |
| 7 | VERALTO CORP | 3.13% | VLTO | US92338C1036 | 784 | 88,647 |
| 8 | LOBLAW COMPANIES LTD | 3.05% | L | CA5394811015 | 687 | 86,333 |
| 9 | TELEDYNE TECHNOLOGIES INC | 3.03% | TDY | US8793601050 | 192 | 85,811 |
| 10 | REPUBLIC SERVICES INC | 3.02% | RSG | US7607591002 | 419 | 85,522 |
Holdings are subject to change.
Hyperlinks on this website are provided as a convenience and we disclaim any responsibility for information, services or products found on the websites linked hereto.
Click here to continueYou are now leaving KraneShares.com. Hyperlinks on these websites are provided as a convenience and we disclaim any responsibility for information, services or products found on the websites linked hereto.
For questions on how to invest in KraneShares ETFs, please refer to ETF Trading 101.
This website uses cookies to help us enhance your browsing experience. By using this website you consent to our use of these cookies. You can customize your preferences by clicking “Cookie Preferences” below. To find out more about how we use cookies and how to manage them, please see our Terms & Conditions and Privacy Policy.