Krane Funds Advisors, LLC is the investment manager for KraneShares ETFs. KraneShares offers innovative investment solutions tailored to three key pillars: China, Climate, and Alternatives. Our team is determined to provide industry-leading, differentiated, and high-conviction investment strategies that offer access to key market trends. Our mission is to empower investors with the knowledge and tools necessary to capture the importance of these themes as an essential element of a well-designed investment portfolio.
Our semi-monthly topical research reports. Subscribe to our weekly mailing list for more.

August 21, 2025 – KraneShares Hedgeye ETF KSPY Celebrates 1-Year Track Record

August 7, 2025 – Labubus: How Pop Mart’s Newest Craze Reflects Chinese Cultural Influence in the U.S.

August 6, 2025 – How China’s EV Industry Is Shaping The Global Market: Insights From The Founder Of China’s Top EV Blog

August 5, 2025 – How to Unlock Private Markets With Hybrid ETFs
Information about KraneShares ETFs, China's markets and culture, and general investing resources.
Our market update is a collaboration between the KraneShares internal research department, our local Chinese partners, and select China thought leaders from around the world. Our goal is to deliver a differentiated perspective on Chinese capital markets, business, government, and culture.
280 Park Avenue, 32nd Floor
New York, NY 10017
155 Sansome Street, Suite 400
San Francisco, CA 94104
181 Queen Victoria Street
London EC4V 4EG
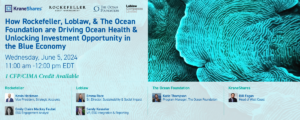
The KraneShares Rockefeller℠ Ocean Engagement ETF (KSEA) provides exposure to the rise of the "blue economy" by allocating to public companies whose business activities materially impact oceans and ocean resources. The blue economy is defined as economic activities that are based in and actively beneficial for the ocean. KSEA’s subadvisor Rockefeller Asset Management will proactively engage with companies held within KSEA on ocean related matters in pursuit of healthier oceans and outperformance versus its benchmark the MSCI All Country World Index. Holdings include companies from diverse sectors such as aquaculture, commercial fishing, waste management, renewable energy, and logistics, among others.
1. National Ocean Service, “Why should we care about the ocean?” retrieved 6/30/2024.
2. United Nations, Dept of Economic and Social Affairs, “Making waves for a blue economy”
3. Oceanpanel.org, “Why is the Ocean Important?” retrieved 6/30/2024.
4. NASA Sea Level Change, "Understanding Sea Level" Retrieved 6/30/2024.
| Ticker | KSEA |
| Primary Exchange | NYSE |
| CUSIP | 500767462 |
| ISIN | US5007674626 |
| Net Assets | $1,389,217 |
| Shares Outstanding | 50,002 |
| Total Annual Fund Operating Expense | 0.86% |
| Inception Date | 9/11/2023 |
| Distribution Frequency | Annual |
| Performance Benchmark | MSCI ACWI Index |
| Management Style | Active |
| Daily Net Asset Value (NAV) and Market Price | |
| NAV | $27.78 |
| NAV Daily Change | 0.00% |
| Market Price | $27.67 |
| Market Price Daily Change | 0.07% |
| 30 Day Median Bid/Ask Spread |
1.03% |
| The ETF’s 30 Day Median Bid-Ask Spread is calculated by identifying the ETF’s national best bid and national best offer ("NBBO") as of the end of each 10 second interval during each trading day of the last 30 calendar days and dividing the difference between each such bid and offer by the midpoint of the NBBO. The median of those values is identified and that value is expressed as a percentage rounded to the nearest hundredth. | |
| NAV | Market Price | Premium/Discount |
| $27.78 | $27.67 | $-0.11 |
| 2024 Full Year | Q1 2025 | Q2 2025 | |
| Days traded at premium | 117 | 2 | 2 |
| Days traded at NAV | 0 | 0 | 0 |
| Days traded at discount | 135 | 58 | 33 |
The Premium/Discount History chart demonstrates the difference between the daily market price of shares of the Fund and the Fund’s net asset value (NAV). The vertical axis of the chart shows the premium or discount of the daily market price as a percentage of the NAV. The horizontal axis shows each trading day in the time period, and each data point in the chart represents the Premium/Discount on that day. The data presented in the chart and table above represent past performance and cannot be used to predict future results.
| Fund NAV | Closing Price | MSCI ACWI Index | |
| 1 Month | 3.93% | 3.83% | 0.93% |
| 3 Month | 0.70% | 0.88% | -3.64% |
| 6 Month | 1.40% | 1.44% | 0.88% |
| YTD | 4.36% | 4.38% | -0.40% |
| Since Inception | 12.10% | 11.70% | 25.17% |
| Fund NAV | Closing Price | MSCI ACWI Index | |
| 1 Year | 7.40% | 7.22% | 11.84% |
| Since Inception | 7.24% | 7.00% | 14.71% |
| Fund NAV | Closing Price | MSCI ACWI Index | |
| 1 Year | 0.44% | -0.41% | 7.15% |
| Since Inception | 4.99% | 4.82% | 14.86% |
MSCI All Country World Index "ACWI" (Net Total Return): The MSCI ACWI captures large and mid cap representation across 23 Developed Markets (DM) and 24 Emerging Market (EM) countries and is designed to track broad global equity-market performance as the index covers approximately 85% of the global investable equity opportunity set. The MSCI ACWI index was launched May 31, 1990.
The performance data quoted represents past performance. Past performance does not guarantee future results. The investment return and principal value of an investment will fluctuate so that an investor's shares, when sold or redeemed, may be worth more or less than their original cost and current performance may be lower or higher than the performance quoted.
| 2025 Distributions and Calendar |
| Ex-Date | Record Date | Payable Date | Amount |
| 05/22/2025 | 05/21/2025 | 05/23/2025 | 4.409300 |
| 12/22/2025 | 12/22/2025 | 12/23/2025 |
Future calendar dates are subject to change. There is no guarantee that dividends will be paid. Past distributions are not indicative of future trends. This material is provided for educational purposes only and does not constitute investment advice.
Distributions are issued to brokers on the payable date, and are subject to broker payment schedules.
| 2024 Distributions |
| Ex-Date | Record Date | Payable Date | Amount |
| 12/17/2024 | 12/17/2024 | 12/18/2024 | 0.251325 |
| 12/17/2024 | 12/18/2024 | 12/18/2024 | 0.226816 |
| 2023 Distributions |
| Ex-Date | Record Date | Payable Date | Amount |
| 12/18/2023 | 12/19/2023 | 12/20/2023 | 0.035253 |
This video explores $AGIX's investment in @AnthropicAI and the broader themes of AI innovation, scalability, and safety, shaping the future of artificial intelligence. pic.twitter.com/99AXMgbbIE
— KraneShares (@KraneShares) July 25, 2025
We’re pleased to announce the launch of the Krane MSCI All Country Private Company Top 10 Series, a new fund providing investors access to a curated portfolio of leading venture-backed private companies. The fund tracks the MSCI All Country Venture-Backed Private Company Top 10… pic.twitter.com/i5L9gpSGMm
— KraneShares (@KraneShares) July 24, 2025


The Growth of $10,000 chart reflects an initial investment of $10,000 on the day prior to the selected time period and assumes reinvestment of dividends and capital gains. For the growth of $10,000 chart since inception, the initial investment of $10,000 is instead made on the inception date of the Fund. Fund expenses, including management fees and other expenses were deducted. The growth of a $10,000 investment in the fund is hypothetical and for illustration purposes only. Fund performance data used in this chart is based on Fund NAV and represents past performance. Past performance does not guarantee future results.
| Rank | Name | % of Net Assets | Ticker | Identifier | Shares Held | Market Value($) |
| 1 | Cash | 100.00% | – | – | 1,389,216 | 1,389,216 |
| 2 | SWISS FRANC | 0.00% | – | – | 1 | 1 |
| 3 | SWEDISH KRONE | 0.00% | – | – | 0 | 0 |
| 4 | JAPANESE YEN | 0.00% | – | – | -159 | -1 |
Holdings are subject to change.
Hyperlinks on this website are provided as a convenience and we disclaim any responsibility for information, services or products found on the websites linked hereto.
Click here to continueYou are now leaving KraneShares.com. Hyperlinks on these websites are provided as a convenience and we disclaim any responsibility for information, services or products found on the websites linked hereto.
For questions on how to invest in KraneShares ETFs, please refer to ETF Trading 101.
This website uses cookies to help us enhance your browsing experience. By using this website you consent to our use of these cookies. You can customize your preferences by clicking “Cookie Preferences” below. To find out more about how we use cookies and how to manage them, please see our Terms & Conditions and Privacy Policy.
Closure Announcement: Upon the recommendation of Krane Funds Advisors, LLC, the adviser to KraneShares Rockefeller℠ Ocean Engagement ETF (KSEA), the Board of Trustees of KraneShares Trust has approved the liquidation and termination of KSEA. Accordingly, shares of KSEA will cease trading on the NYSE (“Exchange”), and will be closed to purchase by investors as of the close of regular trading on the Exchange on May 20, 2025 (“Closing Date”). Shareholders may sell their holdings in the Fund prior to the Closing Date. The Fund will not accept purchase orders after the Closing Date. From the Closing Date through May 27, 2025 (“Liquidation Date”), shareholders may only be able to sell their shares to certain broker-dealers. There is no assurance that there will be a market for the Fund’s shares during this period. Read More.