
Defined Outcome ETFs: Good For Conservative Investors, Not Necessarily Conservative Investments
Introduction
All investors want to maximize returns while limiting loss. This is the allure of defined outcome ETFs: the ability to secure a specific potential return and a defined potential loss. Their popularity is evidenced by the growth in assets under management (AUM), which reached $58 billion in 2024.1
Defined outcome ETFs use options to set a floor or “buffer” to the downside by reducing potential upside, over a specified period, usually one or two years. These types of strategies appeal to conservative investors that might be invested in an S&P 500 index fund, but they do not necessarily work the best when applied to conservative investments. We believe defined outcome strategies applied to volatile markets may actually produce more optimal results because the upside cap can be much higher with the same levels of protection available on straightforward S&P 500 strategies.
The Case For Defined Outcome Strategies in International Markets
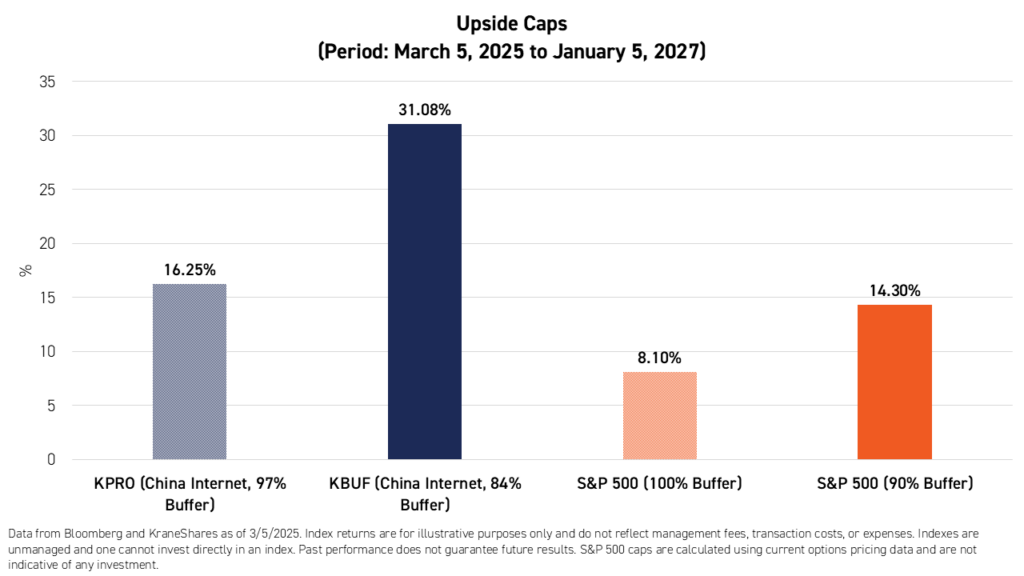
Based on current options pricing, our defined outcome strategies for China Internet offer twice as much upside potential compared to applying a similar strategy with the S&P 500 Index as the underlying asset.2
The performance data quoted represents past performance. Past performance does not guarantee future results. The investment return and principal value of an investment will fluctuate so that an investor’s shares, when redeemed or sold, may be worth more or less than the original cost. Current performance may be lower or higher than the performance quoted. For performance data current to the last month-end, please visit kraneshares.com/etf/kpro or kraneshares.com/etf/kbuf.
The KraneShares 100% KWEB Defined Outcome January 2027 ETF (Ticker: KPRO) and the KraneShares 90% KWEB Defined Outcome January 2027 ETF (Ticker: KBUF) provide exposure to China’s internet sector, represented by the KraneShares CSI China Internet ETF (Ticker: KWEB), which has historically been more volatile compared to US equity markets. We believe that defined outcome strategies are well suited for China’s internet sector because China’s internet equities have high upside potential from currently low valuation levels and, despite this potential, have experienced steeper drawdowns compared to both broad US equities and US internet equities.
KPRO offers a 100% downside buffer with a 20.01% upside cap, before expenses and fees. Meanwhile, KBUF offers a 90% downside buffer with a 40.01% upside cap, before expenses and fees. Since we extended the outcome periods for both KPRO and KBUF at the end of January, 2025, today's investors can take advantage of nearly the complete outcome period characteristics. As of the time of writing, the current remaining caps for KPRO and KBUF currently stand at 17.72% and 34.53%, respectively, and the current remaining buffers stand at 98.09% and 86.48%. To view the Funds' current caps and buffers as of the latest market close, please click here for KPRO and here for KBUF.
China Internet: High Potential Upside & High Volatility
The S&P 500 Index’s current weighted average price-to-earnings ratio (P/E) is 28.1, whereas KWEB’s is only 16.5 despite its focus on growth industries. The Dow Jones US Internet Composite Index, which is comparable to KWEB’s index, the CSI Overseas China Internet Index, in the US market, has a P/E of 34.0.3
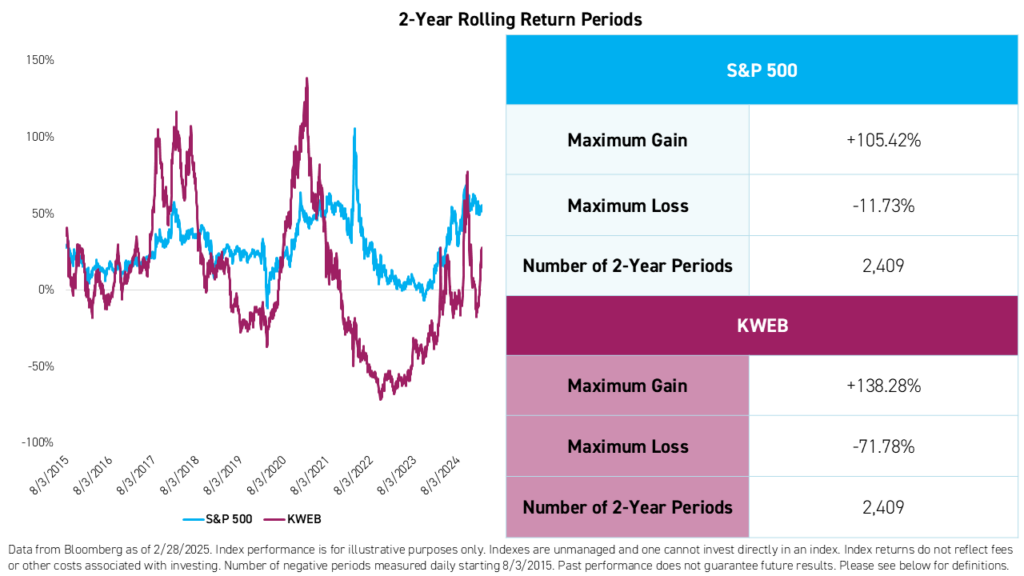
As the charts below demonstrate, KWEB has provided a wide range of potential 2-year outcomes since its launch in July of 2013. These include a maximum gain of +137% compared to the S&P 500’s 105%. With KWEB’s price currently at a low point but increasing, we believe the Fund has the potential to meet or even exceed the performance caps within our defined outcome strategies, which are already higher than most of our US-referenced defined outcome ETFs.*
The performance data quoted represents past performance. Past performance does not guarantee future results. The investment return and principal value of an investment will fluctuate so that an investor’s shares, when redeemed or sold, may be worth more or less than the original cost. Current performance may be lower or higher than the performance quoted. For performance data current to the last month-end, please visit kraneshares.com/etf/kweb.
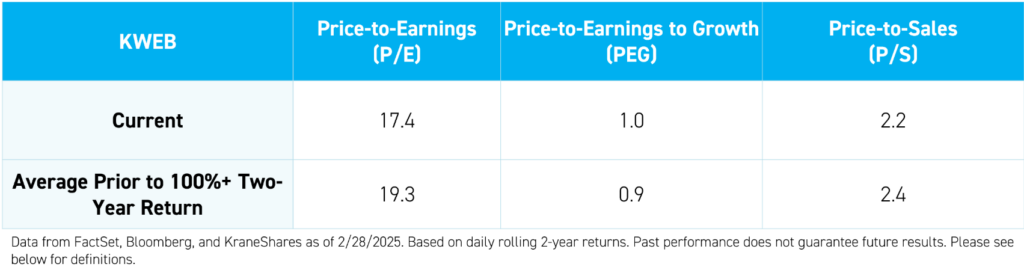
Since its inception, there have been 67 two-year periods, measured daily, in which KWEB has provided returns of more than 100%. The average starting P/E ratio for those periods was 18.0, higher than KWEB’s current P/E ratio of 17.4.
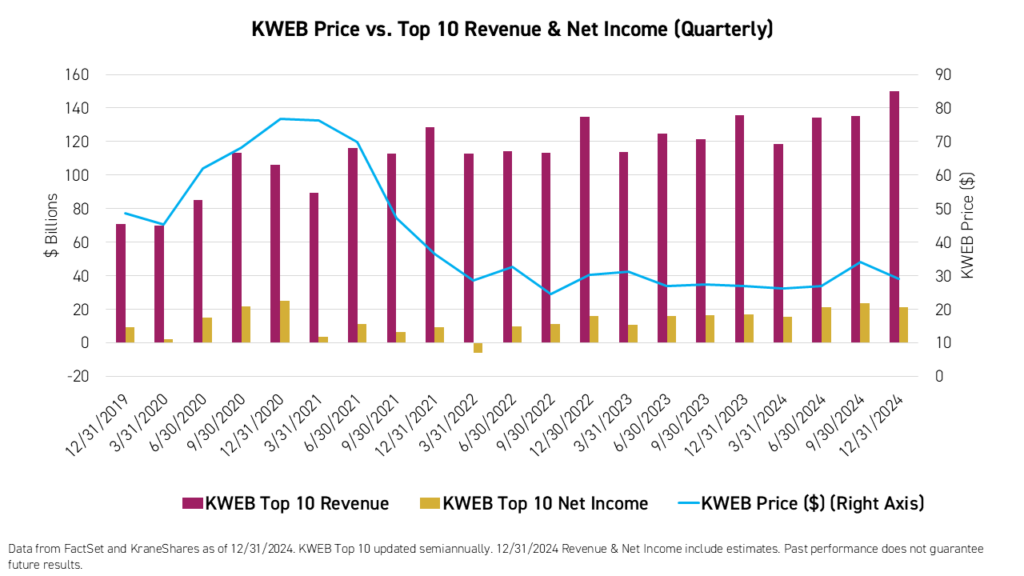
Furthermore, we believe that most of the drawdowns in KWEB over the past three years have not been fundamentally driven. KWEB’s holdings continue to increase their revenues, and the top ten holdings are profitable.
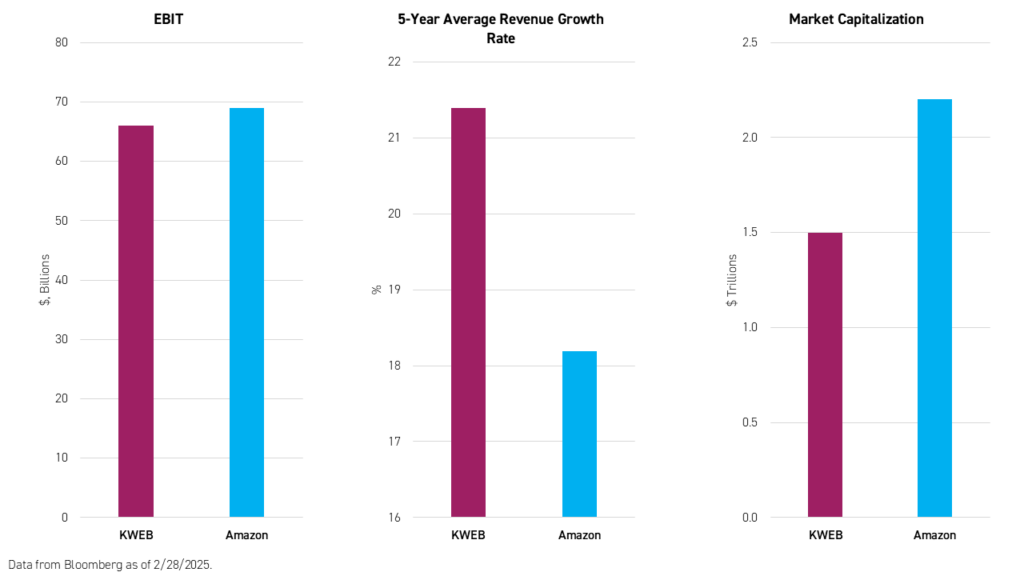
Despite representing over 30 companies with higher average 5-year revenue growth rates and nearly equivalent total earnings before interest and taxes (EBIT) than Amazon, all the companies in KWEB combined are currently worth only 50% of Amazon, for a difference of $700 billion in market capitalization.
It is also important to note that the secular growth trend behind KWEB remains intact. China’s internet penetration rate still has higher to go at only 76% compared to 97%4 in the United States. At the same time, China’s retail web sales totaled over $2 trillion in 2024,5 compared to just over $1 trillion in the United States.6
Conclusion
Why not apply defined outcome strategies where they count? We believe using a defined outcome strategy to invest in China’s internet sector is more attractive than using the strategy to invest in US stocks, represented by the S&P 500 Index, because China’s internet sector has higher volatility and higher upside potential, even within the confines of a defined outcome strategy.
KPRO and KBUF have characteristics unlike many other investment product and may not be suitable for all investors. For more information regarding whether an investment in the Funds is right for you, please read the Funds' prospectuses including "Investor Suitability Considerations".
Citations:
- Data from Bloomberg as of 2/3/2025. Includes US-listed ETFs with self-identified “buffers”.
- Data from Bloomberg and KraneShares as of 3/5/2025.
- Data from FactSet as of 1/31/2025.
- Data from Statista as of 12/31/2024.
- Data from National Bureau of Statistics of China as of 12/31/2024.
- Data from US Department of Commerce as of 12/31/2024.
*Based on an approximation of the average cap currently offered by selected US-markets-focused defined outcome strategy ETFs.
Term Definitions:
Price-to-Earnings Ratio (P/E): The price-to-earnings (P/E) ratio measures a company's share price relative to its earnings per share (EPS). Often called the price or earnings multiple, the P/E ratio helps assess the relative value of a company's stock. It's handy for comparing a company's valuation against its historical performance, against other firms within its industry, or the overall market.
Price-to-Earnings-to-Growth Ratio (PEG): The price-to-earnings-to-growth ratio (PEG) is a stock's price-to-earnings (P/E) ratio divided by the growth rate of its earnings for a specified period. The PEG ratio is used to determine a stock's value while also factoring in the company's expected earnings growth, and it is thought to provide a more complete picture than the more standard P/E ratio.
Price-to-Sales Ratio (P/S): The price-to-sales (P/S) ratio is a valuation ratio that compares a company’s stock price to its revenues. It is an indicator of the value that financial markets have placed on each dollar of a company’s sales or revenues.
Earnings Before Interest & Taxes (EBIT): Earnings before interest and taxes (EBIT) indicate a company's profitability. EBIT is calculated as revenue minus expenses excluding tax and interest. EBIT is also called operating earnings, operating profit, and profit before interest and taxes.
Revenue: What a company earns from selling goods and/or services before the deduction of expenses during a given period.
Net Income: What a company earns from selling goods and/or services after the deduction of expenses during a given period.
Revenue Growth: The rate of increase in the compensation a company receives for the sale of goods and/or services.
Market Capitalization: The total market value of a company's shares outstanding.
Index Definitions:
S&P 500 Index: The S&P 500 Index is widely regarded as the best single gauge of large-cap U.S. equities. There is over USD 9.9 trillion indexed or benchmarked to the index, with indexed assets comprising approximately USD 3.4 trillion of this total. The index includes 500 leading companies and covers approximately 80% of available market capitalization. The index was launched on March 4, 1957.
Dow Jones US Internet Composite Index: The Dow Jones Internet Composite Index is designed to measure the performance of the 40 largest and most actively traded stocks of U.S. companies in the internet industry. To be eligible for the index, a company must derive at least 50% of cash flows from the internet. The index was launched on February 18, 1999.
CSI Overseas China Internet Index: CSI Overseas China Internet Index selects overseas listed Chinese Internet companies as the index constituents; the index is weighted by free float market cap. The index can measure the overall performance of overseas listed Chinese Internet companies. The Index is within the scope of the IOSCO Assurance Report as at 30 September 2018. The index was launched on September 20, 2011.