Carbon Markets – Everything You Need to Know as 2022 Takes Off
By Luke Oliver, Head of Strategy

Upcoming Webinar:
Join us on Thursday, February 10, 2022, for our webinar at 11:00 am - 12:00 pm EST.
Carbon Market State of the Union with KraneShares and Climate Finance Partners
Click here to register.
2021 was a defining year for carbon markets as an asset class, making headlines in terms of both performance and climate impact. While the voluntary offset market made huge strides, it was dwarfed by the much larger, more liquid segment of the ecosystem – the compliance market. All major compliance markets—those administered by centralized governing bodies such as the European Commission or the California Air Resource Board—experienced significant gains, with the European Union, the largest submarket, being the strongest. Further, the year was full of huge developments as well as challenges that made the space increasingly compelling and diverse with new markets entering and a renewed international focus. If you were under a rock or simply need a “Previously on Carbon Markets Update" before we dive into 2022, I have you covered with a rundown of the key developments and stories of the year.
Performance
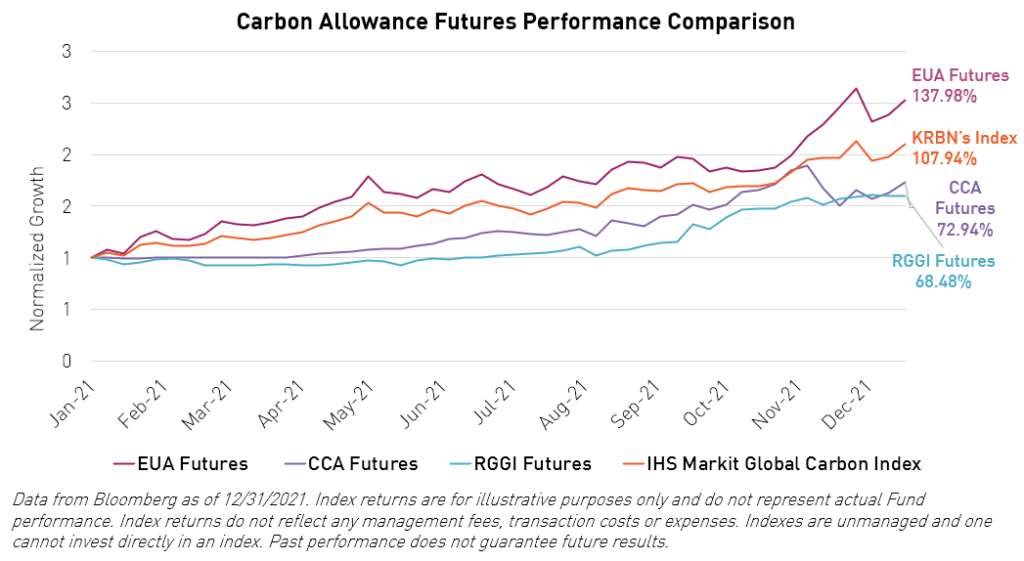
The IHS Markit Global Carbon Index returned 108% in 2021, which explains why this market caught investors' attention. The index—which tracks the futures of the major global carbon markets including Europe, California (also tied to certain Canadian provinces), and RGGI (Regional Greenhouse Gas Initiative, which covers the US states from Virginia up to Maine)—seeks to simplify the global market into a single reference point, as the markets all trade at distinct levels. European Union carbon allowance (EUA) futures returned 138% over the year, California returned 73%, and the RGGI returned 68%. These three main ingredients of the IHS Markit index contributed to the 108% blended return of the benchmark, with the internal price of carbon in the index rising from $24.78 to $51.451. Additionally, this growth in the markets resulted in a widening of the spread between the biggest and smallest of the majors. EUAs now clock in at $93 equivalent while RGGI has just broken $14.00. California holds the middle at $32, and the newest entry, the UK allowance market, caps the group at $98.2
Fit for 55 and the shift to “deficit”
The European Commission’s “Fit for 55” package, unveiled on July 14th, 2021, was one of the most significant events of the year, and its impact drives much of the outlook for European Union Allowances. However, I can keep the summary of this ambitious plan to make Europe emission neutral short. The key is that this is a compliance market, meaning that the changes are legally binding and enforced. The initiative tightens and strengthens the program via numerous measures but most notably by:
- Increasing the Linear Reduction (of supply) Factor (LRF) from 2.2% to 4.2%
- Maintaining the Market Stability Reserve (MSR) purchases at 24% until 2030
- Phasing out free allocations and moving to 100% auction by 2027.
COP26
In early November 2021, more than 190 nations took another step forward in addressing the challenge of climate change at the 26th Conference of the Parties (COP26). The result was the Glasgow Climate Pact, which is an unprecedented, wide-ranging, and relatively ambitious climate response. More than 150 countries submitted improved national plans on cutting emissions – known as Nationally Determined Contributions (NDCs) – to the United Nations. The conference also brought forth various bilateral and multilateral initiatives targeting emissions on methane, coal, deforestation, coal, and transport. Countries also decided on how to structure international trading of carbon credits under Article 6 of the Paris Agreement. Additionally, delegates approved regulations that will govern the registration and creation of tradeable emissions reductions – referred to in the Paris Agreement as ITMOs (Internationally Transferred Mitigation Outcomes). Going forward, the focus will be on implementation. A newly formed Supervisory Body will oversee the carbon crediting mechanism, meeting at least twice next year to establish a proposed set of rules to review at the next COP in Egypt.
Correlations and Natural Gas
Natural Gas had a heck of a year. It was one of the few markets, with esoteric dry bulk being the other, that outperformed carbon in 2021. This outperformance created an interesting paradigm, as natural gas was the low-hanging fruit for compliance entities to reduce emissions and, therefore, their exposure to carbon costs. Natural gas has half the CO2 emissions of coal, so when a powerplant, for example, switches from coal to gas, they halve their demand for allowances. European natural gas ripped 300% higher over the course of 2021,3 which a) supported carbon prices as it was now more challenging for compliance entities to reduce emissions and b) for the same reasons opened the near-term ceiling for carbon prices as the Marginal Abatement Cost Curve (MACC) was shifted.
It can and has been argued that carbon is lagging natural gas and should catch up. It is worth noting that natural gas prices did NOT rise +300% because of carbon pricing. Demand had been strong from Chinese/Indian demand and supply into Europe from Russia was stifled. Low inventories, compounded by a fear of a colder winter (which did not materialize in Q4), also added upward pressure. We hope that natural gas prices stabilize so that fuel switching can occur and reduce emissions, followed by carbon prices moving up and along the MACC to abate more carbon. While this potentially means a more modest immediate investment return, it means the market is making more robust progress. That said, natural gas being sky-high also acts as a catalyst for innovation further along the curve, so perhaps we just need the European Commission to stay the course and not concede to political pressure.

California volatility
California Carbon Allowance (CCA) prices rose steadily for much of 2021. As compliance entities awakened to the exposure, they ran to rising carbon prices and switched into risk management mode, creating an upward price discovery. This catalyst and the prospect of a tightening of the program in 2022 makes California a particularly attractive market for us; though, we strongly favor an overweight as part of a diversified* basket rather than a CCA-only allocation. We do anticipate some volatility, as was witnessed in late November. Leading up to the auction, compliance entities and speculators had built physical and futures positions to the extent that fewer than anticipated joined the Q4 auction. The absence of speculators meant a clearing price of $28.26 versus a futures price of $36, albeit the compliance entities participated with higher than normal demand.4 The market corrected 12% on the auction news, compounded further by margin calls on those taking leveraged positions. Lessons were learned, and some aggressive speculators washed out. Let us hope the number of auctions increases as part of the program review; there is no need for unnecessary event risk in such a critical market.

RGGI hits ceiling
For the first time in six years, RGGI hit its price ceiling at the December quarterly auction and triggered the Cost Containment Reserve (CCR). The clearing price was $13.00/ton, roughly 40 percent higher than the $9.30/ton price at the last auction in September.5 The CCR provides additional allowances for sale when auction prices exceed the predetermined price threshold, which in 2021 was set at $13, to act as a soft ceiling. RGGI futures closed the year at $13.90, and the 2022 CCR reset to $13.91. As I type, futures are over $14!2
UK market launched
In yet another amazing turn in a busy year for carbon, the post-Brexit UK market launched its own futures AND made inclusion into the IHS index. The market had operated pre-Brexit inside the European program, so it was not a surprise that it kicked off with robust liquidity. Many had anticipated a selloff in EUAs as UK entities switched from EUA to UKA, but that did not transpire. Moreover, the growing EUA demand absorbed that selling without noticeable price impact. The futures launched in May with volumes of $25 million per day and quickly outstripped the RGGI market volumes.2 UKA became the most expensive of the liquid markets though it did not materially get through the $100 equivalent price, which I observe to be something of a psychological level. With its strong volumes and price action, UKA was added to the IHS index in November with a 5% initial allocation.
The Specter of Political Risk
The greatest risk factor in the carbon markets is political risk. By this, we mean the risk of politicians enacting, or the market speculating that they might enact, a policy that negatively affects the Emission Trading Systems. Why would they do that? Because a powerful industry lobby may push back on the rising price of carbon or because politicians' constituents complain about rising prices, correctly or incorrectly, associated with carbon allowance costs. These risks appeared on schedule in 2021 as prices rose. Greece and Poland both expressed concerns about the program. In the US, there was some noise as well, such as when California’s carbon-friendly democrat governor faced recall, Pennsylvania expressed doubt around its expected joining of RGGI, and Virginia’s incoming Republican governor vowed to exit RGGI at the first opportunity. These concerns have not materialized so far, though they point to the tangible risks that exist.
The European Commission’s Hans Timmermans has done an excellent job holding the line. Gavin Newson survived the recall, and Virginia’s Youngkin is unlikely to be able to leave RGGI without a struggle. I hope Pennsylvania does join RGGI, which surprisingly almost doubles the program. The Pennsylvania Senate voted to block the state’s participation in the program. However, Pennsylvania Governor Wolf vetoed the resolution, with the state expected to join RGGI in the second quarter of this year.
China’s new ETS market; Korea opening up
In July of 2021, China officially launched its national carbon emissions trading market, which is positioned to be the world’s largest. China is expected to further expand the program, opening it to financial institutions and emitters in sectors such as non-ferrous metal and building materials. South Korea—a more established market—also eased open the door to international access, which we are closely watching. The first auction of the year for Korea’s market was undersubscribed again, selling just 40% of available allowances even as the KAU price continues to climb higher.7
Contango
I am constantly asked about futures contango, or the roll yield of the futures tracked by the IHS Markit Global Carbon Index. Having spent 2009-2012 managing $16bn of commodities assets, this feels like déjà vu. In simplest terms, the roll yield is the expected cost (or, in rarer cases, gain) of holding a futures position over a one-year period. Contango is the theoretical loss a holder of futures will experience, on an annualized basis, if the underlying asset price does not change over the life of the holding. Another way of looking at it is whether the market is pricing a premium or discount into the futures price relative to the underlying asset. In short, the blended roll yield for the index basket was around negative 200bps. Over 2021 we observed a range of 190-220bps, skewing higher towards the Dec 2021 futures expiry. As seen with the prices, it varied by market, with EUA at around 60-80bps, RGGI at 120-160bps, and California suggesting a 450-550bps spread. That latter is most interesting, as I will argue that much of that spread holds some utility because it reflects the asymmetry of the market, i.e., an implicit long put premium. California has a price floor that rises 500bps plus CPI (Consumer Price Index), and based on current CPI, that’s 1200bps of extra downside protection each year! This and the limit on physical holding of CCAs manifests in this roll yield.
KRBN – the largest carbon fund and among best performing ETFs of the year
Lastly, we cannot avoid mentioning the KraneShares Global Carbon Strategy ETF (Ticker: KRBN) itself. As the largest, most liquid carbon fund in the world, it was front and center to the major changes happening in the underlying market.
Launching in July 2020, KRBN saw over $1bn in inflows during 2021 and ended the year with AUM (Assets Under Management) of $1.62bn.8 The Street cited KRBN as the second-best performing ETF of the year, with only a ~$50mm esoteric dry bulk fund posting a higher return. The fund had a total return of 109% for the calendar year (See the standard performance tables at the end of the article). In keeping with providing a dynamic global carbon price, the fund added the UK market in December and increased its exposure to the California market to align with the IHS Markit Global Carbon Index.
The basket approach also reduced volatility for investors as the individual markets maintained their low correlations with one another. Most notably, during the weak month of October for EUAs, the California and RGGI markets hit highs. Likewise, when California stumbled in November on weak auction results, EUAs surged higher.
In both cases, the basket exhibited smoother returns relative to its parts. KRBN also became a bellwether for the broader market, marking another feature contributing to the fund’s meteoric rise. For the carbon trading community, one of the most anticipated events of the year was the KRBN rebalance—when the fund had to roll its entire futures position, raising questions of how that might affect the underlying markets. KRBN transitioned successfully without any notable impact to the underlying markets—this spoke as much to the growing depth and liquidity of these markets as it did to the precision and strategy executed by the portfolio team.
In October 2021, KRBN was joined by KCCA (KraneShares California Carbon Allowance Strategy ETF) and KEUA (KraneShares European Carbon Allowance Strategy ETF), which offer single market exposure to California Carbon Allowances and European Union Allowances, respectively.
Conclusion
2021 was an incredible year for carbon markets that placed it firmly on the map as an emerging asset class. With greater awareness, a renewed focus on climate targets, and a compelling demand/supply thesis, 2022 holds a lot in store. Now that you are up to speed on where carbon markets are today, please join us for our regular market commentary.
Follow us for more carbon market insights:
Please sign up for a Carbon and Climate newsletter that will begin in Q1 2022.


*Diversification does not ensure a profit or guarantee against a loss.
Citations
- Data from Bloomberg and IHS Markit as of 12/31/2021.
- Bloomberg Auction Results, as of 12/31/2021.
- Data from Bloomberg as of 12/31/2021.
- California Air Resources Board, “Auction Notices and Reports,” last updated Nov 2021.
- ESAI Power, “RGGI Auction 54 Update – Clearing price increase of 40%”, 12/6/2021.
- Bloomberg Auction Results, as of 1/18/2022.
- Carbon Pulse, “Korean auction undersubscribed again, even as price rises”, 1/12/2022.
- Data from Bloomberg, as of 12/31/2021.
r-ks-sei