
California Carbon: Policy, Positioning, Performance
By  Luke Oliver, Managing Director and Head of Strategy
Some of the most compelling opportunities lie just outside the periphery of many traditional portfolios. We believe this is the case for the $73 billion California carbon market, which has seen trading volume grow nearly 250% in the last five years.1 California carbon allowance (CCA) prices currently trade around $30.50.2 Comparatively, the auction reserve floor price of $25.87 is just 15% lower than the current spot price and can significantly limit the downside. This floor price increases annually by 5% plus inflation,3 meaning it will rise above today’s current levels within 3 years. The market’s upper-bound mechanism, the price ceiling, stands at $94 today and rises by that same inflation-adjusted rate to reach roughly $134 by 2030.4 These inherent market dynamics present the California carbon opportunity in its simplest terms. The price floor limits the potential downside while the upside is growing with the consistently increasing upper-bound levels.
Looking ahead, the regulator is finalizing reforms to help ensure the market stays on track and drives price discovery. We believe prices should move away from the floor and towards the containment reserves.
Why Now?
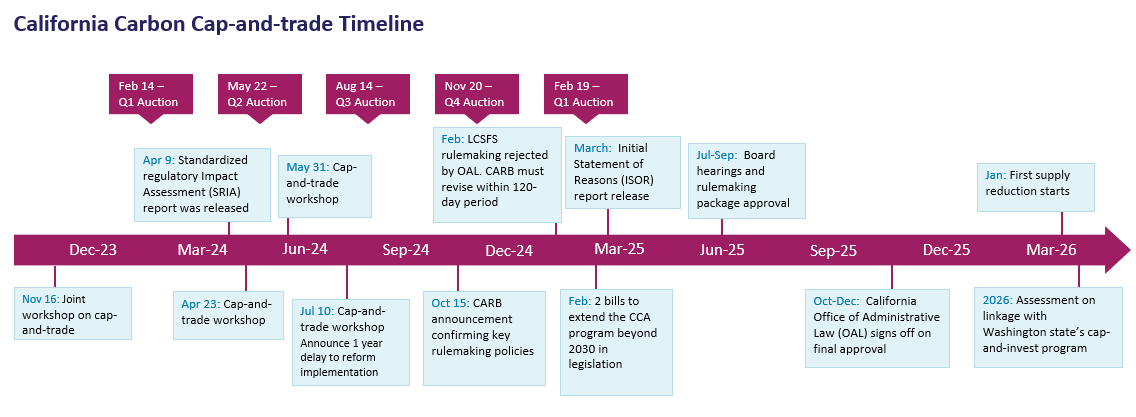
The strong CCA investment thesis has been in place for some time but is increasingly interesting today as prices have returned toward the floor. The recent weakness we have seen was due to the reform policy implementation being pushed back by a year. However, the aggressive supply-tightening policies provide a steep trajectory to target through 2030.
The first quarterly auction held in February cleared at $29.27, the lowest price in two years.5 However, this was largely in line with expectations of sub-$30 because of depressed prices in the secondary market and later led to a rally as the market found its footing. CCAs are situated in a unique window where the market has yet to fully price in the reform policies as participants wait for more guidance from the regulator.
With this in mind, the current price point, paired with the market's 5% plus Consumer Price Index (CPI) annual adjustment to floor and ceiling levels (roughly 8% using today's inflation numbers), creates a unique opportunity for potential asymmetric returns. If there was more policy clarity, we believe that the intrinsic value of CCAs would be closer to the Tier 1 resistance level of $60.47, which is also rising at the same 8% rate.6 The Tier 1 resistance level is a speed bump baked into the market by the regulator as part of the Allowance Price Containment Reserve (APCR) to ensure prices do not rise too high too fast.

In our view, this delay meant investors temporarily left CCAs and turned to other more active opportunities during the high cost of capital environment in 2024. We believe the oversold prices are, therefore, more a reflection of opportunity cost expectations in the short term rather than a bearish long-term outlook. As policy and program uncertainties start to clear in the next 6 months, we expect to see a revival in CCAs. Prices could rise to intrinsic value closer to the current Tier 1 level of $607, with a path toward $90 by 2030 and possibly as high as $180 by the middle of the next decade.8
1. Policy Tightening: A key factor in our outlook for CCA price appreciation is the upcoming policy announcements from the California Air Resources Board (CARB). We expect CARB to clarify the timing and outline the specifics of the tightening options they proposed in 2024 by the end of Q1 or early Q2. CARB presented annual cap reduction trajectories that both represent an increased level of tightening compared to current levels, with each scenario leading to a more constrained supply of CCAs:
- Option 1 involves a steepening in the short term followed by a shift to a linear tightening in the long term.
- Option 2 is even more aggressive in the short term, followed by a flatline in the medium term before tightening again in the long run.

Both options ultimately lead to a tighter market, and either one is projected to be positive for price action. Depending on the cap scenario, between 180-265 million allowances will be removed from the supply by 2030, with the cap reducing by 10-14% annually, a significant increase from the existing rate of 4%.9 The price weakness observed in 2024 can be attributed to the one-year delay in implementing these policies (from 2025 to 2026) and the lack of clarity on the specifics of these tightening options. Despite this, CARB provided significant insights during Q3 and Q4, but the delay and lack of specifics had a more significant downside impact than the expected upside. As these policy clarifications materialize, we believe the market is likely to react positively.
Additionally, there is a growing focus on the "social cost of carbon" referenced by CARB in relation to adjusting APCR tiers. Some analysts are forecasting a potential 20% hike in these tiers after 2026, which would represent a substantial upside surprise for the market and further support higher prices in the medium term.10
2. Program Extension: Two new bills with explicit authorization to extend the program beyond 2030 were introduced to the legislature just ahead of the February 21 deadline. Senators Limone and McGuire introduced "SB-840 Greenhouse gases: market-based compliance mechanism," and Assembly Member Irwin provided "AB-1207 Climate change: market-based compliance mechanism." Both bills are light on details for now but are important placeholders to prompt more formal discussions.
The chance of the CCA program not formally extending beyond 2030 is considered negligible by most market commentators, analysts, and lawyers closely following this space.11 It is also widely believed that no formal extension is necessary for the program to continue beyond 2030, though formal codification would provide much-needed clarity. Any further updates on this front in 2025 would carry significant weight, particularly as CCA prices are currently trading near the floor price. The need for clarity surrounding the renewal is heightened by our models, which forecast a tightening surplus in the coming years. With the demand for CCAs expected to rise as the surplus diminishes, formal extension clarity would be a powerful catalyst for prices.
3. Shift Away from CARB: CARB has done an admirable job managing the CCA program in the context of its broader responsibilities. The challenge of balancing the program’s effectiveness with other state policies and programs, as well as communicating these complexities to the market, is no small feat. However, we are increasingly hearing from market participants that state legislators are pushing for more aggressive action from CARB. If the legislature takes on a more active role in shaping the program, we could see tighter policies implemented more quickly than expected. In reaction to the Trump administration’s reduced support for the energy transition, we could also see state legislature doubling down on climate policy, particularly the cap-and-trade program. The cap-and-trade program has proved resilient to past political challenges under President Trump’s first term, where California's link with Quebec under the Western Climate Initiative was tested in court but gained no traction. For further analysis of the political implications for the state program, see our California Cap-and-Trade: Navigating Real and Perceived Uncertainty report here.
While we would prefer not to see leadership change mid-course, we believe what is needed most is decisive clarity regarding policy direction and timing. When these become clear, market forces will be better able to price CCAs, potentially accelerating price increases. We believe that while a shift in CARB’s role may create uncertainty, a more active role for legislators could drive policy tightening sooner than expected.
4. Demand/Supply Imbalances: Regardless of the political and regulatory shifts, 2025 marks a significant inflection point for the CCA market. The cap-and-trade lifecycle generally starts out with a surplus balance, or an excess supply of available carbon allowances, so that prices remain low and the regulated entities have time to ease into the program. However, over time, the regulator consistently takes out portions of the available allowances, which leads to supply scarcity that drives carbon prices higher and makes it less economical to pollute.
The surplus of carbon allowances, which had been growing in previous years, began to taper off in 2024, and we are now entering a phase where surpluses are expected to decline. This “cliff” event, expected to occur in 2026, will be a key factor in driving CCA prices higher. The market is likely to begin factoring in tightening supply as early as 2025.
Our demand/supply models forecast that surpluses will reach tight levels by 2030, with the risk of exhaustion in the early 2030s. As compliance entities start to engage more actively with the APCR, the pressure on CCA prices will mount. Our base case for 2030-2031 prices is around $90,12 with a clear upward trajectory as the market heads toward a more supply-constrained future.

A shift in sentiment can rapidly move markets as is the case with European Union carbon allowances that were up 15% in the first month of this year on rapid growth in investment fund buying.13 Investors who can look past the current market fluctuations and focus on the structural catalysts driving the CCA market can be well-positioned to capitalize on the upside potential in the coming months and years. For investors interested in the CCA market, the KraneShares California Carbon Allowance Strategy ETF (Ticker: KCCA) provides targeted exposure to the California market, while the KraneShares Global Carbon Strategy ETF (Ticker: KRBN) provides exposure to the largest, most liquid carbon allowances markets, including California carbon.
For KRBN standard performance, top 10 holdings, risks, and other fund information, please click here.
For KCCA standard performance, top 10 holdings, risks, and other fund information, please click here.
Citations:
- Bloomberg as of 12/31/2024.
- Data from Bloomberg as of 3/4/2025.
- Inflation is measured by the Consumer Price Index (CPI): an estimate of the level of prices of goods and services bought for consumption purposes by households. It is calculated as the weighted average price of a market basket of consumer goods and services.
- CARB, "Joint California-Québec Workshop: Potential Amendments to the Cap-and-Trade Regulation," Nov 16, 2023
- Data from CARB, Auction Notices, retrieved 3/4/2025.
- Macquarie, “Carbon Compendium 2025.” Based on the price of the current Tier 1 level.
- Macquarie, “Carbon Compendium 2025.”
- Price forecasts from Veyt, Macquarie, BloombergNEF, and cCarbon, retrieved 2/20/2025.
- CARB, "Information Regarding Cap-and-Trade Regulation," Updates Issued October 15, 2024; NACW, “Plenary: Status and Outlook for North American Compliance Markets”, March 2024
- Macquarie, “Carbon Compendium 2025.” Average based on a range for the social cost of carbon.
- BloombergNEF; Macquarie, “Carbon Compendium 2025.” retrieved 3/4/2025.
- CLIFI retrieved 3/4/2025.
- Data from Bloomberg as of 1/31/2025.