1. Data from Bloomberg since fund index inception to 3/31/2026, based on monthly correlations of KCCA to the S&P 500 Index ("US large cap"). The S&P 500 is widely regarded as the best single gauge of large-cap U.S. equities. The index includes 500 leading companies and covers approximately 80% of available market capitalization. The performance data quoted represents past performance, and current returns may be higher or lower. Past performance does not guarantee future results.
2. Congressional Research Service. The California Cap‑and‑Trade Program: Overview and Considerations for Congress. CRS Report R48314, 12/18/2024. Library of Congress.
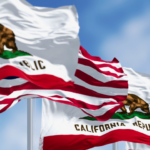
3. Governor Gavin Newsom, “California is now the 4th largest economy in the world,” 04/23/2025.
4. International Carbon Action Partnership, “California extends cap-and-trade to 2045, renames program “Cap-and-Invest,” 9/29/2025.


The Growth of $10,000 chart reflects an initial investment of $10,000 on the day prior to the selected time period and assumes reinvestment of dividends and capital gains. For the growth of $10,000 chart since inception, the initial investment of $10,000 is instead made on the inception date of the Fund. Fund expenses, including management fees and other expenses were deducted. The growth of a $10,000 investment in the fund is hypothetical and for illustration purposes only. Fund performance data used in this chart is based on Fund NAV and represents past performance. Past performance does not guarantee future results.
| Name | Identifier | Position | Current Exposure ($) | % NAV |
| California Carbon Allowance (CCA) Vintage 2026 Future | KBCZ26 Comdty | 3,538 | 119,265,980 | 100.05% |
| 119,265,980 | 100% | |||
| Name | Identifier | Position | Current Notional ($) | % NAV |
| KraneShares Sustainable Ultra Short Duration Index ETF | 500767355 | 3,678,400 | 92,124,057 | 77.28% |
| USD Cash & Equivalents** | USD | 23,106,886 | 23,106,886 | 19.38% |
| State Street Institutional U.S. Government Money Market Fund | GVMXX | 3,976,840 | 3,976,839 | 3.34% |
| 119,207,781 | 100% | |||
Holdings, carbon allowance exposures, and collateral are subject to change.
**Includes USD cash deposits & cash in margin accounts ($23,106,886)
| Rank | Name | % of Net Assets | Ticker | Identifier | Type | Shares Held | Market Value($) | Notional Value($) |
| 1 | KraneShares Sustainable Ultra Short Duration Index ETF | 77.28% | KCSH | US5007673552 | ETF | 3,678,400 | 92,124,057 | 0 |
| 2 | Cash | 19.38% | – | – | Cash | 23,106,886 | 23,106,886 | 0 |
| 3 | STATE ST INST US GOV | 3.34% | GVMXX | – | Money Market | 3,976,840 | 3,976,839 | 0 |
| 4 | CCA VINTAGE 2026 DEC26 | 0.00% | KBCZ26 | – | Future | 3,538 | 0 | 119,265,980 |
Holdings are subject to change.
Hyperlinks on this website are provided as a convenience and we disclaim any responsibility for information, services or products found on the websites linked hereto.
Click here to continueYou are now leaving KraneShares.com. Hyperlinks on these websites are provided as a convenience and we disclaim any responsibility for information, services or products found on the websites linked hereto.
For questions on how to invest in KraneShares ETFs, please refer to ETF Trading 101.