Krane Funds Advisors, LLC is the investment manager for KraneShares ETFs. KraneShares offers innovative investment solutions tailored to three key pillars: China, Climate, and Alternatives. Our team is determined to provide industry-leading, differentiated, and high-conviction investment strategies that offer access to key market trends. Our mission is to empower investors with the knowledge and tools necessary to capture the importance of these themes as an essential element of a well-designed investment portfolio.
Our semi-monthly topical research reports. Subscribe to our weekly mailing list for more.

August 25, 2025 – China Thematic Update: New IPOs (KSTR), Healthcare Momentum From Regulatory Reprieve & Innovation (KURE), New Hydroelectric Dam (KGRN),

August 21, 2025 – KraneShares Hedgeye ETF KSPY Celebrates 1-Year Track Record

August 7, 2025 – Labubus: How Pop Mart’s Newest Craze Reflects Chinese Cultural Influence in the U.S.

August 6, 2025 – How China’s EV Industry Is Shaping The Global Market: Insights From The Founder Of China’s Top EV Blog
Information about KraneShares ETFs, China's markets and culture, and general investing resources.
Our market update is a collaboration between the KraneShares internal research department, our local Chinese partners, and select China thought leaders from around the world. Our goal is to deliver a differentiated perspective on Chinese capital markets, business, government, and culture.
280 Park Avenue, 32nd Floor
New York, NY 10017
155 Sansome Street, Suite 400
San Francisco, CA 94104
181 Queen Victoria Street
London EC4V 4EG
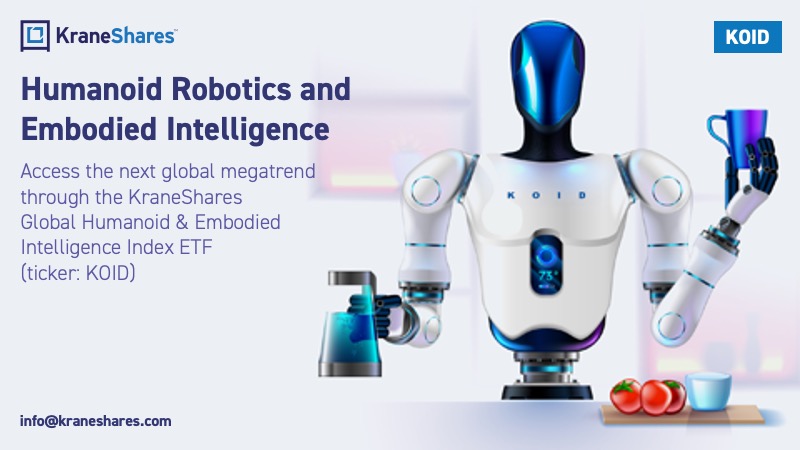
KOID seeks to track the MerQube Global Humanoid and Embodied Intelligence Index, which is designed to capture the performance of companies engaged in humanoid and embodied intelligence-related business. The underlying index focuses on key categories within the humanoid and embodied intelligence ecosystem, including the companies that design and manufacture humanoid robots and their supply chains that provide key components for humanoids and embodied intelligence.
1. Data from “Humanoids: 1bn Robots and $5tn Revenues by 2050, China is in Pole Position,” Morgan Stanley Research, as of 4/28/2025.
2. Data from “The global market for humanoid robots could reach $38 billion by 2035,” Goldman Sachs Research, as of 2/27/2024.
| Ticker | KOID |
| Primary Exchange | NASDAQ |
| CUSIP | 500767751 |
| ISIN | US5007677512 |
| Net Assets | $43,259,482 |
| Shares Outstanding | 1,475,002 |
| Total Annual Fund Operating Expense (Gross) | 0.79% |
| Total Annual Fund Operating Expense (Net) | 0.69%* |
| Inception Date | 6/4/2025 |
| Distribution Frequency | Annual |
| Daily Net Asset Value (NAV) and Market Price | |
| NAV | $29.33 |
| NAV Daily Change | 3.24% |
| Market Price | $29.61 |
| Market Price Daily Change | 3.53% |
| 30 Day Median Bid/Ask Spread |
0.33% |
| The ETF’s 30 Day Median Bid-Ask Spread is calculated by identifying the ETF’s national best bid and national best offer ("NBBO") as of the end of each 10 second interval during each trading day of the last 30 calendar days and dividing the difference between each such bid and offer by the midpoint of the NBBO. The median of those values is identified and that value is expressed as a percentage rounded to the nearest hundredth. | |
| NAV | Market Price | Premium/Discount |
| $29.33 | $29.61 | $0.28 |
| Q2 2025 | Q3 2025 | |
| Days traded at premium | 16 | 34 |
| Days traded at NAV | 0 | 0 |
| Days traded at discount | 1 | 4 |
The Premium/Discount History chart demonstrates the difference between the daily market price of shares of the Fund and the Fund’s net asset value (NAV). The vertical axis of the chart shows the premium or discount of the daily market price as a percentage of the NAV. The horizontal axis shows each trading day in the time period, and each data point in the chart represents the Premium/Discount on that day. The data presented in the chart and table above represent past performance and cannot be used to predict future results.
| Fund NAV | Closing Price | Underlying Index | |
| 1 Month | 3.71% | 2.72% | 3.50% |
| 3 Month | – | – | – |
| 6 Month | – | – | – |
| YTD | – | – | – |
| Since Inception | 7.32% | 7.24% | 7.24% |
| Fund NAV | Closing Price | Underlying Index | |
| Since Inception | 3.48% | 4.40% | 3.61% |
*Fee waivers are contractual and in effect until August 1, 2026
The performance data quoted represents past performance. Past performance does not guarantee future results. The investment return and principal value of an investment will fluctuate so that an investor's shares, when sold or redeemed, may be worth more or less than their original cost and current performance may be lower or higher than the performance quoted.
| 2025 Distributions and Calendar |
| Ex-Date | Record Date | Payable Date | Amount |
| 12/22/2025 | 12/22/2025 | 12/23/2025 |
Future calendar dates are subject to change. There is no guarantee that dividends will be paid. Past distributions are not indicative of future trends. This material is provided for educational purposes only and does not constitute investment advice.
Distributions are issued to brokers on the payable date, and are subject to broker payment schedules.
This video explores $AGIX's investment in @AnthropicAI and the broader themes of AI innovation, scalability, and safety, shaping the future of artificial intelligence. pic.twitter.com/99AXMgbbIE
— KraneShares (@KraneShares) July 25, 2025
We’re pleased to announce the launch of the Krane MSCI All Country Private Company Top 10 Series, a new fund providing investors access to a curated portfolio of leading venture-backed private companies. The fund tracks the MSCI All Country Venture-Backed Private Company Top 10… pic.twitter.com/i5L9gpSGMm
— KraneShares (@KraneShares) July 24, 2025


The Growth of $10,000 chart reflects an initial investment of $10,000 on the day prior to the selected time period and assumes reinvestment of dividends and capital gains. For the growth of $10,000 chart since inception, the initial investment of $10,000 is instead made on the inception date of the Fund. Fund expenses, including management fees and other expenses were deducted. The growth of a $10,000 investment in the fund is hypothetical and for illustration purposes only. Fund performance data used in this chart is based on Fund NAV and represents past performance. Past performance does not guarantee future results.
| Rank | Name | % of Net Assets | Ticker | Identifier | Shares Held | Market Value($) |
| 1 | CHINA NORTHERN-A | 3.50% | 600111 | CNE000000T18 | 238,100 | 1,591,993 |
| 2 | MP MATERIALS CORP | 3.38% | MP | US5533681012 | 22,656 | 1,537,889 |
| 3 | Lynas Rare Earths | 3.02% | LYC | AU000000LYC6 | 147,936 | 1,374,545 |
| 4 | NINGBO TUOPU G-A | 2.31% | 601689 | CNE1000023J3 | 127,900 | 1,048,675 |
| 5 | XPENG INC-A SHRS | 2.26% | 9868 | KYG982AW1003 | 87,400 | 1,027,933 |
| 6 | ROBOSENSE TECHNO | 2.26% | 2498 | KYG7611S1075 | 205,500 | 1,026,211 |
| 7 | LEADER HARMONI-A | 2.21% | 688017 | CNE1000043F9 | 48,129 | 1,006,746 |
| 8 | JIANGSU HENGLI-A | 2.15% | 601100 | CNE1000019R4 | 84,800 | 977,782 |
| 9 | SHANGHAI BEITE-A | 2.14% | 603009 | CNE100001TD7 | 145,500 | 974,470 |
| 10 | ESTUN AUTOMATION CO LTD-A | 2.14% | 002747 | CNE100001X35 | 288,900 | 972,876 |
Holdings are subject to change.
Hyperlinks on this website are provided as a convenience and we disclaim any responsibility for information, services or products found on the websites linked hereto.
Click here to continueYou are now leaving KraneShares.com. Hyperlinks on these websites are provided as a convenience and we disclaim any responsibility for information, services or products found on the websites linked hereto.
For questions on how to invest in KraneShares ETFs, please refer to ETF Trading 101.
This website uses cookies to help us enhance your browsing experience. By using this website you consent to our use of these cookies. You can customize your preferences by clicking “Cookie Preferences” below. To find out more about how we use cookies and how to manage them, please see our Terms & Conditions and Privacy Policy.