Are We Nearing Peak Volatility In EM & China?
By Anthony Sassine, CFA and Henry Greene

Executive Summary
- The global sell-off in equity and bond markets so far this year has left investors with precious few places to hide.
- US investors have enjoyed a decade-plus of ample liquidity, low inflation, and low rates. It seems that the US is moving into a new phase of economic dynamics, which may reflect poorly on the US market over the next five years. As a result, investors have been looking at emerging markets (EM) and China more to meet future return objectives.
- We seem to be nearing short-term peaks in inflation, rates, US dollar strength, China internet regulations, downward earnings revisions, and more. As a result, investors are starting to position themselves for the recovery, especially in EM and China given low positioning, growth potential, innovation, and low valuations.
- As we potentially reach peak risk-off, we believe investors should position themselves for the recovery by adding growth exposure in emerging markets (EM) while valuations are depressed.
Introduction
Global markets have been hit with everything but the kitchen sink in 2022. Wars, supply-side disruptions, inflation, rising rates, COVID-related lockdowns in some of the world's busiest port cities, a rising US dollar, and regulations have rattled global markets so far this year. Investors seem to be selling indiscriminately across asset classes as there have been very few places to hide so far in 2022. This market environment highlights the importance of owning low-correlated asset classes, such as China, and leaves investors searching for a peak in risks, which we believe could be coming sooner than many might think.
In April, the Fed raised interest rates by 50 bps. It was the most significant rate hike in 20 years and the central bank is expected to go ahead with six rate hikes in 2022. With the US nearing its stimulus peak, home bias investors are now wondering how they will meet their return objectives over the next 5 to 7 years in an environment where the Fed is in a long-term tightening mode amid slowing growth and enduring record-high valuations. Emerging markets (EM) and China seem to be best positioned to step in given their growth potential, innovation, low correlations, and low valuations.
We may be witnessing many "near-peaks" (on either side of the peak) for many of the risk factors affecting markets, including geopolitical risk, China regulations, US stimulus, earnings downward revisions, rising rates, inflation, and a stronger US dollar. As such, we believe now is a good time to start positioning for the recovery phase when all of this could be unwound.
Emerging Markets Consumer Technology Performance Review
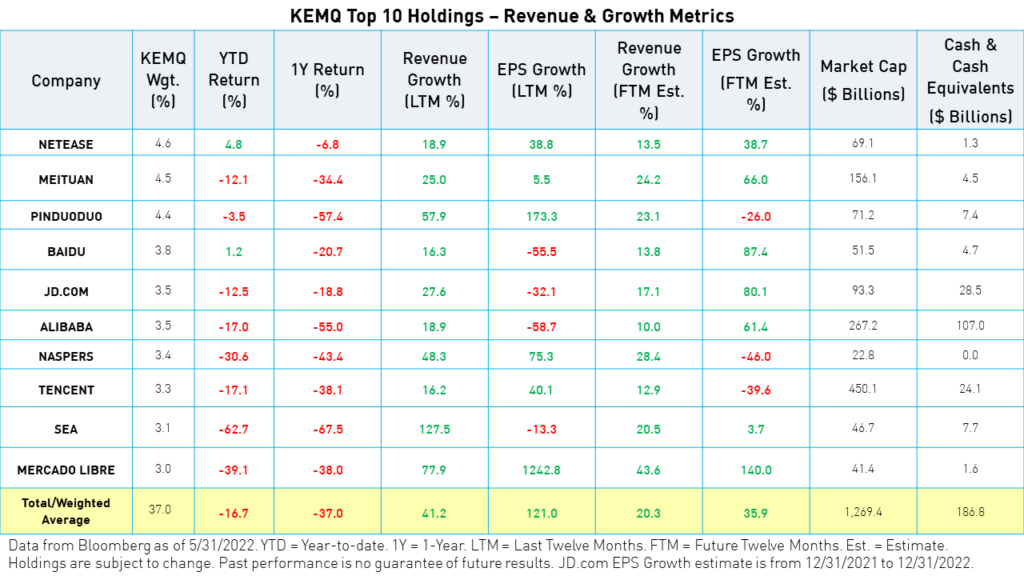
Consumer technology was one of the most hit areas in emerging markets in 2022. The rotation from growth to value, China lockdowns and regulations, tumbling Russian assets, consumer slowdowns, and higher interest rates in many key countries like Korea and Taiwan, have all led to a lackluster year so far for consumer technology and a major de-rating in stocks valuations.
The KraneShares Emerging Markets Consumer Technology ETF (KEMQ), which tracks the space, was down -31.27% year-to-date (YTD) as of June 3rd versus -13.06% for the MSCI Emerging Markets Index. The fund’s performance could have been worse were it not for the diversification* rules included in the ETF, which include a maximum country allocation of 40% (China is capped at 40%) and a maximum holding weight of 3.5%. On a country level, China was the worst performer in KEMQ, followed by South Korea and India. Malaysia and the United Arab Emirates declined the least YTD.
For KEMQ current standard performance, please click here.
The performance data quoted represents past performance. Past performance does not guarantee future results. The investment return and principal value of an investment will fluctuate such that an investor's shares, when sold or redeemed, may be worth more or less than their original cost, and current performance may be lower or higher than the performance quoted.
We believe the emerging markets consumer space may be down, but certainly not out. In our opinion, it is one of the investment opportunities in EM that would react most positively as negative clouds lift. The thesis for emerging markets, in general, has not changed, especially for consumer technology. We believe emerging markets consumer technology companies still represent a massive opportunity due to favorable demographics, low internet penetration, low E-Commerce penetration, increased technology adoption, and rising incomes. We believe the re-rating has been too severe, putting many high-quality and high-growth companies at a multi-year discount.

Emerging Markets Performance Review
The S&P 500, MSCI EAFE, and MSCI EM indices have moved nearly in lockstep with one another year to date, registering losses of upwards of 10%. It appears the only positive performance in EM was seen in non-Russia energy and commodity-related assets. Meanwhile, value stocks continued to outperform growth in EM, extending their record-breaking bout of outperformance versus growth stocks since 2021. The same market dynamics were also reflected on a country level, as a handful of energy and commodity-dependent economies such as Saudi Arabia and Brazil registered gains.

On a sector level, only utilities registered positive performance in the first quarter while the rest of the sectors declined. Meanwhile, value sectors outperformed growth sectors. The energy sector was down 20% as many Russian oil companies lost their entire market caps due to the closure of the Russian stock exchange to foreign investors and the removal of Russian stocks from most global exchanges. Excluding Russia, energy would have outperformed.

Global Outlook
On a global macroeconomic level, the three main drivers of risk are inflation, geopolitical tension, and COVID-related lockdowns in China. The war in Europe is feeding inflation through higher commodity prices and supply-side disruptions, making inflation more persistent than many would like to admit. Higher interest rates, on the other hand, are a symptom of inflation and are mainly responsible for the US dollar’s record levels. So, in many ways, inflation may dictate at least the near and far future. The latest US inflation print came in below expectations,2 indicating that we may have reached peak inflation.
The next couple of months will be important. If peak inflation is confirmed, the bond market may reprice interest rates and the number of future hikes very quickly. As a result, interest rates may stabilize and potentially decline before rising again, but in a measured way.
Meanwhile, political tensions are at levels previously thought improbable. The world and Europe cut ties with Russia despite the dependence on Russian gas. The oil price is currently hovering around $110 per barrel, down from its 120's peak earlier. More escalation could certainly occur as Finland and Sweden apply for NATO membership. But, how much worse can it get?


China Outlook
In China, the government is coming out with stimulus in full force to reverse the negative impact of COVID-related lockdowns in Shanghai, Beijing, and other cities. The recent politburo meeting, chaired by President Xi, confirmed China's GDP growth target of 5.5% for 2022. They also recommended more stimulus front loading through tax cuts, local bond issuance, and infrastructure projects. The language regarding rectifying the platform economy regulations, the resumption of normal supervisory roles, and the support for the property markets caught the markets’ attention. These recommendations came on the heels of a slew of stimulus moves since December of 2021, which included cuts to short and long-term rates as well as reserve requirement ratios (RRRs).
These policy moves started to show in economic data and the upswings in total social financing (TSF) and the credit impulse (nominal GDP growth minus credit growth), a proxy for future growth and market prices, were widely noticed.
Meanwhile, the rapid rise in rates in the US, surpassing China's 10-year rate for the first time in many years, has put pressure on the Chinese Yuan. The currency has adjusted from 6.3 to 6.8 per US dollar year-to-date. The government moved quickly to stabilize the currency by cutting the RRR on foreign currency accounts.
For corporates, earnings revisions are starting to rebound. Furthermore, the China Securities Regulatory Commission (CSRC) and the US Public Company Accounting Oversight Board (PCAOB) are making progress towards an audit deal for non-state-owned enterprises (SOEs), but the fate of SOEs listed in the US remains in question.
Many tailwinds for China equities are materializing, including the softening of the internet regulatory stance, a resolution to avoid the delisting of Chinese stocks from US exchanges, and the stimulus that China has been conducting since the beginning of the year.
Nonetheless, consumption remains weak. However, disposable income grew +9% in 2021.1 We believe we may see a repeat of the Chinese market rebound that followed the drop in 2020, which lasted for multiple quarters.

Emerging Asia Outlook
Lockdowns in China and supply-side disruptions put pressure on broader Asia markets and South Korea, a global trade bellwether. Korean stocks continued to be revised lower on news of lockdowns and slower trade.
Meanwhile, India fared better than most EM countries. However, high oil prices are expected to shave close to 1% off its GDP growth, and valuations are rich.
Taiwan is also dealing with a COVID breakout and higher inflation. The Central Bank of Taiwan expects to remain in a tightening mode for the coming months.
Conclusion
We believe the market may already be in oversold territory. Timing the market is difficult, but any signs of easing related to inflation, geopolitical risk, or COVID lockdowns could help trigger the long-awaited recovery.
Historically, recoveries have happened fast, leading investors to focus on fundamentals once again. Emerging markets and China are best positioned from valuation and growth perspectives. The US is expensive and may face slowing growth, especially when compared to last year’s high base, which China experienced in 2021.
While we believe investors should always be invested in EM and China as part of a global equity mandate, those who lack exposure or are underweight their China and EM exposure may find it rewarding first to start positioning for the recovery and second to invest in the long-term secular growth opportunities that are selling at a discount.
Please click here for more information on the KraneShares Emerging Markets Consumer Technology ETF (Ticker: KEMQ).
*Diversification does not ensure a profit or guarantee against a loss.
Citations:
- “Households’ Income and Consumption Expenditure in 2021,” National Bureau of Statistics of China. January 18, 2022.
- Smart, Tim. “Fed’s Favored Inflation Marker Rose 5.2%, Below Expectations,” U.S. News & World Report. April 29, 2022.
Definitions:
MSCI Emerging Markets (EM) Index: The MSCI Emerging Markets Index is a free-float weighted equity index that captures large and mid-cap representation across Emerging Market (EM) countries. The index covers approximately 85% of the free-float adjusted market capitalization in each country. The index was launched on January 1, 2001.
Dow Jones US Internet Index: The Dow Jones Internet Composite Index is designed to measure the performance of the 40 largest and most actively traded stocks of U.S. companies in the internet industry. To be eligible for the index, a company must derive at least 50% of cash flows from the internet. The index was launched on February 18, 1999.
S&P 500 Index: The S&P 500 Index is widely regarded as the best single gauge of large-cap U.S. equities. There is over USD 9.9 trillion indexed or benchmarked to the index, with indexed assets comprising approximately USD 3.4 trillion of this total. The index includes 500 leading companies and covers approximately 80% of available market capitalization. The index was launched on March 4, 1957.
MSCI EAFE Index (“EAFE”): The MSCI EAFE Index is an equity index, which captures large and mid-cap representation across Australia, Austria, Belgium, Denmark, Finland, France, Germany, Hong Kong, Ireland, Israel, Italy, Japan, the Netherlands, New Zealand, Norway, Portugal, Singapore, Spain, Sweden, Switzerland, and the UK. With 825 constituents, the index covers approximately 85% of the free float-adjusted market capitalization in each country. The index was launched on March 31, 1986.
MSCI All Country World Index (“ACWI”): The MSCI ACWI captures large and mid cap representation across 23 Developed Markets (DM) and 27 Emerging Markets (EM) countries*. With 2,978 constituents, the index covers approximately 85% of the global investable equity opportunity set. The index was launched on January 1, 2001.
MSCI Emerging Markets Value Index (“EM Value”): The MSCI Emerging Markets Value Index captures large and mid-cap securities exhibiting overall value style characteristics across 24 Emerging Markets (EM) countries*. The value investment style characteristics for index construction are defined using three variables: book value to price, 12-month forward earnings to price, and dividend yield. The index was launched on December 8, 1997.
MSCI Emerging Markets Value Index (“EM Growth”): The MSCI Emerging Markets Growth Index captures large and mid-cap securities exhibiting overall growth style characteristics across 24 Emerging Markets (EM) countries*. The growth investment style characteristics for index construction are defined using five variables: long-term forward EPS growth rate, short-term forward EPS growth rate, current internal growth rate, and long-term historical EPS growth trend, and long-term historical sales per share growth trend.
MSCI China All Shares Index: The MSCI China All Shares Index captures large and mid-cap representation across China A‐shares, B‐shares, H‐shares, Red‐chips, P‐ chips, and foreign listings (e.g. ADRs). The index aims to reflect the opportunity set of China share classes listed in Hong Kong, Shanghai, Shenzhen and outside of China. It is based on the concept of the integrated MSCI China equity universe with China A-shares included. The index was launched on June 26, 2014.
MSCI Emerging Markets ex China Index ("EM ex China"): The MSCI Emerging Markets ex China Index captures large and mid-cap representation across 26 of the 27 Emerging Markets (EM) countries excluding China. With 678 constituents, the index covers approximately 85% of the free float-adjusted market capitalization in each country. The index was launched on March 9, 2017.
MSCI China Index: The MSCI China Index captures large and mid-cap representation across China A shares, H shares, B shares, Red chips, P chips and foreign listings (e.g. ADRs). With 703 constituents, the index covers about 85% of this China equity universe. Currently, the index includes Large Cap A and Mid-Cap A-shares represented at 20% of their free float adjusted market capitalization. The index was launched on October 31, 1995.
MSCI China A Index ("China A"): The MSCI China A Index captures large and mid-cap representation across China securities listed on the Shanghai and Shenzhen exchanges. The index covers only those securities that are accessible through "Stock Connect". The index is designed for international investors and is calculated using China A Stock Connect listings based on the offshore RMB exchange rate (CNH). The index was launched on March 1, 2018.
MSCI Saudi Arabia Index ("Saudi Arabia"): The MSCI Saudi Arabia Index is designed to measure the performance of the large and mid-cap segments of the Saudi Arabia market. The index incorporates foreign ownership limit restrictions. With 35 constituents, the index covers approximately 85% of the free float-adjusted market capitalization in Saudi Arabia. The index was launched on October 3, 2014.
MSCI Brazil Index (“Brazil”): The MSCI Brazil Index is designed to measure the performance of the large and mid cap segments of the Brazilian market. With 49 constituents, the index covers about 85% of the Brazilian equity universe. The index was launched on January 1, 2001.
MSCI India Index (“India”): The MSCI India Index is designed to measure the performance of the large and mid cap segments of the Indian market. With 106 constituents, the index covers approximately 85% of the Indian equity universe. The index was launched on April 30, 1993.
MSCI Korea Index (“Korea”): The MSCI Korea Index is designed to measure the performance of the large and mid-cap segments of the South Korean market. With 111 constituents, the index covers about 85% of the Korean equity universe. The index was launched on March 31, 1989.
MSCI Taiwan Index (“Taiwan”): The MSCI Taiwan Index is designed to measure the performance of the large and mid-cap segments of the Taiwan market. With86 constituents, the index covers approximately 85% of the free float-adjusted market capitalization in Taiwan. The index was launched on July 31, 1989.
MSCI Russia Index (“Russia”): The MSCI Russia Index is designed to measure the performance of the large and mid-cap segments of the Russian market. With 10 constituents, the index covers approximately 85% of the free float-adjusted market capitalization in Russia. The index was launched on January 1, 2001.
Total Social Financing (TSF): Total social financing is a broad measure of credit and liquidity in the economy as it includes off-balance sheet forms of financing such as initial public offerings, loans from trust companies, and bond sales.
Price to Book Value (P/B): Price to book value is a commonly used metric to determine whether a company is over or under-valued. It is calculated by dividing the company’s stock price per share by its book value per share. An asset’s book value is equal to its carrying value on the balance sheet.
Price to Earnings Ratio (P/E): Price to earnings is a commonly used metric to determine whether a company is over or under-valued. It is calculated by dividing the company's stock price per share by its earnings per share (EPS).
Earnings per Share (EPS): Earnings per share is calculated as a company's profit divided by the outstanding shares of its common stock. The resulting number serves as an indicator of a company's profitability.
R_KS_SEI