EM Growth Revival Stalled by Supply-Side Shortages
By Anthony Sassine, CFA

Overview
Growth stocks showed signs of revival starting in mid-May of 2021, but the continuously expanding commodity shortages have stalled their progress. Energy shortages in Europe and China have led to a rally in energy prices and inflation fears. The 10-year US Treasury bond yield is at a fresh multi-month high as the Fed has indicated they will start tapering in 2021. Rising commodity prices are coinciding with global slowing growth due to many factors, including fresh COVID-19 outbreaks and lockdowns in East Asia. Stagflation has become a potential risk. The stage appears to be set for another period of a value-style bias. Nonetheless, the attractiveness of growth stocks' valuations should counterbalance commodity-facing emerging economies, especially in China.
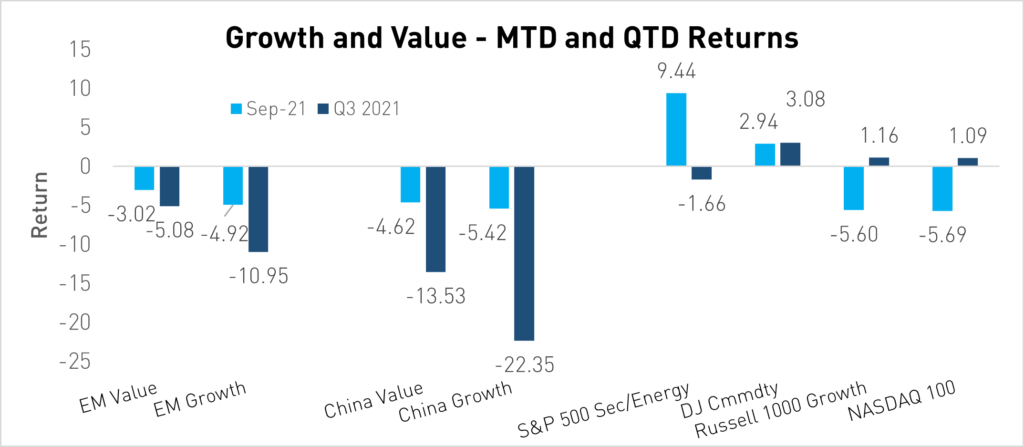
Source: Morningstar. Data as of 9/30/2021
Krane Emerging Markets Consumer Technology Review
The KraneShares Emerging Markets Consumer Technology Fund (KEMQ) was down 18.81% during the third quarter of 2021, underperforming MSCI EM, which declined 8.09% for the same period. Once again, KEMQ's diversification rules of maximum country allocation of 40% and maximum holding weight of 3.5% at rebalancing helped the Fund's performance. While we believe China is the most important global hub for consumer technology, the diversification rules allow significant exposures to other hubs in Korea, Taiwan, India, and Latin America.
(Diversification does not ensure a profit or guarantee against a loss.)
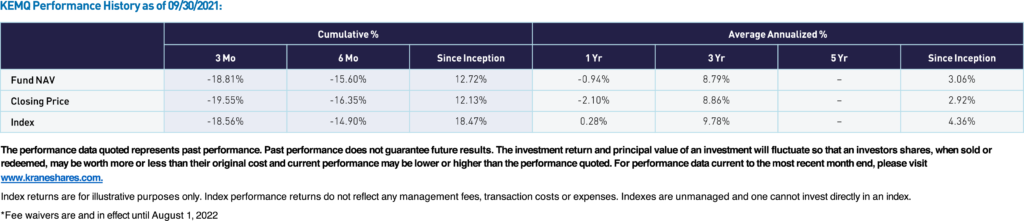
Inception Date: 10/11/2017; Total Annual Fund Operating Expense (Gross): 0.79%
The Fund's overweight position versus MSCI EM to China technology detracted mostly due to regulations. The Fund's underweight position in India also detracted. The Fund's technology exposures in Russia and Saudi Arabia contributed the most as these markets received a substantial boost from energy prices. On a sector level, the Fund's overweight positions in communication services and consumer discretionary detracted the most.
Source: Morningstar. Data as of 9/30/2021
Market Review
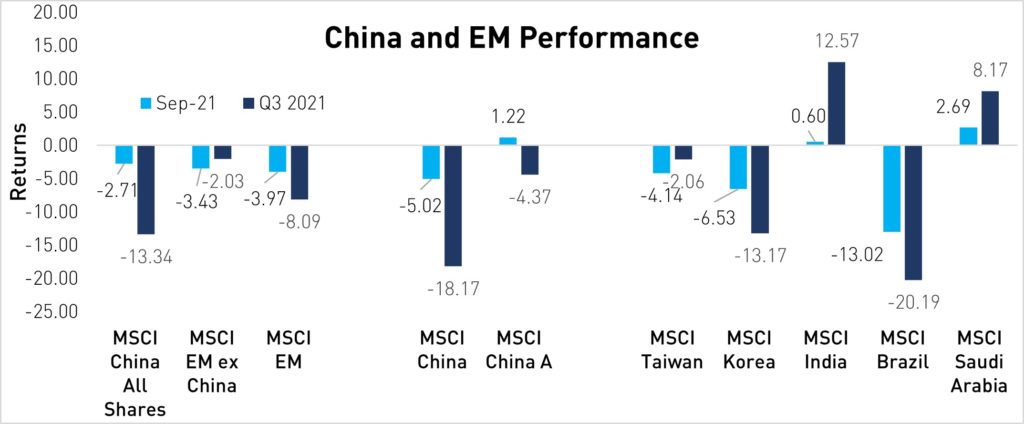
Q3 was a rocky quarter for China as the asset class underperformed Emerging Markets ex-China. China's A-shares market held up better than China's offshore market as it was removed from the impact of the regulatory noise. MSCI China All Shares Index ended the quarter down -13.34%1 versus -2.03%1 for emerging markets ex-China. MSCI China A edged MSCI China, returning -4.37%1 and -18.17%1, respectively. China growth underperformed China value for the third quarter in a row.
The slowdown of China's leading economic indicators2, especially in July and August, rattled markets. The slowdown was mainly due to sluggish consumer demand as COVID-19 lockdowns across multiple regions in China dampened economic activity. In September, China's largest developer, Evergrande, announced that it could not make its upcoming interest payment. The announcement led to a sharp slowdown in China's real estate market, which represents close to 30%2 of the economy when considering all the market's upstream and downstream consequences. Energy shortages began to spread in September, leading to energy rationing and, in some cases, production shutdowns within industries that require high energy consumption, such as steel, cement, and Aluminum. While the Consumer Price Index (CPI) in China remains close to 0.8%2, the Producer Price Index (PPI) is now in double digits2, a heavy burden on companies' finances.
On the positive side in China, there seems to be some light at the end of the tunnel regarding regulations. Many internet companies were declared compliant in Q3, and the rapid-fire policy approach we saw during the beginning of the summer seems to have slowed down. The Meituan fine was not too hefty and provided investors with closure. Data from the Ministry of Industry and Information Technology (MIIT)showed that internet companies saw that their profits accelerated at a faster pace during the first eight months of the year. Valuations in China look attractive, especially vis-à-vis the US.
India was a standout during the third quarter, returning +12.57%1, led by a rally in technology companies and banks. COVID-19 cases in the country continue to decline, and vaccination is on the rise. Inflation in India was also lower than expected. Also, Saudi Arabia and Russia fared well, helped by the rally in energy prices. Taiwan declined slightly, but Korea suffered as it witnessed its worst COVID-19 wave yet during the summer. Also, slowing growth globally signals that exports, Korea's leading contributor to GDP, will be slowing down and that the consumer will have to pick up the slack. Brazil was one of the worst performers in Q3 of 2021, driven by the collapse of Iron Ore prices and currency weakness.
Outlook
Investors have been dealing with a slew of global imbalances caused by a confluence of factors, including the pandemic. The low base effect from 2020 and the high bar set in 2021 will continue to impact growth targets. Pent-up demand from the pandemic, supply-side disruption, and decarbonization efforts have led to widespread supply-side shortages, impacting multiple industries. The reversal of loose monetary policy, especially in the US and EU, may begin in Q4 of 2021, sooner than many had anticipated. All this will continue to put upside pressure on inflation and rates and downside pressure on growth. We expect to see improvement in China concerning regulations and energy shortages. After all, next year is an important political year in which both the Beijing Olympics and the inauguration of the 14th National People's Congress will take place. Despite the weak GDP print recently, China's central bank now expects GDP to grow 8% this year, exceeding their previous growth target of 6%.3 China can deal with its issues but may save some of its ammunition for next year. The upside risk in inflation bodes well for commodity-facing countries in emerging markets ex-China. Despite all, emerging markets equities are currently offered at a steep discount to developed markets. Adjusting for quality, valuations are even more attractive in China's growth stocks. We believe China and emerging markets are essential elements of a global portfolio due to current valuations and growth potential.
For KEMQ's top 10 holdings please click [here].
Citations
1 Data from Morningstar
2 Data from Bloomberg
3 People’s Bank of China Press Release as of October 18, 2021.
The Solactive Emerging Markets Consumer Technology Index launched in April of 2017. The Solactive Emerging Markets Consumer Technology Index selects companies from 26 eligible countries within emerging markets whose primary business or businesses are internet retail, internet software/services, purchase, payment processing, or software for internet and E-Commerce transactions.
Index Definitions:
The MSCI China All Shares Index (referred to as China All-Shares herein): Inception date June 26, 2014, captures large and mid-cap representation across China A‐shares, B‐shares, H‐shares, Red‐chips, P‐ chips and foreign listings (e.g., ADRs). The index aims to reflect the opportunity set of China share classes listed in Hong Kong, Shanghai, Shenzhen, and outside of China.
The MSCI Emerging Markets ex-China Index (referred to as EM ex-China herein) Inception date is March 9, 2017, captures large and mid-cap representation across 25 of the 26 Emerging Markets (EM) countries* excluding China. With 702 constituents, the index covers approximately 85% of the free float-adjusted market capitalization in each country.
The MSCI Emerging Markets Index Net Return (referred to as MSCI EM index herein) defined as MSCI EM NR USD captures large and mid-cap representation across 23 Emerging Markets (EM) countries.
China's Equity (Stock) Market: For the purposes of this presentation, this refers to the superset of investments including the Mainland, Hong Kong, and overseas listed securities found in the MSCI China All Shares Index. Note that others may use a different definition and, as such, the data provided by other sources may not match ours as it may exclude shares listed in certain places.
MSCI China A Index (referred to as China A herein): Inception Date: November 25, 2008. The MSCI China A Index captures large and mid-cap representation across China securities listed on the Shanghai and Shenzhen exchanges. The index covers only those securities that are accessible through "Stock Connect". The index is designed for international investors and is calculated using China A Stock Connect listings based on the offshore RMB exchange rate (CNH).
MSCI Korea Index (referred to as Korea herein): Inception Date: March 31, 1989. The MSCI Korea Index is designed to measure the performance of the large and mid-cap segments of the South Korean market. The index covers about 85% of the Korean equity universe.
MSCI Taiwan Index (referred to as Taiwan herein): Inception Date: July 31, 1989. The MSCI Taiwan Index is designed to measure the performance of the large and mid-cap segments of the Taiwan market. The index covers about 85% of the free float-adjusted market capitalization in Taiwan.
MSCI India Index (referred to as India herein): Inception Date: April 30, 1993. The MSCI India Index is designed to measure the performance of the large and mid-cap segments of the Indian market. The index covers approximately 85% of the Indian equity universe.
MSCI Brazil Index (referred to as Brazil herein): Inception Date: January 01, 2001. The MSCI Brazil Index is designed to measure the performance of the large and mid-cap segments of the Brazilian market. The index covers about 85% of the Brazilian equity universe.
MSCI South Africa Index (referred to as South Africa herein): Inception Date: January 01, 2001. The MSCI South Africa Index is designed to measure the performance of the large and mid-cap segments of the South African market. The index covers approximately 85% of the free float-adjusted market capitalization in South Africa
MSCI EM Value Index: Inception Date: December 08, 1997, The MSCI Emerging Markets Value Index captures large and mid-cap securities exhibiting overall value style characteristics across 27 Emerging Markets (EM) countries*. The value investment style characteristics for index construction are defined using three variables: book value to price, 12-month forward earnings to price, and dividend yield.
MSCI EM Growth Index: Inception Date: December 08, 1997. The MSCI Emerging Markets Growth Index captures large and mid-cap securities exhibiting overall growth style characteristics across 27 Emerging Markets (EM) countries*. The growth investment style characteristics for index construction are defined using five variables: long-term forward EPS growth rate, short-term forward EPS growth rate, current internal growth rate, and long-term historical EPS growth trend, and long-term historical sales per share growth trend.
MSCI China Value Index Inception Date December 8, 1997. The index captures large and mid-cap Chinese securities exhibiting overall value style characteristics. The value investment style characteristics for index construction are defined using three variables: book value to price, 12-month forward earnings to price, and dividend yield.
MSCI China Growth Index Inception Date December 8, 1997. The index captures large and mid-cap securities exhibiting overall growth style characteristics across the Chinese equity markets. The growth investment style characteristics for index construction are defined using five variables: long-term forward EPS growth rate, short-term forward EPS growth rate, current internal growth rate, and long-term historical EPS growth trend, and long-term historical sales per share growth trend.
S&P 500 Communication Services Index Inception Date June 28, 1996. The index comprises those companies included in the SP 500 that are classified in the communication services sector.
S&P 500 Energy Index Date June 28, 1996. The index comprises those companies included in the SP 500 that are classified in the energy sector.
Russell 1000 Growth Index Inception Date January 1, 1987. The Russell 1000 Growth index measures the performance of the Russell 1000's growth segment, which is defined to include firms whose share prices have higher price-‐to-‐book ratios and higher expected earnings growth rates.
Nasdaq 100 Index Inception date is January 31, 1985. It is comprised of 100 of the largest domestic and international non-finance companies listed on the Nasdaq Stock Market based on market cap.
Dow Jones Commodity Index (DJCI) Inception year is 1998. The index is a weighted index that tracks a wide range of 28 different commodity futures contracts, including metals, agricultural products, and energy commodities such as oil and gas.
Purchasing Managers Index (PMI): The PMI is an index of the prevailing direction of economic trends in the manufacturing and service sectors.
Consumer Price Index (CPI): it is a measure of the average change over time in the prices paid by urban consumers for a market basket of consumer goods and services.
Producer Price Index (PPI): a group of indexes calculates and represents the average movement in selling prices from domestic production over time.
r-ks-sei