KraneShares China ETFs Top The Charts In 2020

New Product Launch
We are excited to announce the launch of the KraneShares SSE STAR Market 50 Index ETF
on the New York Stock Exchange.
Click here to read our press release
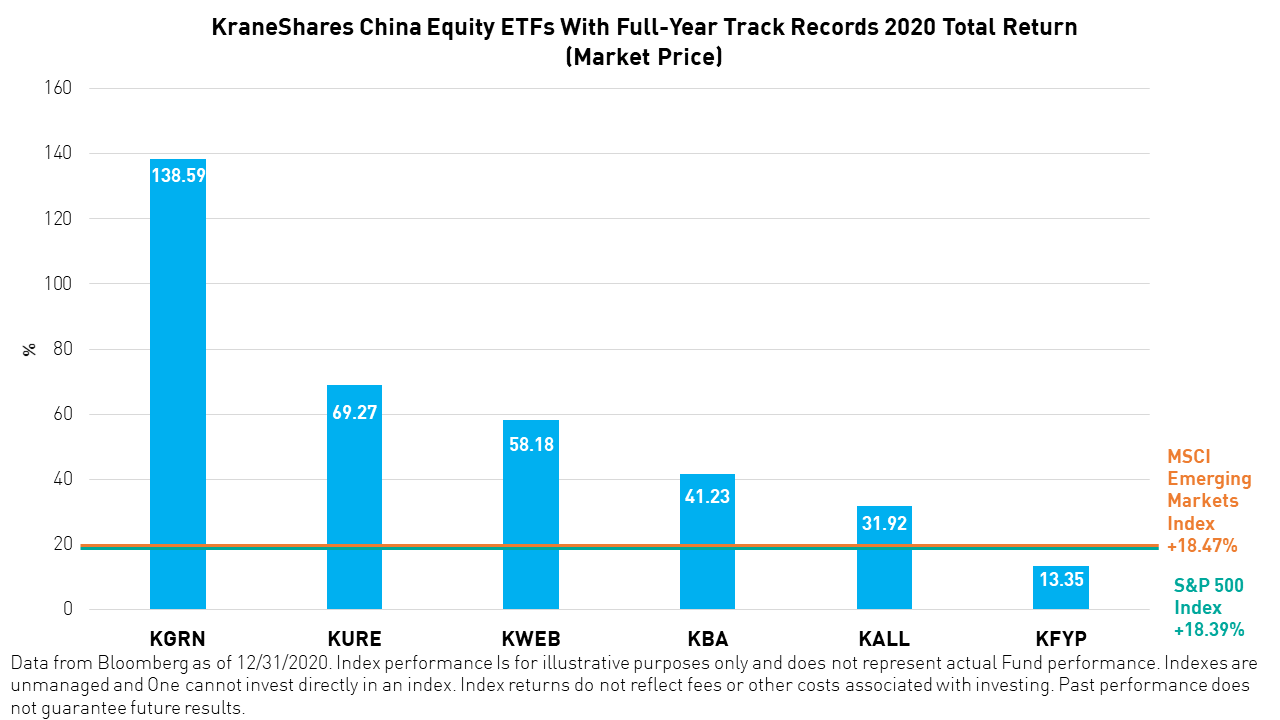
Investors Business Daily recently released a list of the top-performing foreign stock ETFs for 2020.1 Given all of the US-China tension and political rhetoric last year, some might be surprised to learn that four of our KraneShares China ETFs ranked in the top 10: KGRN (#1), KURE (#5), KWEB (#7), and KBA (#10).
In 2018, we released a whitepaper explaining our belief that China, due to its distinct risk and performance characteristics, is now an asset class in its own right. In the paper, we outlined our belief that investors who lump their China exposure in with the rest of emerging markets may be missing a significant opportunity. While 2020 was not a typical year by any measure, it proved our thesis better than any year since the release of that paper. In 2020, China's equity markets, as measured by our ETFs, widely outpaced broad emerging market equities.
While 2020 was far from an average year, we believe the underlying trends that support this type of performance began long before the Covid-19 pandemic. China's broad equity market, measured by the KALL ETF, outperformed the MSCI Emerging Markets Index in 2019 as well. As such, the pandemic only accelerated a long-term, secular trend: China's emergence as an asset class, distinct from emerging markets. As seen in the table below, China began to exhibit differentiated performance characteristics long before 2020.
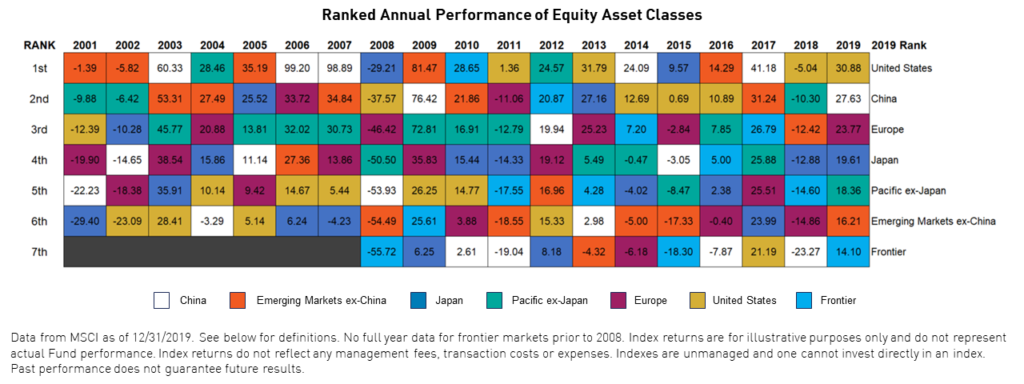
Furthermore, we believe China equities will continue to either outpace or, at least, differentiate themselves from "Emerging Markets." Thus, their treatment as a separate asset class may continue to benefit global investors.
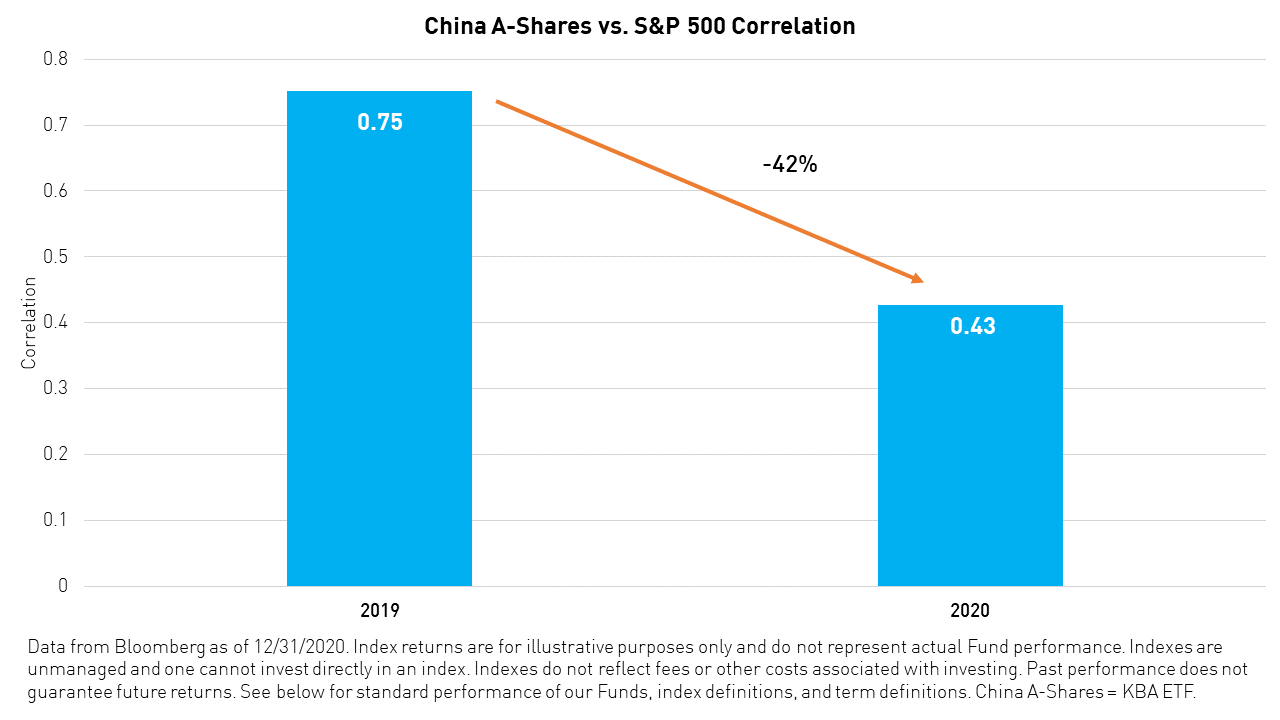
China's equity market returns are also increasingly diverging from equity returns in the US. This is evidenced by the -42% fall in the correlation between A-shares, as measured by the KBA ETF, and the S&P 500 Index from 2019 to 2020.
We believe that China's equity market may continue to outperform broad emerging market equities and further differentiate itself from both emerging and developed markets in 2021. Click here to view our 2021 China Outlook.
Index returns are for illustrative purposes only and do not represent actual Fund performance. Indexes are unmanaged and one cannot invest directly in an index. Indexes do not reflect fees or other costs associated with investing. Past performance does not guarantee future results.
Citation
- "Best Performing ETFs Of 2020," Investors Business Daily. January 11, 2021.
Term Definitions
China: From January 1, 2001 to May 9, 2005, this is represented by 31.15% the Shanghai Composite Index and 68.85% the MSCI China Index. From May 10, 2005 to November 1, 2008, this is represented by 31.15% the MSCI China A Onshore Index and 68.85% the MSCI China Index. From November 2, 2008 to June 25, 2014 this is represented by the MSCI China A Onshore Index, at a weighting equal to the percentage A-shares within the entire China investable equity market (month-to-month), and the MSCI China index for the remainder. From June 26, 2014 to the present, this is represented by the MSCI China All Shares Index.
Developed Markets: This is represented by the MSCI World Index.
Emerging Markets: This is represented by the MSCI Emerging Markets Index.
United States: This is represented by the MSCI USA USD Net Index.
Europe: This is represented by the MSCI Europe USD Net Index.
Japan: This is represented by the MSCI Japan USD Net Index.
Pacific Ex-Japan: This is represented by the MSCI Pacific Ex-Japan USD Net Index.
Emerging Markets ex-China: This is represented by the MSCI Emerging Markets Ex China Index back to 3/9/3017 and, prior to that, the return of the MSCI Emerging Markets Index less the MSCI China Index, calculated monthly using the month-end weight of China within the MSCI Emerging Markets Index.
Frontier Markets: This is represented by the MSCI Frontier Markets Index.
Index Definitions
MSCI Emerging Markets Index: The MSCI Emerging Markets Index is a free-float weighted equity index that captures large and mid cap representation across Emerging Market (EM) countries. The index covers approximately 85% of the free-float adjusted market capitalization in each country. The index was launched on January 1, 2001.
S&P 500 Index: The S&P 500 Index is widely regarded as the best single gauge of large-cap U.S. equities. There is over USD 9.9 trillion indexed or benchmarked to the index, with indexed assets comprising approximately USD 3.4 trillion of this total. The index includes 500 leading companies and covers approximately 80% of available market capitalization. The index was launched on March 4, 1957.
MSCI China All Shares Index: The MSCI China All Shares Index captures large and mid-cap representation across China A‐shares, B‐shares, H‐shares, Red‐chips, P‐ chips and foreign listings (e.g. ADRs). The index aims to reflect the opportunity set of China share classes listed in Hong Kong, Shanghai, Shenzhen and outside of China. It is based on the concept of the integrated MSCI China equity universe with China A-shares included. The index was launched on June 26, 2014.
MSCI World Index: The MSCI World Index captures large and mid cap representation across 23 Developed Markets (DM) countries. With 1,644 constituents, the index covers approximately 85% of the free float-adjusted market capitalization in each country.
MSCI China A Onshore Index: The MSCI China A Onshore Index captures large and mid cap representation across China securities listed on the Shanghai and Shenzhen exchanges. Inception date: May 10, 2005.
MSCI China Index: The MSCI China Index captures large and mid cap representation across China H shares, B shares, Red chips, P chips and foreign listings (e.g. ADRs). With 153 constituents, the index covers about 85% of this China equity universe. Inception date: Oct 31, 1995.
Shanghai Composite Index: is a stock market index of all stocks that are traded at the Shanghai Stock Exchange.
MSCI USA Index: The MSCI USA Index is designed to measure the performance of the large and mid cap segments of the US market. With 622 constituents, the index covers approximately 85% of the free float-adjusted market capitalization in the US.
MSCI Europe Index: The MSCI Europe Index captures large and mid cap representation across 15 Developed Markets (DM) countries in Europe. With 443 constituents, the index covers approximately 85% of the free float-adjusted market capitalization across the European Developed Markets equity universe.
MSCI Japan Index: the MSCI Japan Index is designed to measure the performance of the large and mid cap segments of the Japanese market. With 321 constituents, the index covers approximately 85% of the free float- adjusted market capitalization in Japan.
MSCI Pacific ex Japan Index: The MSCI Pacific ex Japan Index captures large and mid cap representation across 4 of 5 Developed Markets (DM) countries in the Pacific region (excluding Japan). With 148 constituents, the index covers approximately 85% of the free float-adjusted market capitalization in each country.
MSCI Emerging Markets Ex China Index: The MSCI Emerging Markets ex China Index captures large and mid cap representation across 23 of the 24 Emerging Markets (EM) countries* excluding China. With 692 constituents, the index covers approximately 85% of the free float-adjusted market capitalization in each country.
MSCI Frontier Markets Index: The MSCI Frontier Markets Index captures large and mid cap representation across 29 Frontier Markets (FM) countries. The index includes 109 constituents, covering about 85% of the free float- adjusted market capitalization in each country.