KMLM: Signal vs. Noise – Navigating Today’s Trend Following Landscape & Q2 Review
Ask any self-respecting trend follower what kind of market environment favors their strategy, and you'll get the usual suspects: volatility, uncertainty, macro and geopolitical stress, inflation, deflation, recession. But here’s the thing, those are just the conditions. The real driver? Signal versus noise. Signal results in directional change in financial markets, while noise results in directionless volatility. Trend needs signal.
In 2022, the signal was deafening: inflation fears, war in Ukraine, and ultimately, realized inflation, resulted in a sustained change in prices. Since 2023? More like a symphony of noise. Just look at U.S. rates: 10-year yields dipped below 3.5% in Apr ’23 on recession fears…then hit 5% by Oct ‘23 on “higher for longer” rate expectations. They slid below 4% in Jan ’24 (soft landing as inflation rates fell), bounced to 4.5% by Apr ‘24 (higher for longer again), dipped back under 4% in Sep ‘24 (as the Japanese Yen rapidly strengthened causing the global investment carry trade to unwind, spiking recession fears), then shot above 4.5% in Jan ’25 (pre-inauguration pro-growth Trump trade), and then…again dropped back under 4% in April (Department of Government Efficiency “DOGE”, tariffs, increased risk of recession).
Now? Sitting around 4.3%. Inflation somewhat contained, rate cuts priced back in, Powell in “wait and see” mode, Trump less patient. And the noise in rates has bled into currency markets, with the Dollar following the same range bound pattern. Gold, meanwhile, has thrived because all this noise has produced plenty of signal in that market as investors seek safety. The problem is it just isn’t a big enough position in a diversified trend following portfolio.
So, is trend following broken? Short answer: No. Long answer: systematic trend following (Managed Futures) exists to harvest the investor risk premium in the futures market by accepting price risk through time, producing a return distribution that typically has more small gains/losses that are below average, with less frequent, but much larger gains above the average (positive skew). This isn’t new.
What is key, however, is that transitions from noise to signal can't be timed. Which is why the system matters. Strip out human bias. Don’t let yesterday’s result taint tomorrow’s decision. It’s like flipping a coin, the last toss doesn’t affect the next, but over enough observations, the distribution is consistent. Asset allocators must religiously rebalance uncorrelated investments (yes…that means sell winners and buy losers).
Q2 Index and Sector Performance
The KFA MLM Index, which is tracked by the KraneShares Mount Lucas Managed Futures Index Strategy ETF (Ticker: KMLM), finished the quarter down 3.0%. Global Fixed Income (-2.0%), Commodity (-1.3%) and Currency (-0.7%) markets all detracted from results. Interest income added 105bps. For the twelve months ending June 2025, the Index was down 7.4%. Year to date, the Index is down 5.5%.
Q2 Index and Sector Exposures
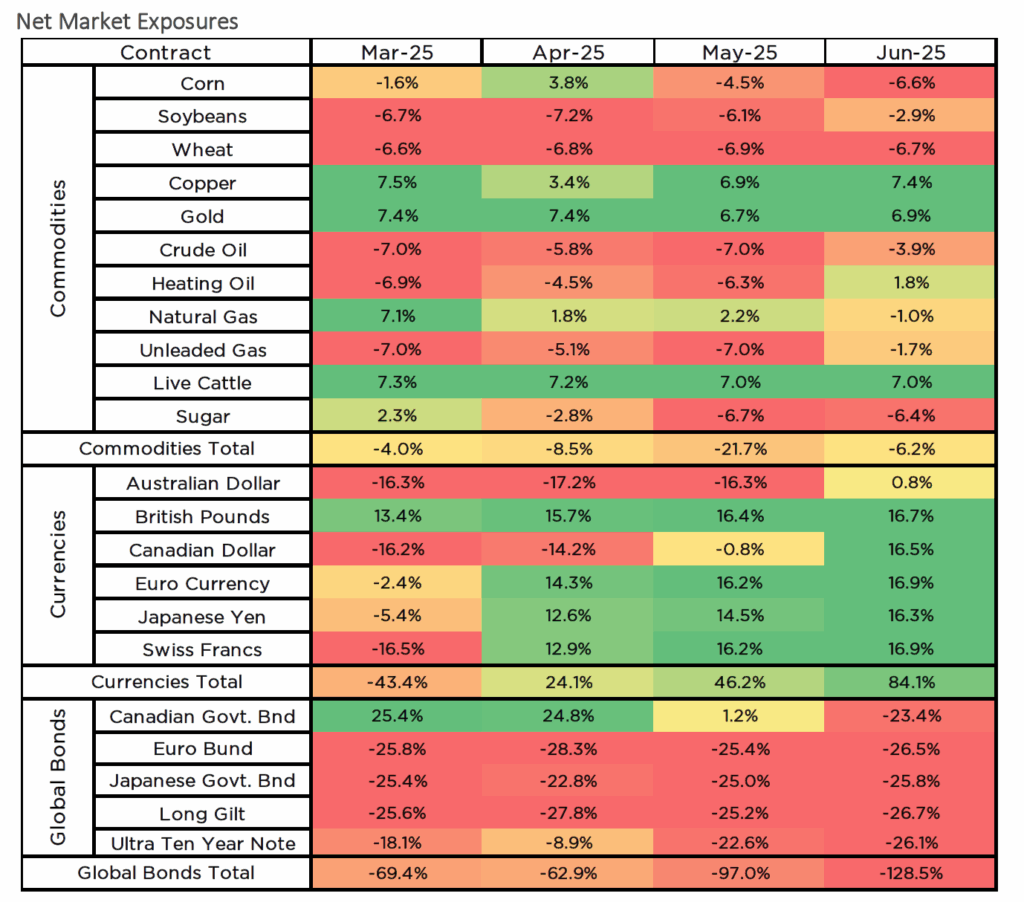
Over the course of the quarter Commodity exposures went from net short 4% to net short 6%, Currency exposures went from net short 43% to net long 84%, and Global Fixed Income exposures went from net short 69% to net short 128%.
Q2 Review
In the commodity sector, the top three contributors were Live Cattle, Sugar, and Wheat, while the bottom three detractors were Natural Gas, Heating Oil, and Copper. Grain markets saw relatively muted price action even as we entered the growing season. Corn staged a brief rally in early April, pulling the Index long, but subsequently sold off in early May, with prices continuing to decline through the end of the quarter. Soybeans and Wheat remained range-bound at low levels, holding short positions. In metals, Gold maintained its level near recent highs. Copper, on the other hand, experienced significant volatility around “Liberation Day,” with a dramatic sell-off that moved against the Index’s long position. Following the tariff pause, but with the threat of future tariffs still intact and incentivizing ongoing imports, Copper slowly rallied back near new highs by the end of June.
In the energy markets, tariffs again played a role by suppressing demand and driving prices sharply lower in April. When tensions in the Middle East escalated, energy prices spiked, only to fall again after the end of the “12-Day War.” By quarter-end, the Index had reduced short positions in Crude Oil and Unleaded Gas while initiating a small long in Heating Oil. Natural Gas continued to decline from its mid-March highs, hurting the long position and eventually shifting to a small short by the end of June. In agriculture, both the short in Sugar and the long in Live Cattle remained productive trends, delivering strong gains. Major shifts in exposure during the quarter included Copper (increased long), Corn (increased short), Crude Oil (reduced long), Heating Oil (from short to small long), Natural Gas (from long to small short), Soybeans (reduced short), Sugar (from small long to short), and Unleaded Gas (reduced short).
In the currency sector, the top contributors were the Euro Currency and British Pound, while the largest detractors were the Australian Dollar, Canadian Dollar, and Japanese Yen. Starting positions and the speed of trend alignment were key performance drivers. Markets that either began with or transitioned quickly into long positions, like the Euro and Pound, produced solid gains. However, these were partially offset by losses in the Australian Dollar, Canadian Dollar, Japanese Yen, and Swiss Franc, all of which began with short positions and failed to flip long quickly enough. By the end of June, all major currencies had transitioned to long positions. Notable exposure shifts during the quarter occurred in the Australian Dollar (from short to small long), Canadian Dollar (from short to long), Euro (from small short to long), Japanese Yen (from small short to long), and Swiss Franc (from short to long).
In the global fixed income sector, the primary detractors were Canadian Government Bonds (CGB), UK Long Gilts, and the U.S. Ultra Ten-Year (TY). In the U.S., rates struggled to find direction amidst inflation concerns from tariffs, recession fears, war-driven safe haven demand, deficit anxieties, and uncertainty surrounding President Trump and Fed Chair Powell. Globally, rates traded mostly sideways and within ranges for much of the quarter, modestly working against index positions. Major shifts in exposure included the CGB (from long to short) and TY (increased short).
Net Market Exposures
Holdings are subject to change.
Diversification does not ensure a profit or guarantee against a loss.
For KMLM standard performance, top 10 holdings, risks, and other fund information, please click here.
Index returns are for illustrative purposes only and do not represent actual Fund performance. Index returns do not reflect management fees, transaction costs, or expenses. Indexes are unmanaged, and one cannot invest directly in an index. Past performance does not guarantee future results.
Term Definitions:
BPS: basis points, a unit equal to 0.01% used to measure changes in interest rates or other financial percentages.
Liberation Day: a holiday that celebrates the freeing of a country or people from occupation, oppression, or colonization.
Net Long/Short Exposure: A futures contract is an agreement to buy (long) or sell (short) an asset at a predetermined price at a specified future date. The exposure is calculated by the position size (negative if short) times the value of one contract.