KMLM: Adaptive Shifts Amid Currency and Commodity Volatility
Index and Sector Performance
The KFA MLM Index, which is tracked by the Mount Lucas Managed Futures Index Strategy ETF (Ticker: KMLM), finished the quarter down 2.6%. Global Fixed Income (+0.2%) markets contributed to performance while Currency (-2.5%) and Commodity (-1.3%) markets detracted from results. Interest income added 1.03%. For the twelve months ending March 2025, the Index was down 6.8%. Year to date, the Index is down 2.6%.
Index and Sector Exposures
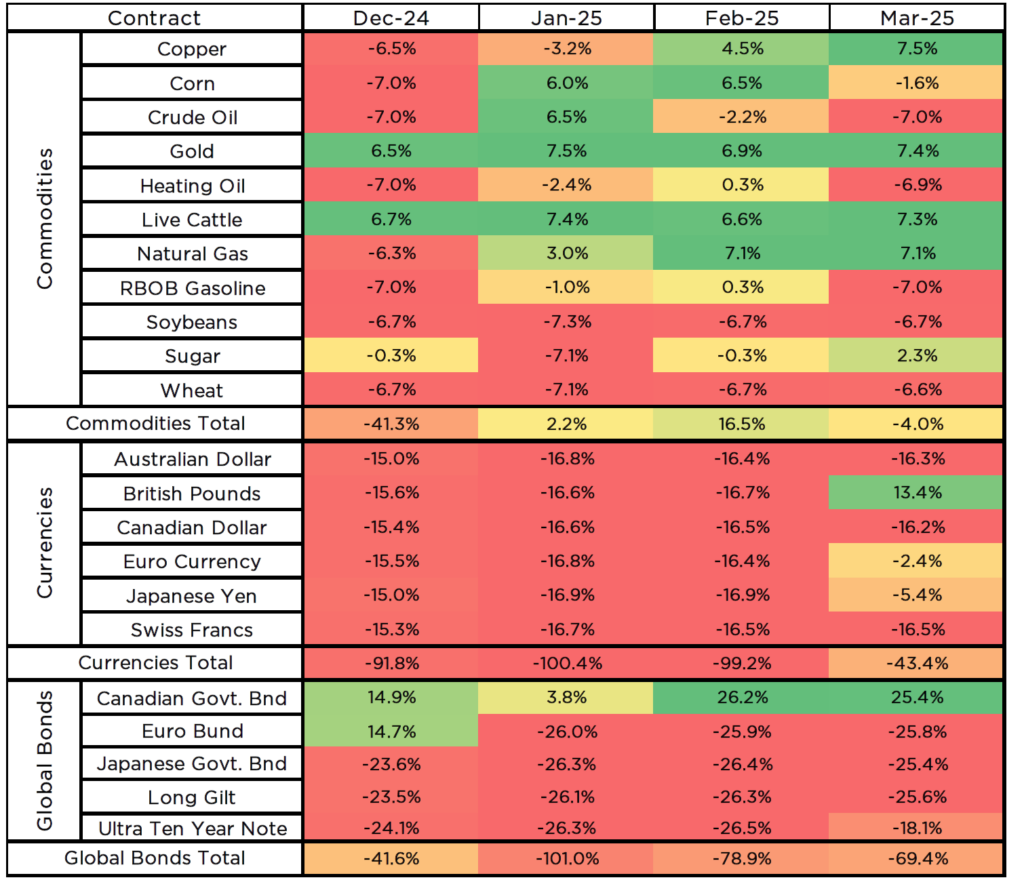
Over the course of the quarter, Commodity exposures went from net short 41% to net short 4%, Currency exposures went from net short 92% to net short 43%, and Global Fixed Income exposures went from net short 42% to net short 69%.
Outlook
Much has changed in the market since the turn of the new year. Post-election, the market priced in what it believed to be a growth-oriented administration. Equity markets finished near highs, the Dollar strengthened, and bond markets declined as previously priced rate cuts were unwound. Post-inauguration has been a different story, with the market no longer just pricing in the positive effects of a growth-oriented Trump administration but starting to come to terms with the negative shocks of DOGE and tariff saber rattling.
At first, markets did their best, trying to forecast potential scenarios and assign outcomes based on zero-sum scenarios. US equities fell, European equities rallied. U.S. bonds rose in price, European Bonds fell. The US was fiscally retreating, with Europe and China fiscally expanding. The Dollar fell while other currencies rallied. As we write these notes, the market has shifted from pricing zero-sum outcomes to all negative outcomes after Liberation Day. Reversal risk via tweet abounds.
Managed Futures strategies historically have provided diversification in times of market stress, but to date, have only sidestepped the worst of it. Strategies with allocations to equities have fared worse. Uncorrelated, yes, but just not getting the negative correlation as markets (particularly bonds and currencies) have whipsawed over the last few months. Those negative correlations typically come with sustained price moves as markets move to new levels to reflect changing economic realities and the day-to-day noise subsides.
In the Commodity sector, the top three contributors were Gold, Natural Gas, and Live Cattle, while the bottom three detractors were Crude Oil, Heating Oil, and Unleaded Gas. In the grain markets, prices rallied in February, but by the end of March had given up that gain and ended flat or lower. Wheat and Soybeans held their short positions for small gains, but Corn got long in February, only to unwind that position and start building a short at the end of the quarter for a loss. In metals, Gold and Copper rallied sharply through the quarter. Gold entered long and profited nicely, while Copper started short and picked up the long mid-quarter for a small loss. In the energy sector, a pre-inauguration rally in Crude Oil, Heating Oil, and Unleaded Gas prices dragged the Index into long positions, only for prices to reverse sharply into quarter-end. Natural Gas continued higher, getting long early and contributing positively to results. In agriculture, Sugar started the year lower, then rallied higher and went through multiple price swings, ending the quarter with a long position. Live Cattle started the year long and followed prices higher for a nice gain. Major shifts in exposure during the quarter included Copper (short to long), Corn (short to long to small short), Natural Gas (short to long), Sugar (small short to small long).
In the Currency sector, the top detractors were the Japanese Yen, Euro Currency, and British Pound, with only the Canadian Dollar eking out a small gain. At the start of the year, short-term positions in currencies reflected the recent strength in the Dollar. Ultimately, the reversal in the Dollar (weakening) led to reversals in major currencies and made it a difficult quarter for the sector. The major shifts in exposure during the quarter came in British Pounds (short to long), Euro Currency (decreased short), and Japanese Yen (decreased short).
In the Global Fixed Income sector, the top contributors were the Japanese Government Bond (JGB), Euro Bund, and UK Long Gilt. The primary detractor was the US Ultra Ten Year (TY). As the market assigned winners and losers to potential tariff threats, US bonds rallied, hurting short positions, while European and Japanese bonds continued lower, benefiting short positions. The major shifts in exposure during the quarter came in the Canadian Government Bonds (increased long), Euro Bund (long to short), and Ultra Ten Year Note (reduced short).
Net Market Exposures
Holdings are subject to change.
For KMLM standard performance, top 10 holdings, risks, and other fund information, please click here.
Index returns are for illustrative purposes only and do not represent actual Fund performance. Index returns do not reflect management fees, transaction costs, or expenses. Indexes are unmanaged, and one cannot invest directly in an index. Past performance does not guarantee future results.