Krane Funds Advisors, LLC is the investment manager for KraneShares ETFs. KraneShares offers innovative investment solutions tailored to three key pillars: China, Climate, and Alternatives. Our team is determined to provide industry-leading, differentiated, and high-conviction investment strategies that offer access to key market trends. Our mission is to empower investors with the knowledge and tools necessary to capture the importance of these themes as an essential element of a well-designed investment portfolio.
September 11, 2025 – Meet KOID: Derek Yan’s ETF That Offers Exposure to the Robotics and AI Sector
September 8, 2025 – Yan: Palantir has the potential to become the operating system for AI

September 8, 2025 – China’s New Economy Offers Great Equity Opportunity: China Today

August 26, 2025 – Global Compliance Carbon Markets: Structure Explained
Our semi-monthly topical research reports. Subscribe to our weekly mailing list for more.

September 8, 2025 – Beyond The Big Names – Four KOID Holdings Building The Next-Gen Humanoid Body
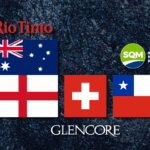
September 5, 2025 – Are Commodity Executives The Best China Economists?

August 25, 2025 – China Thematic Update: New IPOs (KSTR), Healthcare Momentum From Regulatory Reprieve & Innovation (KURE), New Hydroelectric Dam (KGRN)

August 21, 2025 – KraneShares Hedgeye ETF KSPY Celebrates 1-Year Track Record
Information about KraneShares ETFs, China's markets and culture, and general investing resources.
Our market update is a collaboration between the KraneShares internal research department, our local Chinese partners, and select China thought leaders from around the world. Our goal is to deliver a differentiated perspective on Chinese capital markets, business, government, and culture.
280 Park Avenue, 32nd Floor
New York, NY 10017
155 Sansome Street, Suite 400
San Francisco, CA 94104
181 Queen Victoria Street
London EC4V 4EG
KBUY seeks to measure the performance of the CICC China Consumer Leaders Index. The index consists of the investable universe of publicly traded China-based companies whose primary business or businesses are in the consumption-related industries such as home appliance, food & beverage, apparel & clothing, hotels, restaurants, and duty-free goods.
1. National Bureau of Statistics in China, “Total Retail Sales of Consumer Goods Went up by 8.0 percent in 2019” 1/19/2020. Note: Figures converted from Chinese Renminbi to USD as of 4/14/2020.
2. U.S. Department of Commerce, “Quarterly Retail E-commerce Sales 4th Quarter 2019” 2/19/2020.
3. Institutional Investor, “The All-China Research Team”, 2019.
| Ticker | KBUY |
| Primary Exchange | NYSE |
| CUSIP | 500767595 |
| ISIN | US5007675953 |
| Net Assets | $4,416,712 |
| Shares Outstanding | 300,002 |
| Total Annual Fund Operating Expense | 0.69% |
| Inception Date | 12/9/2020 |
| Distribution Frequency | Annual |
| Daily Net Asset Value (NAV) and Market Price | |
| NAV | $14.72 |
| NAV Daily Change | 0.00% |
| Market Price | $14.73 |
| Market Price Daily Change | 0.48% |
| 30 Day Median Bid/Ask Spread |
0.88% |
| The ETF’s 30 Day Median Bid-Ask Spread is calculated by identifying the ETF’s national best bid and national best offer ("NBBO") as of the end of each 10 second interval during each trading day of the last 30 calendar days and dividing the difference between each such bid and offer by the midpoint of the NBBO. The median of those values is identified and that value is expressed as a percentage rounded to the nearest hundredth. | |
| NAV | Market Price | Premium/Discount |
| $14.72 | $14.73 | $0.00 |
| Q1 2024 | |
| Days traded at premium | 7 |
| Days traded at NAV | 0 |
| Days traded at discount | 44 |
The Premium/Discount History chart demonstrates the difference between the daily market price of shares of the Fund and the Fund’s net asset value (NAV). The vertical axis of the chart shows the premium or discount of the daily market price as a percentage of the NAV. The horizontal axis shows each trading day in the time period, and each data point in the chart represents the Premium/Discount on that day. The data presented in the chart and table above represent past performance and cannot be used to predict future results.
| Fund NAV | Closing Price | Underlying Index | |
| 1 Month | 11.14% | 10.38% | 11.44% |
| 3 Month | -2.30% | -3.04% | -1.97% |
| 6 Month | -10.60% | -11.68% | -9.94% |
| YTD | 1.71% | 1.10% | 1.70% |
| Since Inception | -38.47% | -39.24% | -36.29% |
| Fund NAV | Closing Price | Underlying Index | |
| 1 Year | -24.01% | -24.78% | -23.36% |
| 3 Year | -17.23% | -17.72% | -16.35% |
| Since Inception | -13.96% | -14.29% | -13.02% |
| Fund NAV | Closing Price | Underlying Index | |
| 1 Year | -22.12% | -21.95% | -21.03% |
| 3 Year | -17.55% | -17.73% | -16.48% |
| Since Inception | -15.12% | -15.30% | -14.15% |
The performance data quoted represents past performance. Past performance does not guarantee future results. The investment return and principal value of an investment will fluctuate so that an investor's shares, when sold or redeemed, may be worth more or less than their original cost and current performance may be lower or higher than the performance quoted.
| 2025 Distributions and Calendar |
| Ex-Date | Record Date | Payable Date | Amount |
| 12/22/2025 | 12/22/2025 | 12/23/2025 |
Future calendar dates are subject to change. There is no guarantee that dividends will be paid. Past distributions are not indicative of future trends. This material is provided for educational purposes only and does not constitute investment advice.
Distributions are issued to brokers on the payable date, and are subject to broker payment schedules.
| 2024 Distributions |
| Ex-Date | Record Date | Payable Date | Amount |
| 03/22/2024 | 03/25/2024 | 03/25/2024 | 0.014000 |
| 2023 Distributions |
| Ex-Date | Record Date | Payable Date | Amount |
| 12/18/2023 | 12/19/2023 | 12/20/2023 | 0.277115 |
| 2022 Distributions |
| Ex-Date | Record Date | Payable Date | Amount |
| 12/28/2022 | 12/29/2022 | 12/30/2022 | 0.196441 |
| 2021 Distributions |
| Ex-Date | Record Date | Payable Date | Amount |
| 12/29/2021 | 12/30/2021 | 12/31/2021 | 0.116238 |
In a world built for humans, humanoid robots are designed to plug right into existing infrastructure. In a recent webinar, KraneShares CIO @ahern_brendan, Senior Investment Strategist Derek Yan, CFA, and Robostore Founder Teddy Haggerty explored why they believe this simple fact… pic.twitter.com/KkjlTbUFVC
— KraneShares (@KraneShares) September 3, 2025
According to @Reuters, private AI company @AnthropicAI has completed a new funding round at a valuation of $183 billion, nearly tripling its previous valuation. Get exposure to Anthropic with the KraneShares Artificial Intelligence & Technology ETF (Ticker: $AGIX).
— KraneShares (@KraneShares) September 5, 2025
AGIX:… pic.twitter.com/y7YWAXCAgT
The Growth of $10,000 chart reflects an initial investment of $10,000 on the day prior to the selected time period and assumes reinvestment of dividends and capital gains. For the growth of $10,000 chart since inception, the initial investment of $10,000 is instead made on the inception date of the Fund. Fund expenses, including management fees and other expenses were deducted. The growth of a $10,000 investment in the fund is hypothetical and for illustration purposes only. Fund performance data used in this chart is based on Fund NAV and represents past performance. Past performance does not guarantee future results.
| Rank | Name | % of Net Assets | Ticker | Identifier | Shares Held | Market Value($) |
| 1 | Cash | 100.00% | – | – | 4,416,701 | 4,416,701 |
| 2 | HONG KONG DOLLAR | 0.00% | – | – | 78 | 10 |
| 3 | FOSHAN HAITIAN-A | 0.00% | 603288 | CNE100001SL2 | 0 | 1 |
Holdings are subject to change.
Hyperlinks on this website are provided as a convenience and we disclaim any responsibility for information, services or products found on the websites linked hereto.
Click here to continueYou are now leaving KraneShares.com. Hyperlinks on these websites are provided as a convenience and we disclaim any responsibility for information, services or products found on the websites linked hereto.
For questions on how to invest in KraneShares ETFs, please refer to ETF Trading 101.
This website uses cookies to help us enhance your browsing experience. By using this website you consent to our use of these cookies. You can customize your preferences by clicking “Cookie Preferences” below. To find out more about how we use cookies and how to manage them, please see our Terms & Conditions and Privacy Policy.
Closure Announcement: Upon the recommendation of Krane Funds Advisors, LLC, the adviser to KraneShares CICC China Consumer Leaders Index ETF (KBUY), the Board of Trustees of KraneShares Trust has approved the liquidation and termination of KBUY. Accordingly, shares of KBUY will cease trading on the NYSE (“Exchange”), and will be closed to purchase by investors as of the close of regular trading on the Exchange on March 14, 2024 (“Closing Date”). Shareholders may sell their holdings in the Fund prior to the Closing Date. The Fund will not accept purchase orders after the Closing Date. From the Closing Date through March 25, 2024 (“Liquidation Date”), shareholders may only be able to sell their shares to certain broker-dealers. There is no assurance that there will be a market for the Fund’s shares during this period. Read More.