Five Misconceptions About China’s Markets
July 28, 2015 – Reporting developments in China’s markets to an international audience can be a challenging task. Not only are there language and time zone barriers to consider but also nuanced regulatory and cultural differences that require interpretation. During times of volatility in the onshore markets, events can develop rapidly and reporting on the markets has to come out equally as fast. The volatility in the onshore markets has proliferated a few misconceptions in the media about China’s markets that we believe necessitate further clarification.
Misconception 1: The average stock in China has a Price to Earnings (P/E)1 ratio of 90
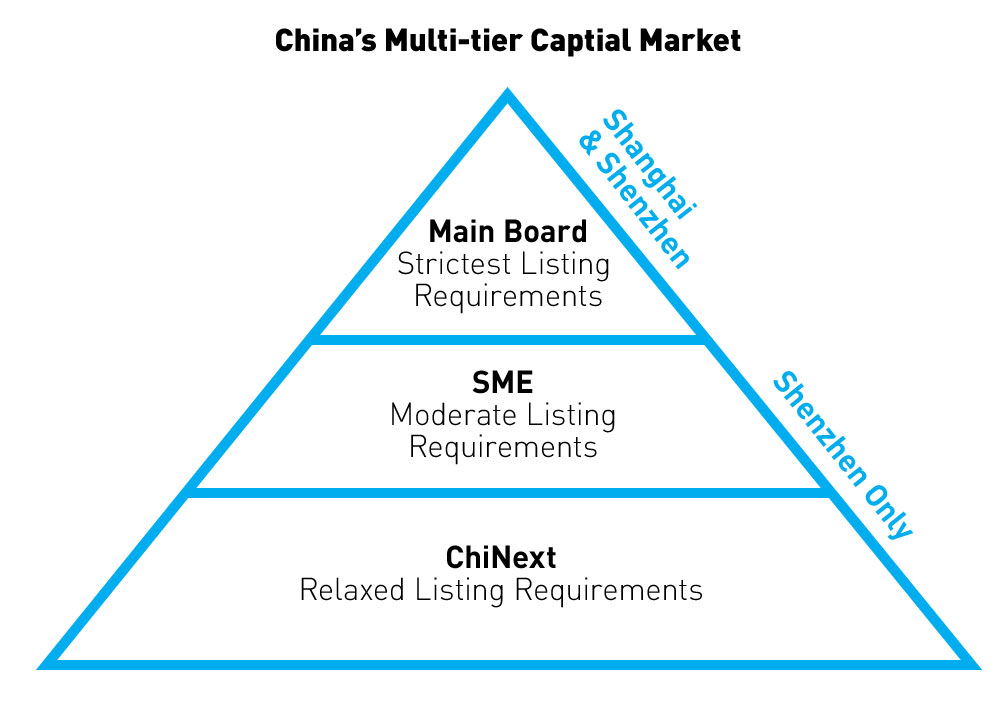
In order to dispel the common misconception that all onshore Chinese stocks are overvalued, it is helpful to provide some background information on how the Shanghai and Shenzhen Stock Exchanges are structured. China’s exchanges are organized into a multi-tier system that categorizes listed companies based on specific qualifications. Each tier is designed for enterprises at different stages of growth and offers potential investors different quality and risk profiles.

The top tier is the Main Board of the Shanghai and Shenzhen stock exchanges, which are comprised of large cap stocks that are predominantly state owned enterprises. This is the strictest tier and there are a number of requirements a company must fulfill in order to qualify for the Main Board. One strict requirement is that a company must be profitable for at least three years before listing there.
The next tier is the Small Medium Enterprise (SME), which is limited to only the Shenzhen stock exchange. SME companies are relatively mature in their development and have stable business models, though they do not need to demonstrate three years of prior profitability. The SME tier is primarily composed of manufacturing companies.
The bottom tier is the ChiNext. Like SME, ChiNext is limited to the Shenzhen stock exchange. ChiNext was created to help encourage entrepreneurship, inspire creativity, and popularize innovative business models. The financial requirements to list on ChiNext are relaxed compared to the other two boards.
We can trace the origin of the misconception of overvaluation to the ChiNext board. Today on average the ChiNext has the highest P/E, the highest number of halted or suspended securities, and also the lowest market cap compared to the other tiers2. ChiNext stocks currently have a P/E of 813 versus their five-year average of 58.94, though this is down from their June 12th high of 128.45. Many have used the high valuations in the ChiNext tier as a proxy for the entire Chinese market.
Our fund, the KraneShares Bosera MSCI China A ETF (ticker : KBA) tracks the MSCI China A International Index. This index has 370 constituents and a free float market cap of $900 million6. Our index constituents are primarily large and mid cap Main Board stocks. KBA’s index currently has a P/E of 187, far lower than the average ChiNext P/E of 81.
Misconception 2: The Chinese stock market has stopped trading
There are many regulatory differences between the U.S. and Chinese markets. One difference in China that seems particularly striking to U.S. investors is the ability of Chinese companies to halt or suspend trading. This rule was established in order to prevent insider trading. Whenever a Chinese company has non-public information being released the stock is halted or suspended until that information is disseminated. This can be due to a merger, acquisition, or outside investment by the company. Additionally, if a company trades up or down 10% in one day, the company is suspended from trading for that day.
At the height of the pullback on July 9th, 1442 stocks were halted8, which is a little over half the total number of listed stocks9. The number of halted stocks was featured in most news reports, even though this numerical approach is not a comprehensive measure of the market. We believe a better approach is to look at halted securities by market cap. The stocks that stopped trading never exceeded 30% of the onshore market cap.
Currently, 90%10 of the total 6.83 trillion USD market cap11 in the onshore stock markets is trading. Temporary halts and suspensions make up the remaining 10%12. Claims that China’s stock market has stopped trading disproportionately weigh small cap and ChiNext stocks while failing to consider the importance of large cap stocks in the onshore markets.
During the pullback, the extensive use of margin by Chinese investors was underestimated due to the prevailing use of over-the-counter (OTC) margin. OTC margin is money leant by non-brokerage firms outside of the regulated markets that allowed investors to exceed brokerage margin amounts by upwards of three to five times the money deposited. The extent of the proliferation of OTC margin caught China’s regulators by surprise. In order to eliminate OTC margin without causing a panic, China’s main regulator, the China Securities Regulatory Commission, allowed companies to voluntarily invoke the very common practice of halting or suspending trading to prevent further damage.
Misconception 3: The stock market will derail the Chinese economy
Unlike in the United States, exposure to the stock market in China on a household basis is relatively low. This month Chinese brokerage firm China International Capital Corporation (CICC) issued a report on household finances in China. CICC estimated Chinese households held $8.65 trillion of household deposits, $6.46 trillion of non-equity non-property assets, and a mere $3.59 trillion of stock market investments14. Moreover, according to China economic research firm PRC Macro, less than 5%15 of household savings are invested in the stock market in China. These percentages might explain the low correlation between China’s economic performance and its stock market performance. For example, as China’s markets receded in June, retail sales jumped 10.6% year-over-year the same month16.
Another way to measure the impact of China’s stock market performance on its overall economy is to compare the size of its capital markets to the size of its GDP. The following table shows that China has a relatively low market cap to GDP ratio.
| Country | Size of Stock Market (Market Cap) | GDP | Market Cap/GDP Ratio |
| U.S. | $25.18 trillion | $17.42 trillion | 145% |
| China | $6.83 trillion | $10.36 trillion | 66% |
| Japan | $5.05 trillion | $4.60 trillion | 110% |
| U.K. | $3.83 trillion | $2.94 trillion | 130% |
| Germany | $1.94 trillion | $3.85 trilllion | 50% |
| Switzerland | $1.74 trillion | $685 billion | 254% |
Market Cap Data from Bloomberg as of 6/30/2015. GDP data from the World Bank as of 12/31/2014
Misconception 4: The pullback undermines the reform agenda
China’s policymakers are transparent about their 2015 goals: Renminbi internationalization, continued opening of the capital markets to foreign investors, and streamlining state owned enterprises.
In order to achieve these goals, China wants to maintain a strong stock market to allow Chinese companies to tap equity capital markets for asset raising as opposed to issuing new debt. In line with opening onshore markets to the world, the People’s Bank of China, China’s central bank, announced on July 14th that China’s $6.5 trillion bond market would be opened to central banks, sovereign wealth funds, and international finance institutions17.
Additionally, on July 9th, the Chief Executive of Hong Kong, Zhenying Liang, commented in a speech that the Shenzhen–Hong Kong Stock Connect is still on track to be launched “on time.”18 While he did not specify the date, high ranking officials associated with the Hong Kong Stock Exchange previously stated that the program would launch around October 1st, China’s National Day19.
Misconception 5: Onshore Chinese equities are no longer on track to be included into global indices
Most investors outside of China define China’s stock market by the 145 Chinese companies listed in Hong Kong ($2.24 trillion market cap)20. This number excludes the 2,883 stocks listed in the onshore exchanges ($4.76 trillion market cap)21. Historically, these onshore companies have been excluded from the definition of China within international indices due to access restrictions placed on foreign investors. This will all be changing soon.
In June, MSCI, a leading provider of index solutions globally, completed a review of the inclusion of onshore Chinese equities into its definition of China within its broad based international indices. MSCI announced that the onshore markets would be included upon the resolution of three outstanding issues: quota caps, beneficial ownership, and quota being based on firm size. Despite the pullback, we believe these issues are not insurmountable and MSCI is proactively working with Chinese regulators to amend them.
While the amount of halts and suspensions are currently higher than usual, they are a regular part of trading activity in China’s onshore markets. MSCI is likely to discuss this practice in its dialogue with Chinese regulators. Moreover, China’s leadership is not alone in intervening in its markets, many other developed markets have required government interventions during periods of volatility. As mentioned, the launch of the Shenzhen–Hong Kong Stock Connect program and the resulting increased access to the onshore markets should accelerate the MSCI inclusion process.
Inclusion will have a dramatic effect on international indices. Currently, these indices have an underweight to China despite the size of its GDP and market cap. China’s weight will rise from 25% to over 40%22 in MSCI’s Emerging Market Index upon full inclusion and could potentially rise to over 60%23 if South Korea and Taiwan are upgraded to developed market status.
We believe that while there are some misconceptions about the onshore markets proliferated in the news, the increased media attention will ultimately be beneficial to China’s goal of opening up its markets to international investors. Before the pullback, few investors in the U.S. realized that the vast majority of their investments in China were limited to Hong Kong-listed Chinese companies only, and that they were missing out on the much larger onshore Chinese market. Now that this disparity has gained national awareness, U.S. investors will be paying much greater attention to the performance of the onshore markets going forward.
- Price to Earnings ratio is a valuation ratio of a company's current share price compared to its per-share earnings. It is calculated as: Market Value per Share / Earnings per Share (EPS).
- Data from Bloomberg as of 7/28/2015
- Data from Bloomberg as of 7/28/2015
- Data from Bloomberg as of 7/28/2015
- Data from Bloomberg as of 7/28/2015
- Data from Bloomberg as of 7/28/2015
- Data from Bloomberg as of 7/28/2015
- Data from Wind as of 7/28/2015
- Data from Bloomberg as of 7/28/2015
- Data from Bloomberg as of 7/28/2015
- Data from Bloomberg as of 7/28/2015
- Data from Bloomberg as of 7/28/2015
- Data from Bloomberg as of 7/28/2015
- China Daily article titled “Chinese stock volatility’s family wealth limited: CICC” on July 21, 2015
- William Hess of PRC Macro, report titled “Revisiting Trends in Urban Income and Wealth Distribution” released on May 13, 2015
- Data from the National Bureau of Statistics of China released on July 14, 2015
- Data from People’s Bank of China from 7/17/2015.
- Wang Muguang, article titled “Zhenying Liang Discusses Shenzhen Hongkong Stock Connect: ‘Endeavors to launch on time’,”Nanfang Metropolis Daily from 7/10/2015.
- Zhidong Qiao, article titled “Hongkong is Ready: Shenzhen Hongkong Stock Connect Expected to Launch Around October 1st,” CCSTOCK from 7/13/2015.
- Data from Bloomberg as of 7/28/2015
- Data from Bloomberg as of 7/28/2015
- Data from MSCI as of June 30, 2015
- Calculation by KraneShares of taking South Korea and Taiwan’s weight’s within MSCI Emerging Markets as of 6/30/2015 and adding to China’s weight upon full inclusion of the onshore equity market.


