EU Carbon Allowances Climb Higher on Greater Market Clarity
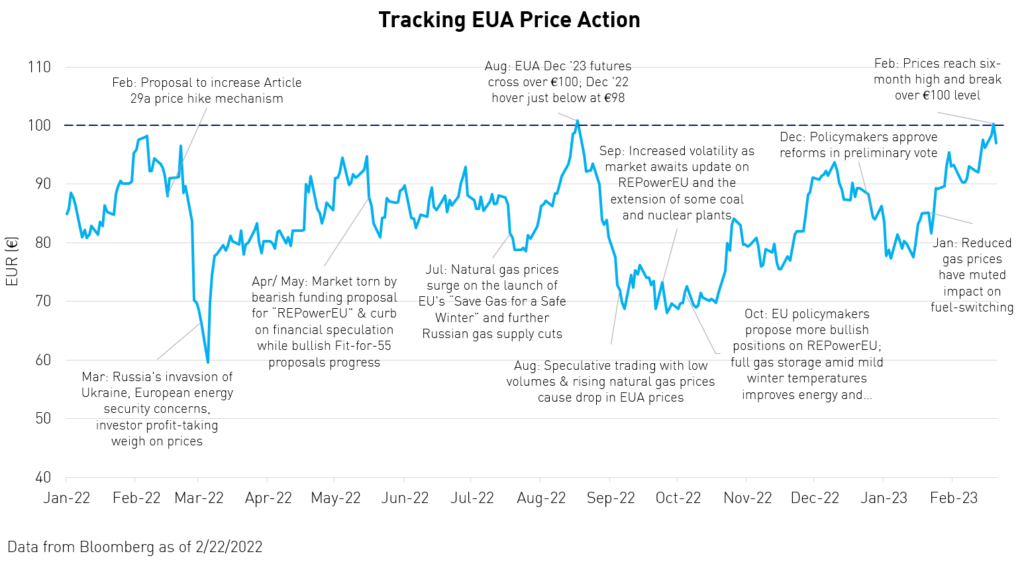
European carbon allowance (EUA) prices climbed to a six-month high mid-February, with the December 2023 futures contract hitting above the key €100 threshold. The rally has pushed EUA prices up 20% since the start of the year,1 driven, in part, by greater clarity in the market as well as improved macroeconomic sentiment and industrial output expectations.
This price action marks an important milestone as it has taken 18 years to reach this critical level.2 It's at €100 and above that we start to see greater incentive for fuel-switching and investment into low-carbon innovation and technology.3 In the past, prices have flirted with this threshold but were unable to maintain momentum. However, this time around several bullish drivers present continued support for EUAs:
- Colder temperatures are forecasted in the coming weeks, which leads to increased power and heating use and therefore demand for allowances.
- Signs of industrial recovery and normalizing energy prices should lead to greater demand for EUA to account for increased emissions from industrial activity.
- The annual compliance deadline is fast-approaching and historically has boosted prices during the quarter due to the increased allowance buying from participating entities to cover their emissions.
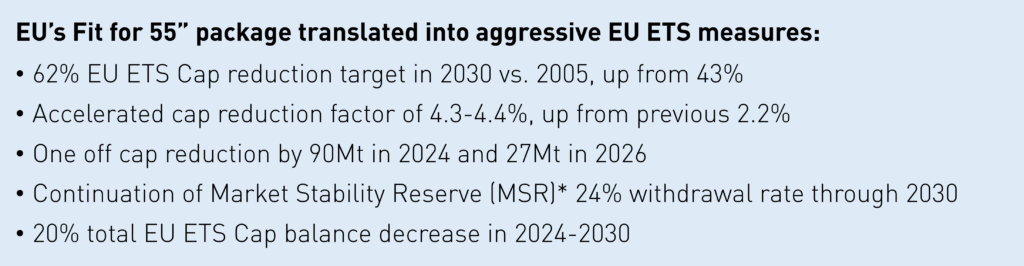
- Favorable policy reform, namely the EU emission trading system (ETS) reform--known as the “Fit-for55” package--will continue to provide long-term structural support, although most major program revisions have already been priced into the market.
The last time we saw prices near these levels was in August last year, though prices plunged soon after in the wake of soaring energy prices during record hot summer temperatures coupled with cooling industrial demand. From a low of €69 in September, prices managed to steadily climb higher for the remainder of the year—though with marked volatility mostly stemming from sensitively to the ongoing EU carbon/ climate policy developments. With much of the uncertainty from energy security concerns and policy discussions behind us, we believe the EUA market is better positioned to maintain current price levels.
Some analysts even see prices reaching new highs throughout 2023. Bloomberg highlighted an estimate of €150 by next winter, forecasted by Chief Investment Officer Ulf Ek, at hedge fund Northlander Commodity Advisors LLP.4 A long-time advocate for carbon’s rise, Ek points to greater investor confidence in the EU market following the approval and implementation of the ETS reform.
The Fit-for-55 reform consists of various measures to strengthen and expand the EU ETS to meet more ambitious emissions reduction targets. Policymakers reached a preliminary agreement on this market reform last December, with implementation of some policies to begin later this year once the package officially enters into law. For more detailed coverage of the policy reform, read our blog post here.
Additional policy considerations include the REPowerEU frontloading of auction allowances, which introduces additional allowances starting this year while causing supply tightening in the future. The market has largely digested this slightly bearish near-term news, Moreover, the net impact of this frontloading is positive as it should put upward pressure on prices by tightening supply by an estimated 4.5% during 2026-2030.5
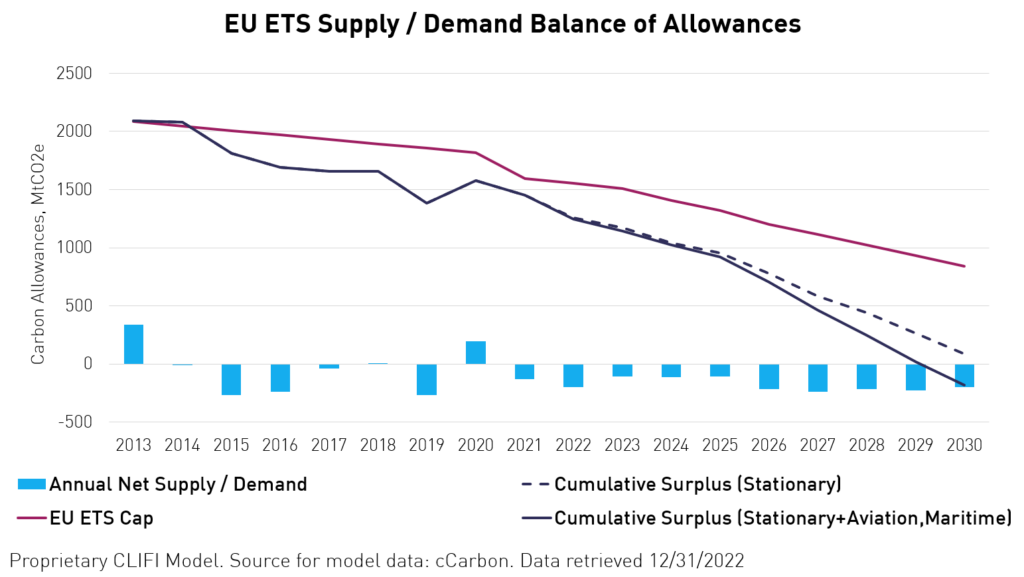
There will also be a full linkage of new sectors into the EU ETS, namely with aviation and the addition of maritime shipping in 2024, which is expected to drain supply by 2% of the total cap budget in 2022–2030 period.5 Moreover, policymakers agreed to implement the Cross Boarder Adjustment Mechanism (CBAM), a policy that acts as a tariff on foreign companies by requiring energy-intensive producers to pay the EUA price on goods imported into the region, starting in 2026. CBAM is important because it equalizes the playing field and addresses some of the political concerns around carbon pricing affecting the competitiveness of participating companies. This border tax would help discourage EU-based companies from relocating operations to non-EU countries with less ambitious climate policies and may incentivize trading partners to also regulate their emissions. Additionally, it could lead to added hedging demand for heavy industries later in the decade.
The chart below illustrates the projected supply/ demand balance of allowances based on calculations factoring in these new policies (e.g. Fit-for-55, REPowerEU, CBAM). By lowering the annual emissions cap at a faster rate with the new reform, the market’s supply is estimated to be 14% lower in 2024-2030 than if no policy changes were made.5
We also see short-term price support from the annual compliance deadline in April. To reiterate, the compliance deadline is the date that industrial plants around Europe are required to hand in allowances equivalent to their 2022 verified emissions. After last year’s jump in industrial emissions, many entities are expected to be short EUAs. Often these entities use free allowances, typically issued at the end of February, to pay for the previous year’s compliance obligations – a practice known as borrowing. Free allowances are allocated to participating entities based on their production levels; however, ever since new rules for calculating these levels were introduced in 2021, the process has taken longer and resulted in delays.
With delays in the issuing of free allowances anticipated to go beyond the standard compliance deadline, more industrials will likely be forced to buy EUAs to meet their requirement. Similar delays in the past two years have pushed prices higher during the first quarter. In 2021, EUA prices rose 25% in the first three months of the year. And last year, the market was up 15% for most of Q1, though ended down -9% due to implications from the Russian-Ukraine conflict.6
Additionally, economic indicators are showing signs of industrial recovery, which should lead to greater demand for EUAs. Bloomberg New Energy Finance (BNEF) adjusted its base-case forecast for industrial gas demand destruction relative to business as usual to 20% in February and March, down from earlier estimates at 26% in November.7 Industrial manufacturing production appears to have rebounded from October lows, with manufacturers posting an increase in production for the first time since last May.8 Moreover, the EU new industrial strategy, the Green Deal Industrial Plan, announced in early February, aims to boost Europe’s competitiveness with the US and should further accelerate industrial recovery.
Though carbon markets are subject to volatility, as was the case in 2022, these markets have exhibited compelling returns since their launch, historically outperforming other major asset classes. Our EU-specific carbon fund, the KraneShares European Union Allowance Strategy ETF (Ticker: KEUA), has returned 37.5% since its inception in October 2021 compared to the S&P 500, which was down -6.6% over the same period. Our flagship fund, the KraneShares Global Carbon Allowance Strategy ETF (Ticker: KRBN)—a blended basket of the four largest carbon markets—is up 150.3% since its inception in July 2020 compared to S&P 500 at 27.3%.9
Please click here for KEUA standard performance and top ten holdings, risks, and other fund information.
Please click here for KRBN standard performance and top ten holdings, risks, and other fund information.
While the new developments within the EU market provide a catalyst for growth potential, we believe other, relatively newer markets also offer compelling investment opportunities for their attractive entry points. There has been a lot of enthusiasm for California carbon allowances, as the market’s lower price levels offer promising growth potential. CCA futures currently trade around $30 whereas the more mature EUA market has averaged $87 in the last year.10 That said, we believe optimal exposure includes a blend of the different carbon markets for diversification** benefits.
In KRBN, our global carbon allowance fund, we have a 60-30 allocation to EUAs and CCAs, respectively. Additionally, KBRN allocates to the Northeastern US Regional Greenhouse Gas Initiative (RGGI), which is set to grow with the addition of two new states, i.e., Pennsylvania and North Carolina. In 2021, we added the UK ETS, which spun off of the EU market following Brexit and is set for further strengthening with new commitments to higher emissions targets. Across the board, policy changes are working to raise climate ambition and implement supply-tightening measures, which should put upward pressure on carbon prices.
The EU market pushing above €100 despite having just come out of several market shocks, such as the Russian invasion and energy crisis, highlights the resilience of carbon allowance markets and their ability to withstand major geopolitical and economic tests. This trend also supports our view on carbon markets' inherent asymmetric upside. In risk-off markets, carbon has constructive tailwinds and is supported by strong policy; while in risk-on environments, carbon markets can be more aggressive and see accelerating performance.
*MSR: a mechanism, introduced in 2019, that adjusts the supply of allowances available at auction based on predetermined thresholds for the total number of allowances in circulation (TNAC). It was designed to address the ongoing allowance surplus and to improve the market’s resilience to future shocks.
**Diversification does not ensure a profit or guarantee against a loss.
Citations:
- Data from Bloomberg retrieved 2/23/2023.
- Bloomberg, "European Carbon Monthly February 2023: Breaching €100," February 27, 2023.
- Reuters, "EU carbon hits 100 euros taking cost of polluting to record high,” February 21, 2023
- Bloomberg, “EU Carbon Rises to 100 on Prospect of Industrial Rebound,” February 21, 2023.
- Data from CLIFI retrieved 12/30/2022.
- Data from Bloomberg retrieved 2/23/2023.
- BloombergNEF, “European Carbon Monthly January 2023: A New Normal,” 1/30/2023.
- Trading Economics, “Euro Area Manufacturing PMI,” retrieved 2/23/2023.
- Data from Bloomberg retrieved 2/24/2023.
- Data from Bloomberg retrieved 2/24/2023.