Could this be the most influential publication in asset management?
How MSCI’s Global Investable Market Indexes Methodology influences trillions of dollars

The average investor is not likely to sit down to read MSCI’s Global Investable Market Indexes Methodology (GIMI) the same way they would read a book like: Ben Graham’s The Intelligent Investor or Edwin Lefevre’s Reminiscences of a Stock Operator. While these books look impressive on the shelf, they do not outline the rules that $10 trillion1 in active and passive assets follow.
At KraneShares we have read the GIMI and we believe investors should understand the way it dictates, or influences, how and which securities are held by index funds, ETFs, and even actively-managed mutual funds. Through taking the time to understand the GIMI, we believe investors may better note the magnitude of the potential changes on the horizon, and how these changes may affect their portfolios.
MSCI Inc. (formerly Morgan Stanley Capital International) is a leading provider of index solutions globally. The firm was founded in 1968 with a focus on publishing indexes to cover international stock markets. Today MSCI serves 97 of the top 100 global asset managers, has 150 researchers around the world, and its Global Standard Indexes establish a highly influential benchmark for defining the investment world2.
How does MSCI define the world?
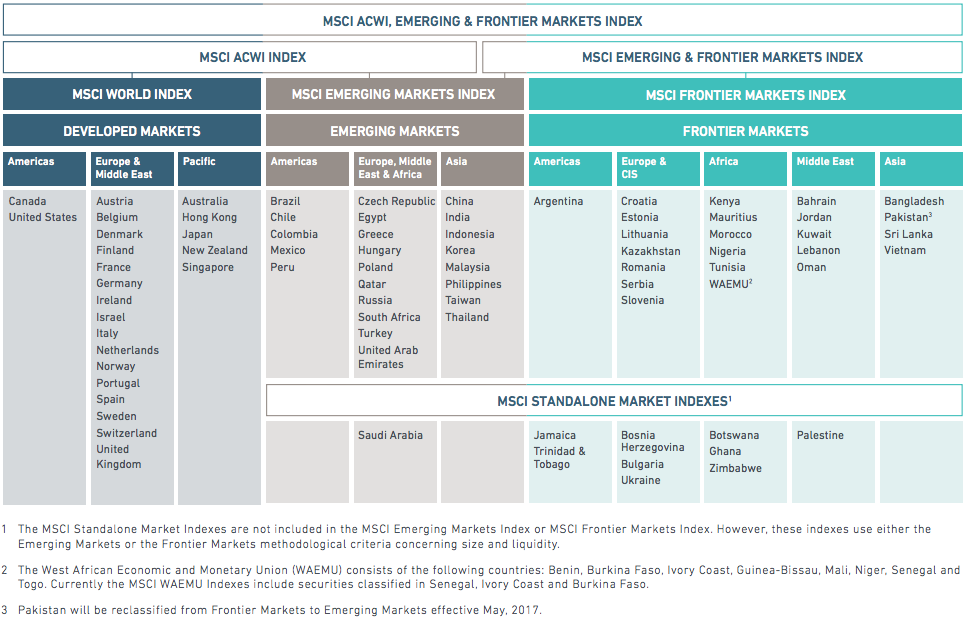
MSCI takes a modular approach to defining the world which at the top level can be divided into two sections: the MSCI All Country World (ACWI) Index and the MSCI Frontier Markets Index. From ACWI we can segment the world into developed and emerging markets. We can then break these definitions down further into regional indexes, such as: Americas, Europe & Middle East, Pacific, etc. These regional indexes are then divided into country indexes. Countries are further segmented based on market capitalization, value, and growth styles, and even further into sectors based on Global Industry Classification Standard.
Once MSCI’s rules are defined they must be monitored frequently and adjusted to adapt to global market conditions. The following chart summarizes MSCI’s modular approach to building and maintaining their indexes.
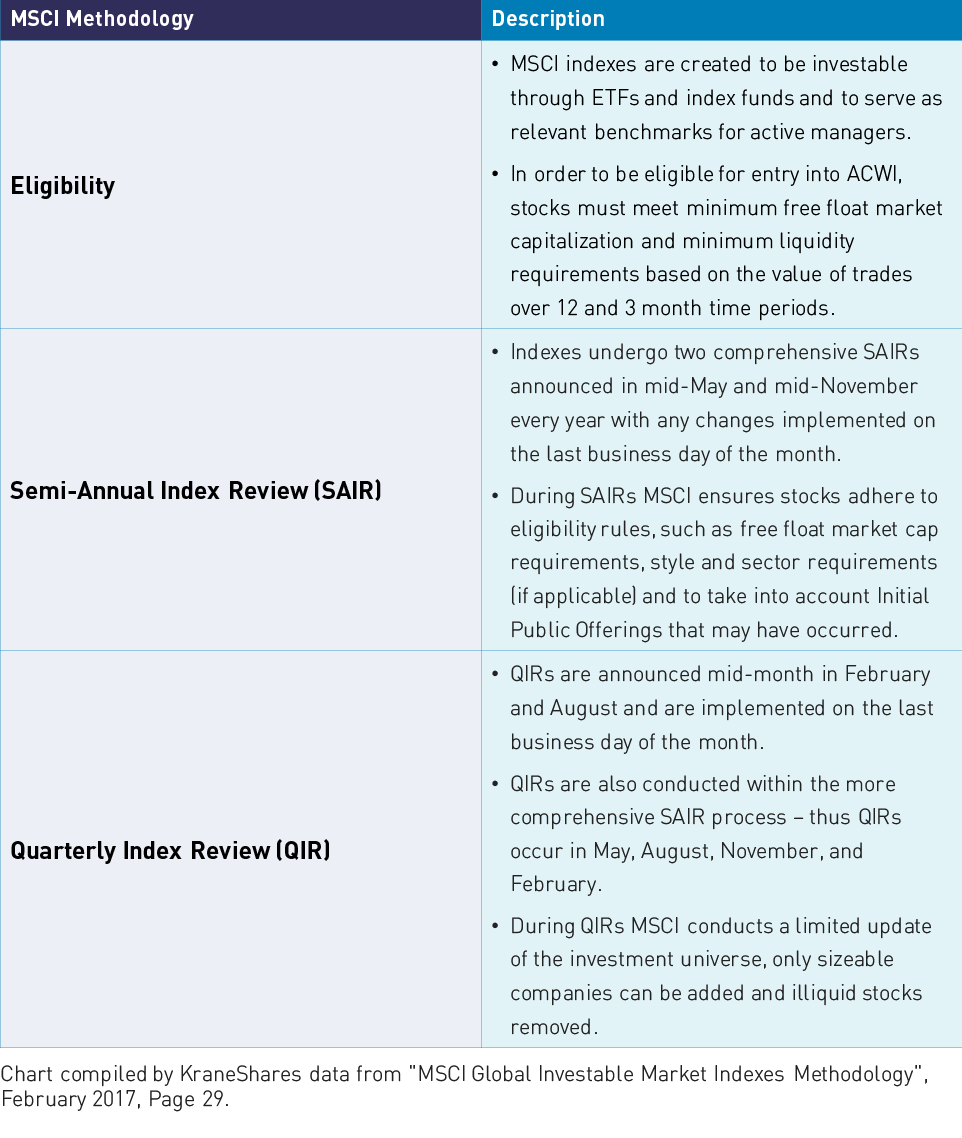
Think of Semi-Annual Index Reviews (SAIRs) as a “comprehensive review” while a Quarterly Index Review (QIR) is more of a standard update. Like SAIRs, QIRs look at free float market capitalization: stocks actively available for trading in the market that are not tied up in stock option compensation plans or held by company insiders. Changes in free float market capitalization can cause a company’s index weight to change.
While SAIRs and QIRs occur regularly, changes to a country's developed, emerging, or frontier status are rare. MSCI defines a developed market as a “Country GNI (Gross National Income) per capita 25% above World Bank high income threshold for three consecutive years” which was most recently assessed at $12,7463. Developed markets differ from Emerging Market and Frontier Market on size and liquidity requirements and several market accessibility criteria. While there is no income requirement to differentiate emerging from frontier markets there are quantitative size and liquidity requirements and qualitative criteria based on market accessibility. In the last decade only two countries have migrated from Frontier to Emerging and only one from Emerging to Developed.
Historic upgrades
The promotion from Frontier to Emerging Markets brings exposure to a much larger asset base. This is because the MSCI Frontier Markets Index has relatively few assets benchmarked to it while the MSCI Emerging Markets Index has $1.6 trillion in benchmarked assets1. Emerging Market passive managers have no choice but to buy the stocks once added to the index while active-managers generally must at least consider the stocks for purchase.
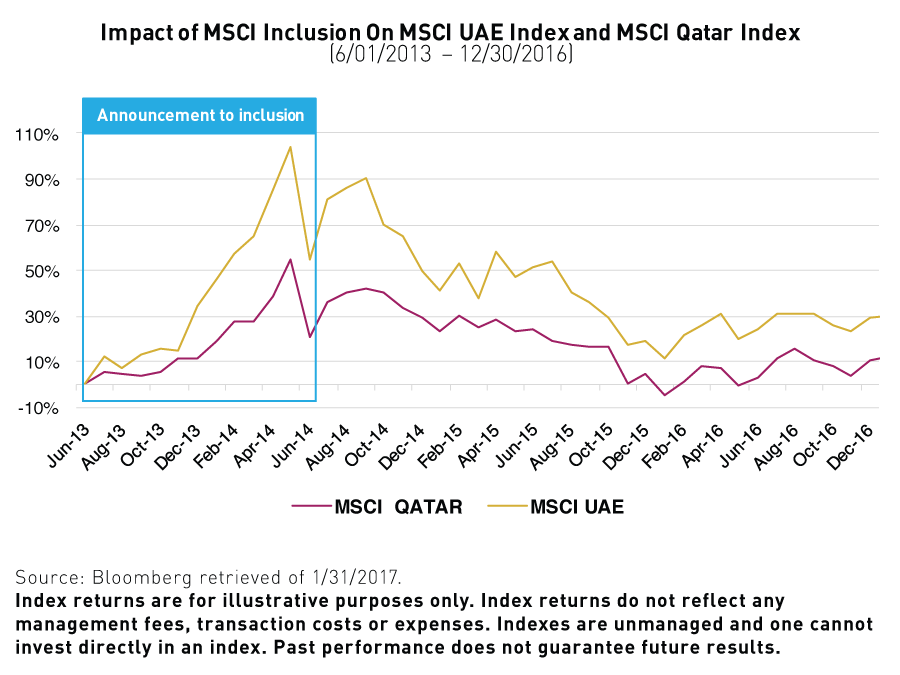
During the May 2013 SAIR, MSCI announced the United Arab Emirates and Qatar would be upgraded from Frontier to Emerging Markets during the May 2014 SAIR. During this time period the MSCI UAE and Qatar indexes rose 85.6% and 49.1% respectively4.
These are the only two countries that have been upgraded from the MSCI Frontier Markets Index to the Emerging Markets Index in the past decade. However, during the May 2016 SAIR MSCI announced Pakistan would be upgraded from Frontier to Emerging Markets during the 2017 May SAIR. Relatively speaking, these inclusions were small. UAE and Qatar currently only comprise 0.81% and 0.84% of the MSCI Emerging Markets Index respectively. Pakistan is also expected to have a relatively small weighting within the index.
MSCI China A International Inclusion
The historical MSCI definition of China has been Chinese companies listed in Hong Kong. The definition evolved when US listed Chinese companies were added over the course of two SAIRs in November 2015 and May 2016. For the last three years MSCI has considered adding Chinese companies listed on the Shanghai and Shenzhen Stock Exchanges, which together comprise the world's second largest equity market, and separately the 4th and 7th largest stock exchanges respectively, in terms of market capitalization5. MSCI’s definition of the Mainland market is the MSCI China A International Index which is the same index tracked by the KraneShares Bosera MSCI China A ETF (ticker KBA). The inclusion of the specific subset of stocks tracked by KBA's index into MSCI’s Global Standard Indexes should have a dramatic effect on the MSCI Emerging Market Index as China’s weight should increase from 26% to over 40%6.
Since this inclusion would likely have a dramatic impact on the markets, MSCI has taken a prudent approach to evaluating the change by consulting with its client base of institutional investors around their ability to invest in Mainland Chinese equities. Simultaneously, Chinese regulators have expanded access to the Mainland market in order to facilitate greater international investment. MSCI announced after last year’s May SAIR that their review would be extended one more year due to three outstanding issues summarized in the chart below:
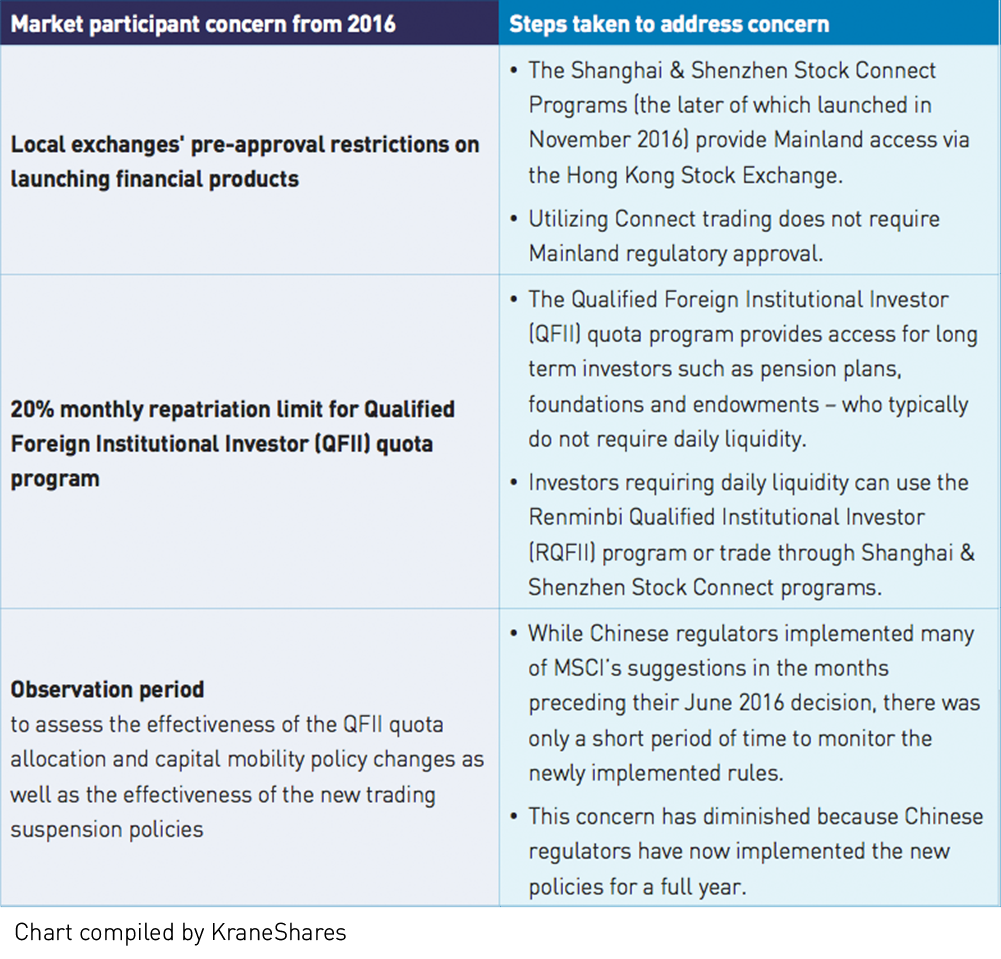
It is important to note that these were not MSCI’s concerns but “market participants” i.e. their clients, which include some of the world’s largest asset managers. So are asset managers ready? Speaking from our own experience, we have utilized both quota programs and new stock and bond connect programs to provide access to the Mainland equity and fixed income markets. We are able to provide investors intraday liquidity exposure to China’s Mainland Markets through ETFs trading on the New York Stock Exchange. In our opinion these markets are ready for inclusion.
The first line of MSCI’s GIMI sums it up nicely: “The MSCI global equity indexes have maintained their leading position because they have evolved over time to continue to appropriately reflect the international investable opportunity set of equities while addressing the changing and expanding investment interests of cross-border investors.” After taking the time to understand MSCI’s construction methodology and what to watch for, investors may potentially benefit from allocating to the Mainland Chinese Equity markets ahead of their potential upgrade.
Index Definitions:
MSCI Emerging Markets Index: captures large and mid cap representation across 23 Emerging Markets (EM) countries
MSCI All Country World (ACWI) Index: captures large and mid cap representation across 23 Developed Markets (DM) and 23 Emerging Markets (EM) countries.
MSCI Frontier Markets Index: captures large and mid cap representation across 27 Frontier Emerging Markets countries
The MSCI United Arab Emirates (UAE) Index: designed to measure the performance of the large and mid cap segments of the UAE market.
The MSCI Qatar Index: designed to measure the performance of the large and mid cap segments of the Qatari market.
The MSCI Pakistan Index: designed to measure the performance of the large and mid cap segments of the Pakistan market. With 16 constituents, the index covers approximately 85% of the Pakistan equity universe.
The MSCI China A International Index: is a free-float adjusted market capitalization weighted index that is designed to track the equity market performance of large-cap and mid-cap Chinese securities listed on the Shanghai and Shenzhen Stock Exchanges. The Index is based on the concept of the integrated MSCI China equity universe with mainland Chinese securities included.
- Benchmarked asset data from MSCI as of 6/30/2016 as reported on 9/30/2016
- Data from msci.com, retrieved 2/28/2017
- "MSCI Global Investable Market Indexes Methodology", February 2017, Page 92.
- Data from Bloomberg retrieved 1/31/2017
- Data from the World Federation of Exchanges as of 12/31/2016 retrieved 3/01/2017
- MSCI Research, as of Sept. 30, 2016
The KraneShares ETFs are distributed by SEI Investments Distribution Company (SIDCO), 1 Freedom Valley Drive, Oaks, PA 19456, which is not affiliated with Krane Funds Advisors, LLC, the Investment Adviser for the Fund. Additional information about SIDCO is available on FINRA’s BrokerCheck.

