Krane Funds Advisors, LLC is the investment manager for KraneShares ETFs. KraneShares offers innovative investment solutions tailored to three key pillars: China, Climate, and Uncorrelated Assets. Our team is determined to provide industry-leading, differentiated, and high-conviction investment strategies that offer access to key market trends. Our mission is to empower investors with the knowledge and tools necessary to capture the importance of these themes as an essential element of a well-designed investment portfolio.
August 16, 2024 – A Bullish Take on Chinese Stocks and ETFs! (Steady Wealth Podcast Ep. 68)

August 1, 2024 – MSCI China: The Internet Sector Is One Area With Growth Prospects, Says Kraneshares
July 26, 2024 – Strict Export Controls on China Can Have ‘Unintended Consequences’
July 26, 2024 – KraneShares Launches Ultra Short Duration Investment Grade Bond ETF (KCSH) Designed for Sustainable Impact
Our semi-monthly topical research reports. Subscribe to our weekly mailing list for more.

August 12, 2024 – How to Invest in AI for The Next Decade

August 6, 2024 – Asia High Yield: Why The Outperformance & Can It Continue?

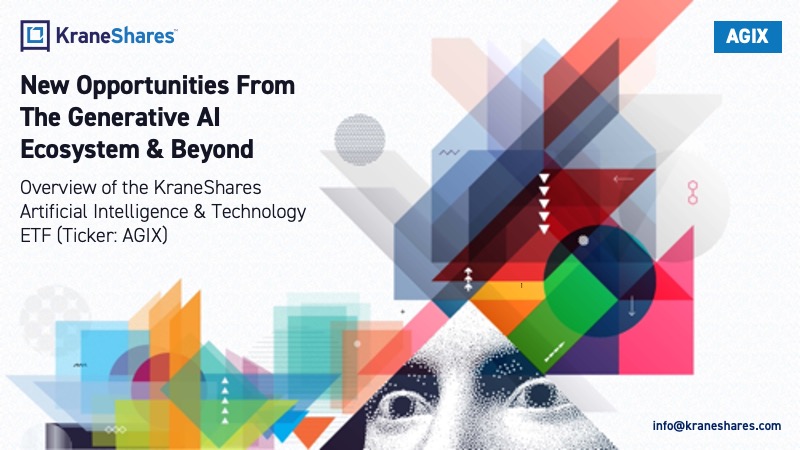
July 18, 2024 – KraneShares Launches AGIX: An Artificial Intelligence & Technology ETF That Provides Investors Exposure to Companies Across the AI Ecosystem

July 9, 2024 – Revisiting Hong Kong: Optimism Still Improving Even As Rally Gets Tested
Information about KraneShares ETFs, China's markets and culture, and general investing resources.
Our market update is a collaboration between the KraneShares internal research department, our local Chinese partners, and select China thought leaders from around the world. Our goal is to deliver a differentiated perspective on Chinese capital markets, business, government, and culture.
280 Park Avenue, 32nd Floor
New York, NY 10017
1 Embarcadero Center, Suite 2350
San Francisco, CA 94111
181 Queen Victoria Street
London EC4V 4EG
AGIX tracks the Solactive Etna Artificial General Intelligence Index, which is designed to capture the performance of companies engaged in developing and applying artificial intelligence technologies. AGIX primarily holds publicly listed global AI companies and has the ability to allocate to private AI companies.
The Index focuses on three key categories within the AI sector: hardware, infrastructure, and applications. The Index constituents are selected based on a proprietary AI Exposure Score, which assesses each company's relevance to and readiness for artificial intelligence technology. It includes companies developing semiconductors and data centers crucial for large language models (LLM), firms providing cloud and data services for AI training & deployment, and businesses leveraging AI to enhance efficiency, reduce costs, and improve customer experiences. This approach offers comprehensive exposure to the AI value chain, from foundational technology to practical implementations across various industries.
1. Data from Reuters and SimilarWeb as of 2/23/2023. Retrieved 6/30/2024.
2. Data from “The economic potential of generative AI: The next productivity frontier,” June 14th, 2023, McKinsey & Company. Retrieved 6/30/2024.
| Ticker | AGIX |
| Primary Exchange | NASDAQ |
| CUSIP | 500767363 |
| ISIN | US5007673636 |
| Net Assets | $5,026,024 |
| Total Annual Fund Operating Expense | 1.00% |
| Inception Date | 07/18/2024 |
| Distribution Frequency | Annual |
| BBSMI
Broad-Based Securities Market Index – a broad-based index that represents the overall applicable domestic, international equity, or debt market, as appropriate.
|
S&P 500 |
| Underlying Index | N/A Active |
| Daily Net Asset Value (NAV) and Market Price | |
| NAV | $25.13 |
| NAV Daily Change | 1.37% |
| Market Price | $25.13 |
| Market Price Daily Change | 1.33% |
| 30 Day Median Bid/Ask Spread |
0.21% |
| The ETF’s 30 Day Median Bid-Ask Spread is calculated by identifying the ETF’s national best bid and national best offer ("NBBO") as of the end of each 10 second interval during each trading day of the last 30 calendar days and dividing the difference between each such bid and offer by the midpoint of the NBBO. The median of those values is identified and that value is expressed as a percentage rounded to the nearest hundredth. | |
| NAV | Market Price | Premium/Discount |
| $25.13 | $25.13 | $0.00 |
| Q3 2024 | |
| Days traded at premium | 16 |
| Days traded at NAV | 0 |
| Days traded at discount | 7 |
The Premium/Discount History chart demonstrates the difference between the daily market price of shares of the Fund and the Fund’s net asset value (NAV). The vertical axis of the chart shows the premium or discount of the daily market price as a percentage of the NAV. The horizontal axis shows each trading day in the time period, and each data point in the chart represents the Premium/Discount on that day. The data presented in the chart and table above represent past performance and cannot be used to predict future results.
| Fund NAV | Closing Price | BBSMI | |
| 1 Month | – | – | – |
| 3 Month | – | – | – |
| 6 Month | – | – | – |
| YTD | – | – | – |
| Since Inception | -2.52% | -2.44% | -1.16% |
| Fund NAV | Closing Price | BBSMI | |
| Since Inception | – | – | – |
Broad-Based Securities Market Index (BBSMI) is a broad-based index that represents the overall applicable domestic, international equity, or debt market, as appropriate.
S&P 500 (Net Total Return): The S&P 500 is widely regarded as the best single gauge of large-cap U.S. equities. The index includes 500 companies in leading industries of the U.S. economy and covers approximately 80% of available market capitalization. The index was created in 1957.
The performance data quoted represents past performance. Past performance does not guarantee future results. The investment return and principal value of an investment will fluctuate so that an investor's shares, when sold or redeemed, may be worth more or less than their original cost and current performance may be lower or higher than the performance quoted.
| Ex-Date | Record Date | Payable Date | Amount |
Future calendar dates are subject to change. There is no guarantee that dividends will be paid. Past distributions are not indicative of future trends. This material is provided for educational purposes only and does not constitute investment advice.
Distributions are issued to brokers on the payable date, and are subject to broker payment schedules.
Download our Summer #China #Internet #Report. In this edition’s theme highlight, we explore China’s #fintech ecosystem, which is entering a new post regulatory overhaul era. We also provide a subsector analysis and $KWEB top 10 holdings #earnings update.
— KraneShares (@KraneShares) August 2, 2024
Download:… pic.twitter.com/UM2QFDO0DU
@KraneShares CEO Jonathan Krane took the main stage on the Tackling Financial System Fragmentation panel, where he discussed the potential #investment and innovation opportunities in China at the 2024 Summer @Davos held in Dalian, China! pic.twitter.com/KdvbOhsRyN
— KraneShares (@KraneShares) June 26, 2024


| Rank | Name | % of Net Assets | Ticker | Identifier | Shares Held | Market Value($) |
| 1 | NVIDIA CORP | 7.90% | NVDA | US67066G1040 | 3,053 | 396,890 |
| 2 | MICROSOFT CORP | 7.50% | MSFT | US5949181045 | 894 | 376,848 |
| 3 | APPLE INC | 5.65% | AAPL | US0378331005 | 1,257 | 283,944 |
| 4 | AMAZON.COM INC | 4.90% | AMZN | US0231351067 | 1,382 | 246,300 |
| 5 | META PLATFORMS INC | 4.76% | META | US30303M1027 | 452 | 239,235 |
| 6 | BROADCOM INC | 3.57% | AVGO | US11135F1012 | 1,069 | 179,282 |
| 7 | TAIWAN SEMIC-ADR | 3.42% | TSM | US8740391003 | 981 | 172,116 |
| 8 | ALPHABET INC-CL A | 3.37% | GOOGL | US02079K3059 | 1,017 | 169,503 |
| 9 | TESLA INC | 2.68% | TSLA | US88160R1014 | 605 | 134,746 |
| 10 | SK HYNIX INC | 2.67% | 000660 | KR7000660001 | 923 | 134,221 |
Holdings are subject to change.
Hyperlinks on this website are provided as a convenience and we disclaim any responsibility for information, services or products found on the websites linked hereto.
Click here to continueYou are now leaving KraneShares.com. Hyperlinks on these websites are provided as a convenience and we disclaim any responsibility for information, services or products found on the websites linked hereto.
For questions on how to invest in KraneShares ETFs, please refer to ETF Trading 101.
This website uses cookies to help us enhance your browsing experience. By using this website you consent to our use of these cookies. You can customize your preferences by clicking “Cookie Preferences” below. To find out more about how we use cookies and how to manage them, please see our Terms & Conditions and Privacy Policy.