We’ve Been Here Before: A Historical Look at KWEB Returns

On July 31st, 2018, the KraneShares CSI China Internet ETF (NYSE: KWEB) had its five-year anniversary. We are extremely proud of accomplishing a five-year track record. Given recent volatility, there was no time for a champagne toast, but looking at our returns we still find plenty of reason to celebrate. As of July 31, 2018, KWEB was the number one performing U.S. listed China ETF1, and the number one fund in the Morningstar China region category over the past five years2. KWEB achieved a five-year return of 130% cumulative and 18.14% annualized, beating the S&P 500, which returned 85.18% and 13.11% respectively over the same time period3. Looking at KWEB’s historical performance we can see that each major contraction has subsequently been met with a period of even greater expansion.
The performance data quoted represents past performance. Past performance does not guarantee future results. The investment return and principal value of an investment will fluctuate so that an investor’s shares, when redeemed, may be worth more or less than their original cost and current performance may be lower than the performance quoted. Total Annual Fund Operating Expense for KWEB is 0.70%. For performance data current to the most recent month end, please click here.
KWEB has never moved in a straight line. Over the past five-years, KWEB has had five previous drawdowns of more than 10%.
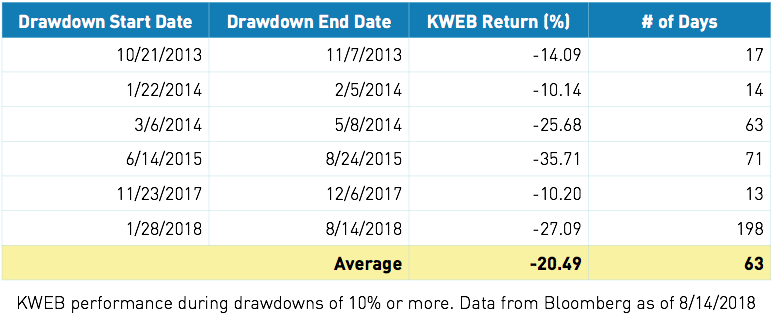
The summer of 2015 was particularly difficult as two distinct factors converged to weigh on KWEB's performance. First, a fall in mainland Chinese stocks initiated a difficult macro environment that spread to U.S. listed Chinese companies. Second, Alibaba’s earnings on August 12, 2015, missed analyst expectations leading to a big drop in BABA's stock and KWEB.
What happened next? Let’s look at what KWEB did after each of these down moves of more than 10%.
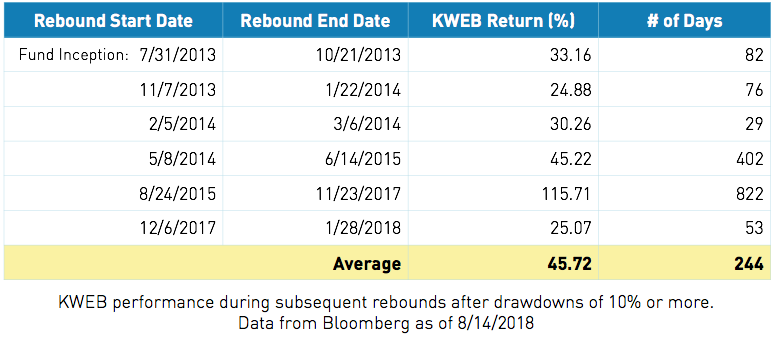
Declines of 10 to 35% were followed by rebounds of 25 to 116%. On average, these declining periods were down 20% and lasted 63 days, while rebound periods were up 45% and lasted 244 days. Of course, no one likes to see their investments decline, and the toughest part of investing is maintaining the emotional fortitude to ride out, or harder still, increase a position during a downturn. But history shows that performance has the potential to rebound quickly.
We believe that in challenging moments it is important to revisit KWEB’s core thesis and assess whether it still remains intact. China is rebalancing its economy from exports to domestic consumption. In 2013 the services sector surpassed the industrial sector for the first time as the largest contributor to China’s GDP4. Retail sales have expanded steadily, reaching $5.8 trillion in 20175. Chinese E-Commerce sales have nearly quadrupled to $1.14 Trillion since KWEB listed5, and China's E-Commerce market size is now over twice the size of the United States’ E-Commerce market6. At the same time only 52.2% of China’s population (721 million people) have access to the internet compared to 88.5% of the U.S. population (287 million people)7.
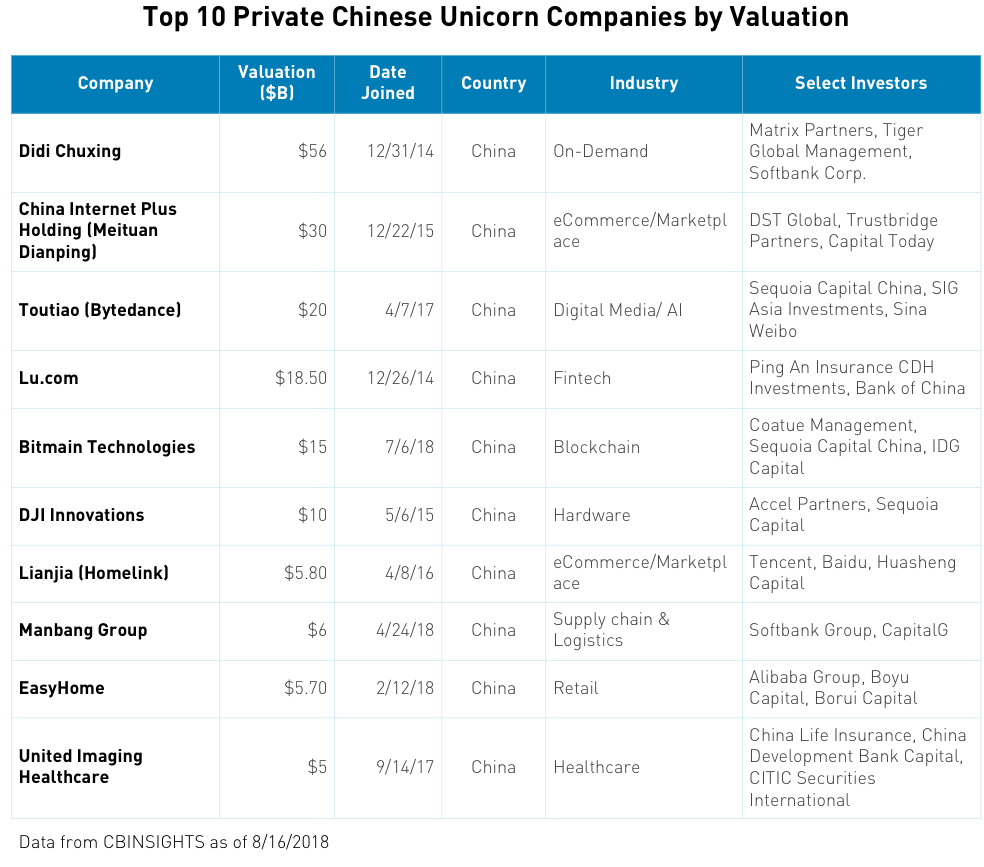
Based on these statistics the macro environment in China is ripe for domestic internet companies to thrive. While China’s BAT internet giants: Baidu8, Alibaba9 and Tencent10 have become household names amongst U.S. investors, KWEB holds 43 additional Chinese internet stocks that also stand to benefit from China's macro environment. Additionally, there is a steady pipeline of large Chinese internet companies which may go public. Of the currently private companies with valuations over a billion dollars tracked in the CBINSIGHTS Global Unicorn club, 78 of 261 companies are from China8. Looking at the table below of the top ten private Chinese unicorns, any one of them could be the next BAT company, and at least seven of them could potentially qualify for inclusion within KWEB if they were to go public.
While the road can be bumpy, we believe the reward potential is great and that we are still in the early innings of the China internet sector's growth story. As always, we are available to share our perspective if you have any questions about the market. Click here to contact us.
- Data from Bloomberg as of 7/31/2018, retrieved 8/07/2018
- Data from Morningstar as of 7/31/2018 retrieved 8/07/2018
- Data from Bloomberg as of 7/31/2018
- Data from Bloomberg as of 12/31/2017, retrieved 6/30/2018
- National Bureau of Statistics in China, “Total Retail Sales of Consumer Goods in December 2017”. Retrieved on 1/25/2018. Note: Figures converted from Renminbi to USD.
- U.S. Department of Commerce, “Quarterly Retail E-commerce Sales 4th Quarter 2017”. Retrieved on 2/16/2018.
- Data from internetlivestats.com as of 31 December 2016. Retrieved on 6/30/2018.
- Data from CBINSIGHTS as of 8/16/2018
- Baidu % of KWEB net assets as of 8/17/2018: 8.79%
- Alibaba % of KWEB net assets as of 8/17/2018: 9.67%
- Tencent % of KWEB net assets as of 8/17/2018: 10.14%
©2018 Morningstar, Inc. All Rights Reserved. The information contained herein: (1) is proprietary to Morningstar and/or its content providers; (2) may not be copied or distributed; and (3) is not warranted to be accurate, complete or timely. Neither Morningstar nor its content providers are responsible for any damages or losses arising from any use of this information. Past performance is no guarantee of future results.
For the period ending, July 31, 2018, KraneShares CSI China Internet ETF was rated by Morningstar, Inc. against the following numbers of US Open End and Exchange Traded Fund – China Region Category over the following time periods: 82 out of 90 funds in the last one year, and 1 out of 79 funds in the last five years. Ratings were based upon total return. Past performance is no guarantee of future results. These rankings do not take into account front-end sales charges. Fees were waived during the period on which the ranking is based.
For the period ending, July 31, 2018, KraneShares CSI China Internet ETF was ranked using total return data from Bloomberg against the entire universe of 79 U.S. listed China ETFs. The KraneShares CSI China Internet ETF was ranked 17 out of 38 ETFs in the last one year, and 1 out of 25 funds in the last five years. Past performance is no guarantee of future results. These rankings do not take into account front-end sales charges. Fees were waived during the period on which the ranking is based.
The KraneShares ETFs are distributed by SEI Investments Distribution Company (SIDCO), 1 Freedom Valley Drive, Oaks, PA 19456, which is not affiliated with Krane Funds Advisors, LLC, the Investment Adviser for the Fund. Additional information about SIDCO is available on FINRA’s BrokerCheck.