Two China Tech Giants Join the $300B Club. Who’s Next?

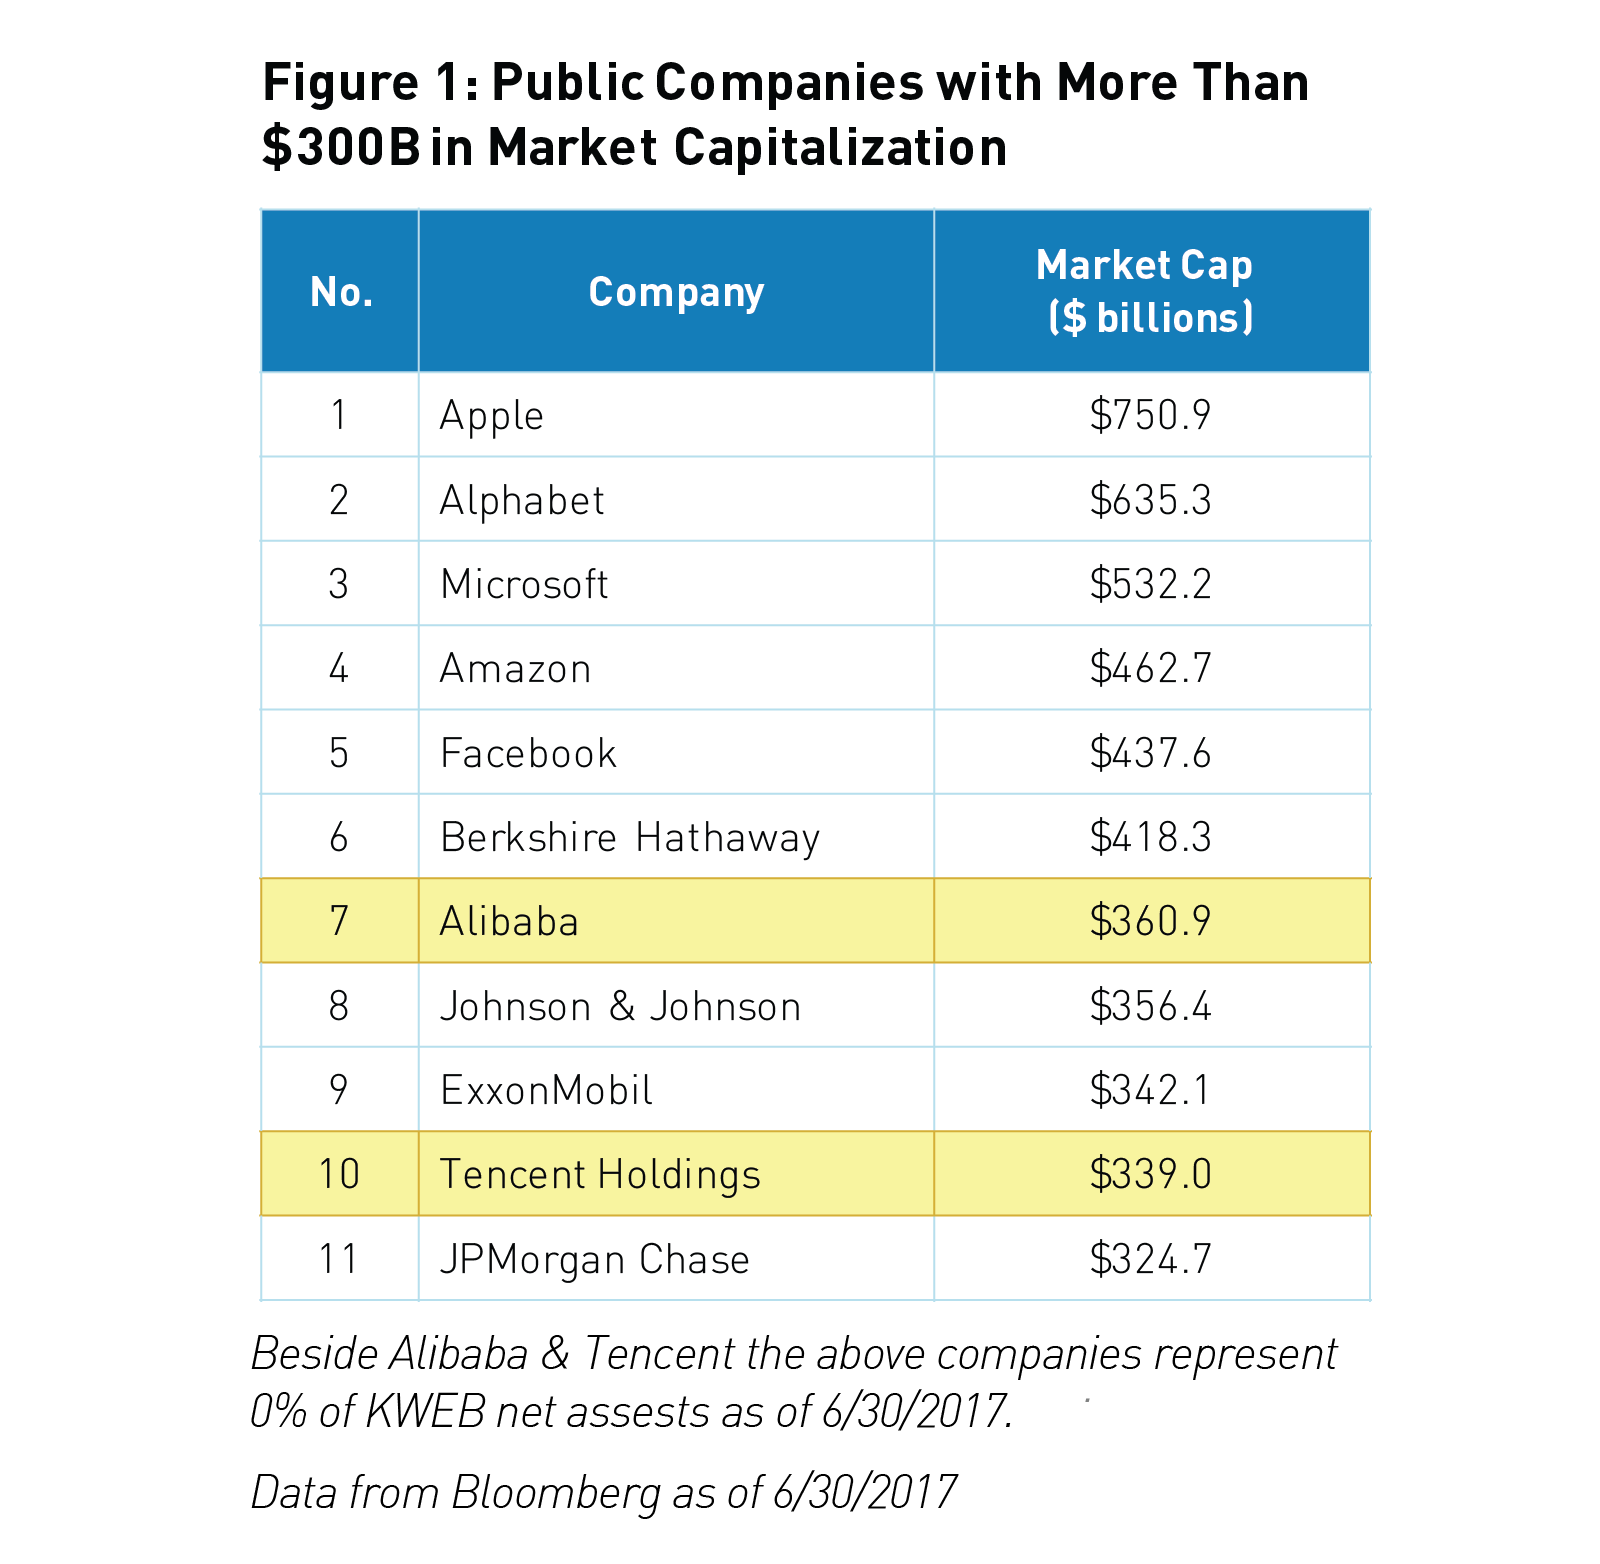
In May 2017, Alibaba1 and Tencent2 exceeded $300 billion in market capitalization for the first time, placing these two Chinese tech companies in an elite group that, as of June 2017, only counts nine other companies globally among its members3. While this growth is exciting, it also begs the question: having reached such an enormous size, how much room is left for Alibaba and Tencent to grow?
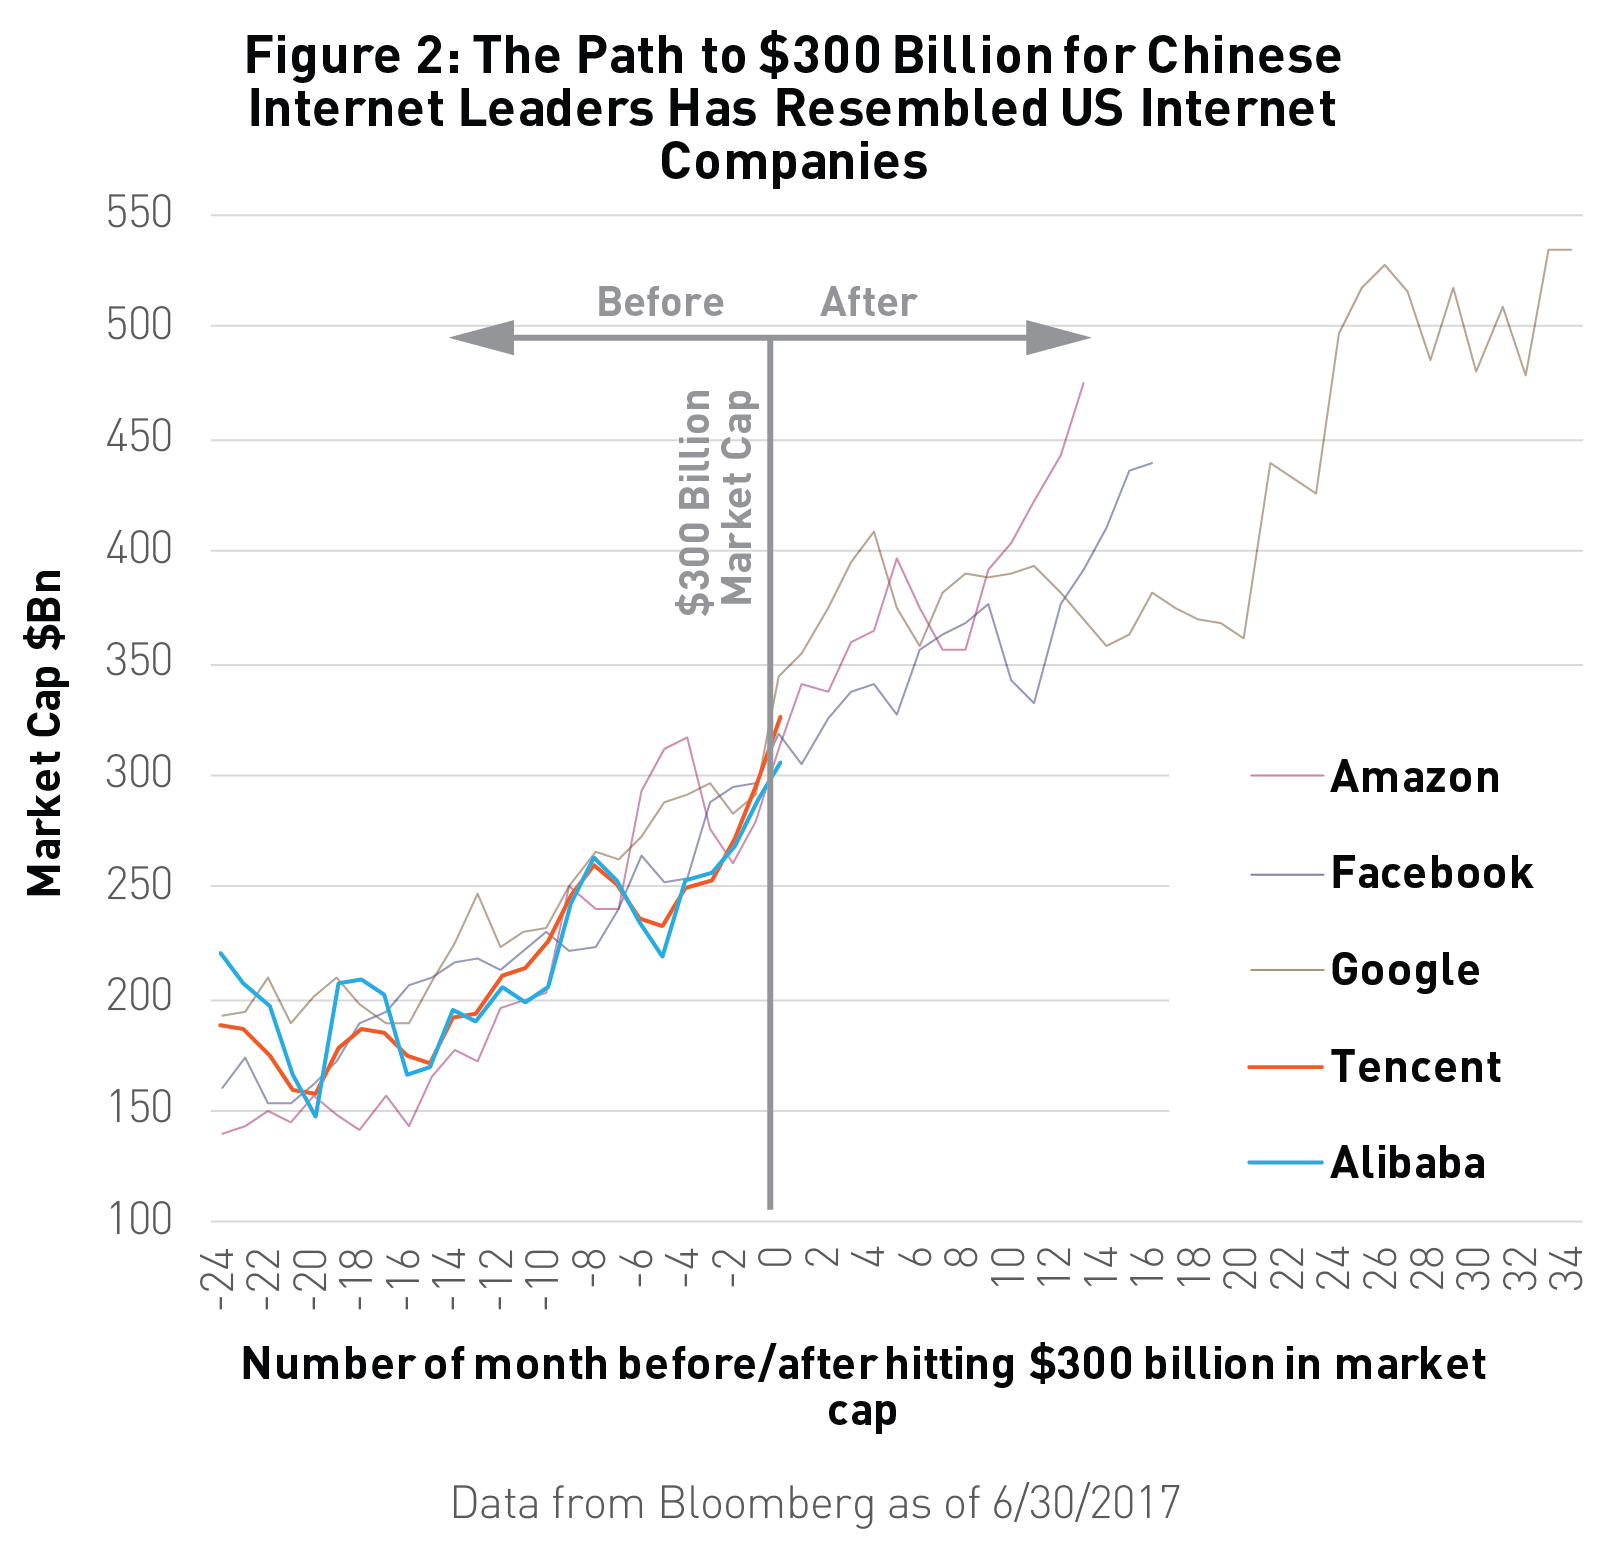
One way to evaluate this question is to study the growth patterns of similar internet technology companies that have already hit the $300 billion mark. For example, Google* first joined the group in May 2013 while Amazon and Facebook* did the same in November 20154. These companies may provide insight into how Alibaba and Tencent might perform going forward.
According to data from Bloomberg, hitting this valuation did not interrupt the growth of Google, Amazon or Facebook. Figure 2 explains this by showing the paths to $300 billion in market cap for internet technology companies. The graph shows the months leading up to each company reaching $300 billion (represented by negative numbers) and those directly afterward (represented by positive numbers). After reaching $300 billion in market cap, Google, Amazon, and Facebook continued to grow steadily. Google even went on to increase its market cap to $534 billion over the next three years, and by June 30, 2017, it more than doubled to $635.3 billion5.
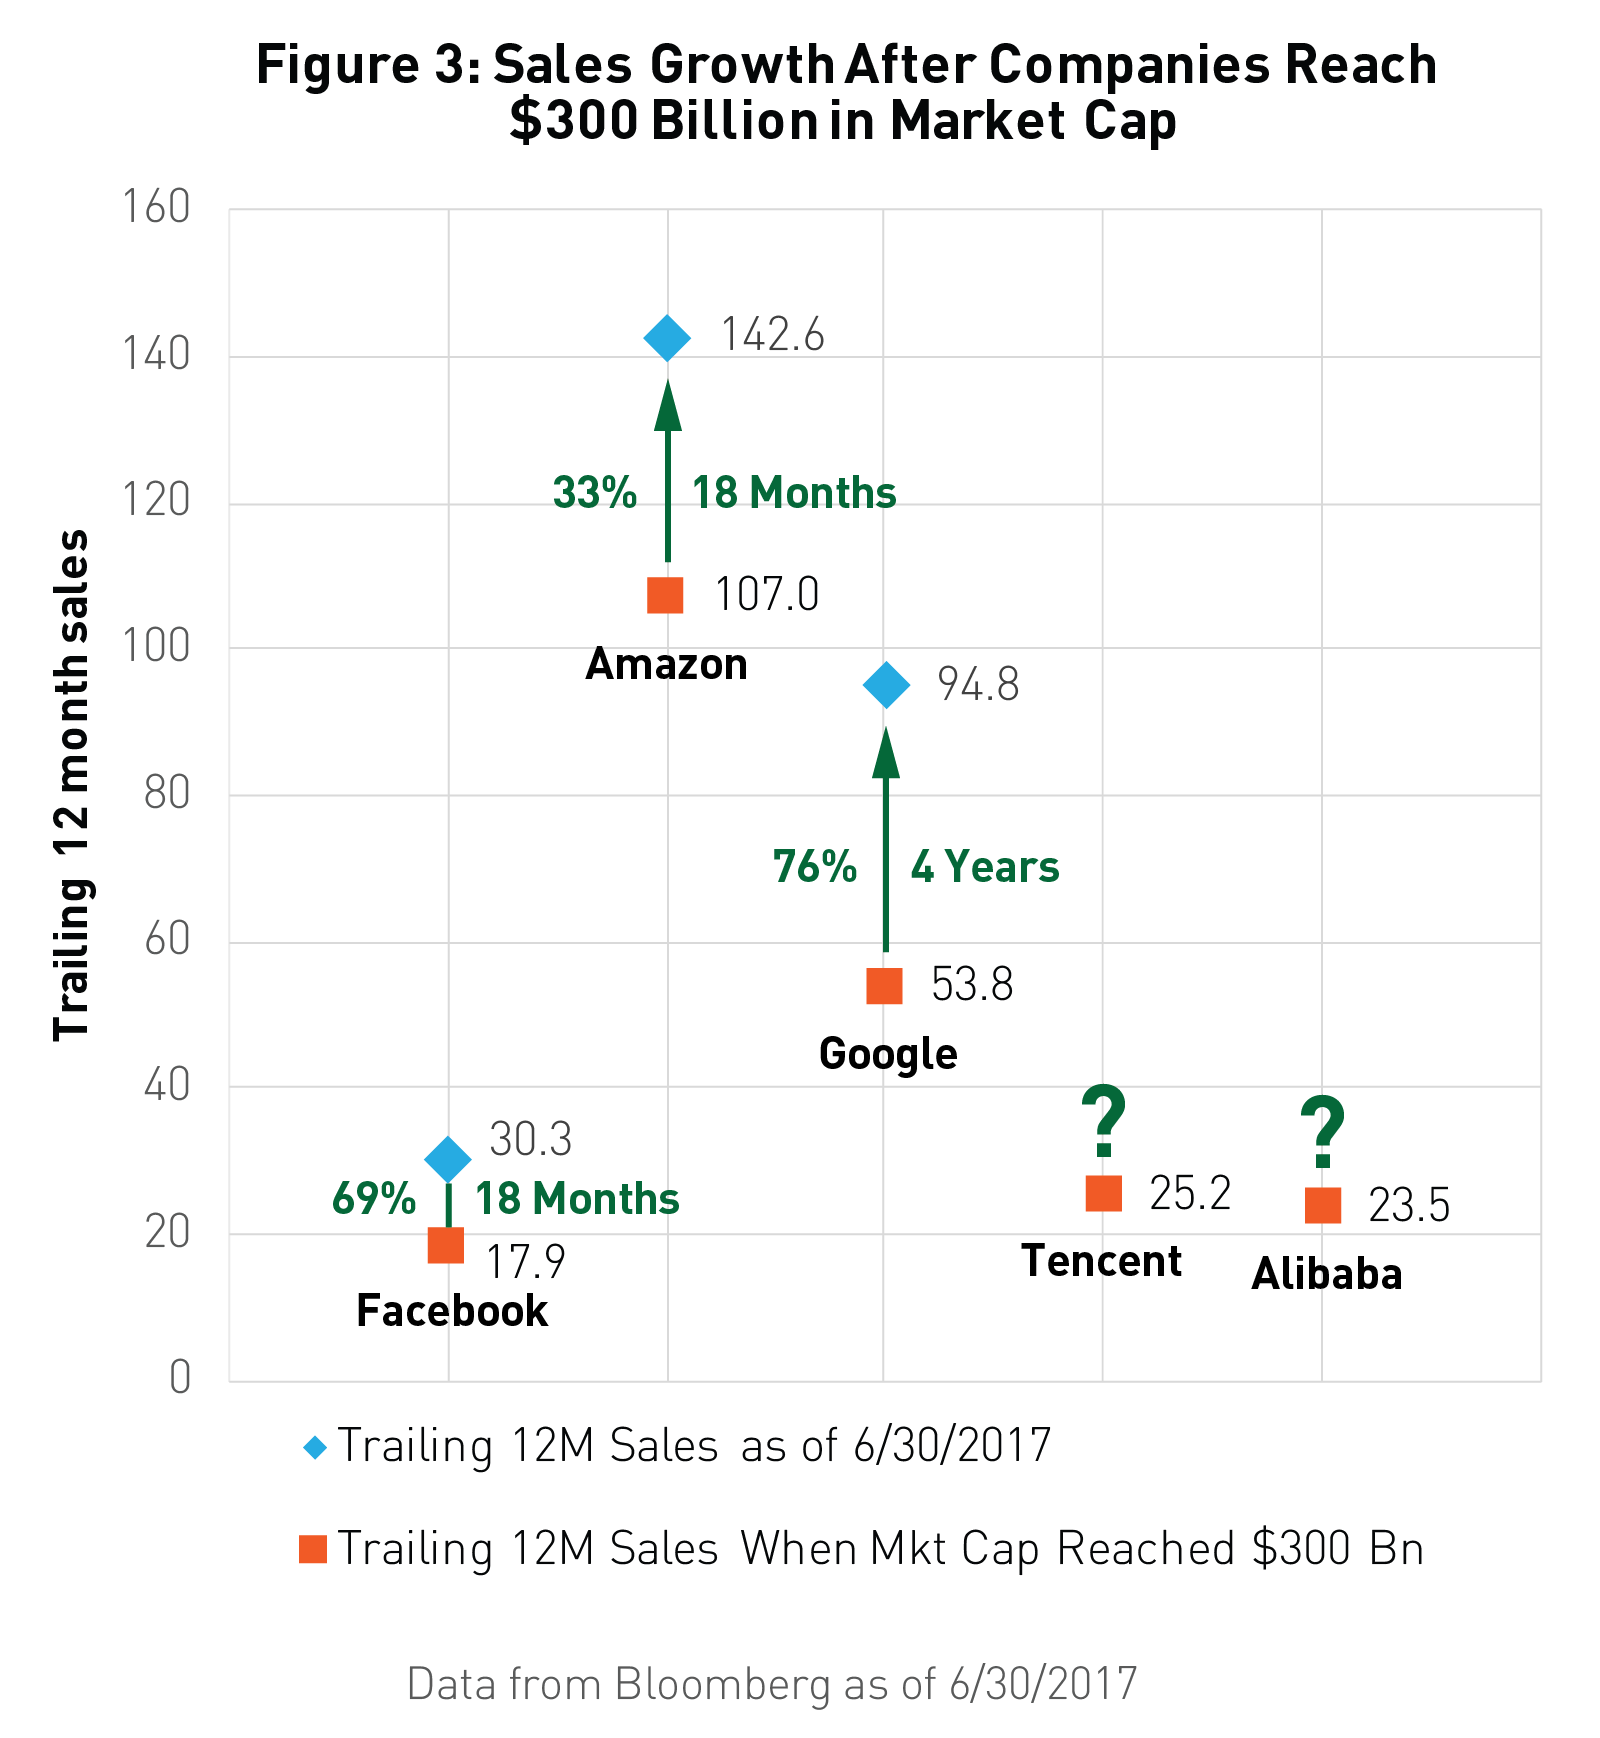
Additionally, Figure 3 shows how each company’s sales continued to grow after achieving $300 billion in market cap, ranging from 33% sales growth by Amazon to 76% sales growth by Google. Share prices have similarly continued to rise as the value of Google, Amazon, and Facebook’s stock prices increased by 102.8%, 51.0%, and 38.8% respectively6 from when they first reached $300 billion to June 30, 2017.
We believe that if China’s internet giants continue to follow a similar model as that of their US predecessors, there is potential for future growth. When taking China’s market and demographics into account, we believe that future could look even brighter.
China’s E-Commerce market size surpassed the US in 2014 and, by 2016, had reached a total market size of $749 billion7. As measured by the CSI Overseas China Internet Index, the sector has rallied more than 40% year to date8. Also, Alibaba and Tencent have the advantage of operating in a Chinese internet environment that is still developing. Today, only about half of China’s 1.3 billion citizens9 have access to the internet as opposed to 88.5% of the US population10. This means that, as China continues to develop and modernize, China’s internet penetration may also continue to grow and represent a significant market opportunity.
Surveying the globe for the next internet technology company with the right characteristics to join the $300B club, we believe that there could be a number of viable candidates in the China internet sector. For example, NetEase11 is a Chinese internet conglomerate that is lesser-known in the United States but is the second largest video game company in China12 (second only to Tencent) and was the seventh largest video game company in the world by revenue in 201613. While its market cap of $39.5 billion14 is about 9 times smaller than that of Alibaba and Tencent, NetEase’s net revenue rose 68% year over year in 201615, and it reached $5.7 billion in total sales in May 201716, only about 4 times less than the two Chinese tech leaders17.
We also cannot forget to mention China’s well-established search engine and online services provider, Baidu18, which some refer to as the “Google of China.” Baidu is currently China’s most popular search engine and is the fourth most visited site in the world19. It has begun positioning itself as a global leader in artificial intelligence (AI), having amassed a 1,700-person research team and spent about $3 billion on R&D over the past two and a half years20. It boasts an even bigger market cap than NetEase at $62.2 billion21 and had an annual revenue of $10.2 billion in 201622.
Maybe more of a long-shot contender for joining the $300B club is Momo Inc.23, a rising Chinese internet company which operates a popular social networking and live-streaming app. We include Momo on the list of contenders because of its rapid growth. Although it went public less than three years ago24, it already reached a market cap of $7.3 billion as of June 201725 and has 85.2 million monthly active users as of March 201726. So far, Momo has seen net revenues increase by 421% year over year27.
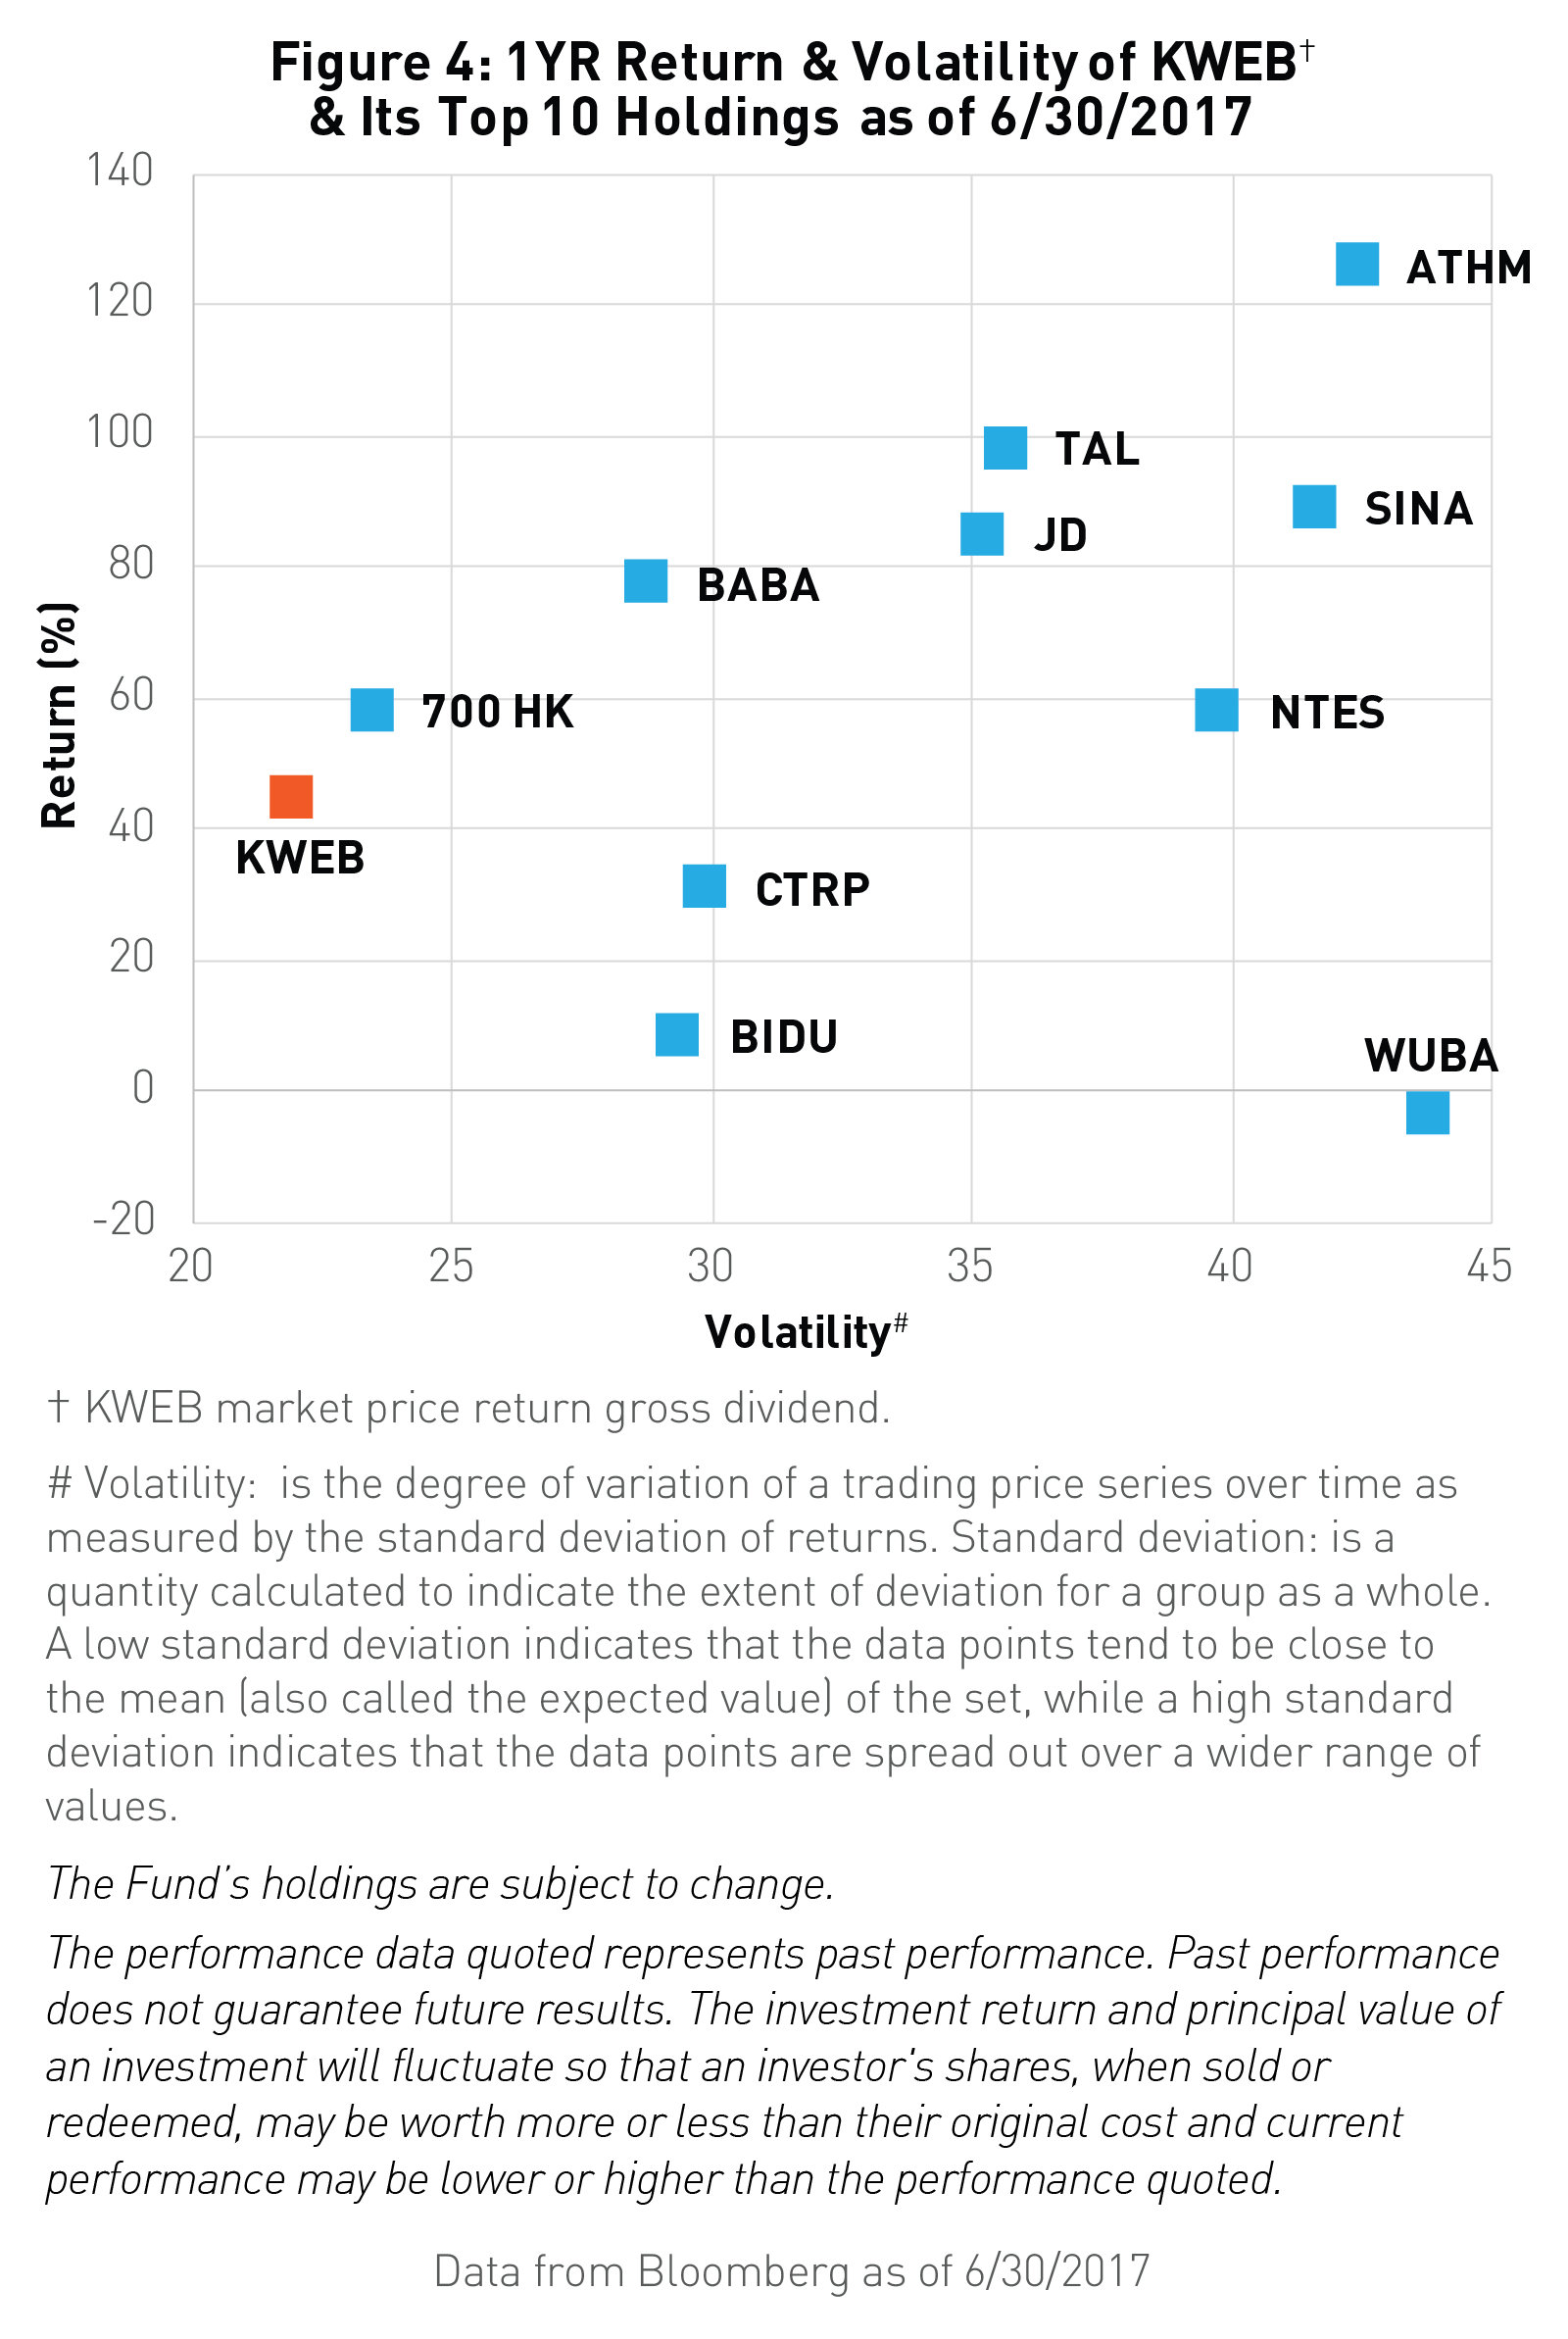
The KraneShares CSI China Internet ETF (KWEB) is an exchange traded fund offering strategic exposure to these trends and opportunities within China’s internet sector. KWEB holds Alibaba, Tencent, NetEase, Baidu, Momo, and 28 other Chinese internet stocks. We believe this basket approach to the China internet sector can take advantage of the growth potential of smaller companies like Momo while also minimizing volatility through holding larger companies like Alibaba and Tencent. This approach aims to provide maximum potential for growth while attempting to limit volatility. Figure 4 highlights how, over the past year, KWEB has delivered strong returns with less volatility than any single one of its holdings.
Reaching $300 billion in market capitalization is a huge achievement for any company. As firms like Google, Amazon, and Facebook have demonstrated, hitting this milestone does not mean that there is no more room for growth for Alibaba and Tencent. With that said, small-to-mid cap internet companies in China often provide strong potential for growth--but with corresponding volatility. We believe KWEB strikes an appropriate balance between large and small-to-mid cap companies while allowing investors to potentially benefit from the growth of the China internet sector as a whole.
View KWEB standard performance and performance as of most recent month end
View KWEB holdings as of most recent day end
This article is intended for educational purposes only and should not be construed as investment advice. All opinions or views expressed in this article are current only as of the date of this article and are subject to change without notice.
*Theses companies represent 0% of KraneShares net assets as of 6/30/2017
- Alibaba % of KWEB net assets as of 06/30/2017: 9.88%.
- Tencent % of KWEB net assets as of 06/30/2017: 11.04%.
- Data from Bloomberg as of 6/30/2017. Retrieved 7/3/2017.
- Data from Bloomberg as of 6/30/2017. Retrieved 7/3/2017.
- Data from Bloomberg as of 6/30/2017. Retrieved 7/3/2017.
- Data from Bloomberg as of 6/30/2017. Retrieved 7/3/2017.
- National Bureau of Statistics in China, “Total Retail Sales of Consumer Goods in December 2016” 1/22/2017. Note: Figures converted from Chinese Renminbi to USD.
- Data from Bloomberg as of 6/30/2017. Retrieved 7/3/2017. CSI Overseas China Internet Index: Represents the Chinese internet companies listed in overseas markets (New York and Hong Kong), in order to measure the performance of the Chinese internet companies listed outside mainland China.
- Data from the World Bank. Retrieved 6/28/2017.
- Internetlivestats.com as of 12/31/2016. Retrieved 6/28/2017.
- NetEase % of KWEB net assets as of 06/30/2017: 4%.
- Newzoo Research, Top Video Game Companies. Retrieved 7/3/2017.
- Newzoo Research, Top Video Game Companies. Retrieved 7/3/2017.
- Bloomberg. Retrieved 6/30/2017.
- Netease News Release, Fiscal Year 2016 Unaudited Financials
- Forbes 2017 Global 2000 World’s Largest Public Companies. Retrieved 6/30/2017.
- Forbes 2017 Global 2000 World’s Largest Public Companies. Retrieved 6/30/2017.
- Baidu % of KWEB net assets as of 06/30/2017: 7.76%.
- Alexa.com, Top 500 sites on the web. Retrieved 6/30/2017.
- Yue Wang, "Inside Baidu's Billion Dollar Push To Become An AI Global Leader", Forbes, 5/08/2017.
- Bloomberg. Retrieved 7/3/2017.
- Forbes 2017 Global 2000 World’s Largest Public Companies. Retrieved 6/30/2017.
- Momo, Inc. % of KWEB net assets as of 06/30/2017: KWEB: 3.9%.
- Momo Press Release, Pricing of Initial Public Offering
- Data from Bloomberg as of 6/30/2017. Retrieved 7/3/2017.
- Momo Unaudited Financial Results, First Quarter 2017.
- Momo Unaudited Financial Results, First Quarter 2017.
The KraneShares ETFs are distributed by SEI Investments Distribution Company (SIDCO), 1 Freedom Valley Drive, Oaks, PA 19456, which is not affiliated with Krane Funds Advisors, LLC, the Investment Adviser for the Fund. Additional information about SIDCO is available on FINRA’s BrokerCheck.