KVLE: Bridging The Value vs. Growth Divide in a Shifting Market
Investors old enough to remember how to hail a taxi or operate a rotary phone may also recall two rival schools of stock picking: Value and Growth.
A value investor would carefully construct a conservative estimate of a company’s worth. If he could buy the company’s shares for less than that number, he would do so. It might take a while, but the market will realize its mistake sooner or later and reprice the shares upward. In the meantime, the company would usually continue to make money. A high dividend was also appreciated as a useful cash flow sign that company management took shareholder interests seriously.
A growth investor, on the other hand, was less concerned with a company's current state of business than with what it could be in the future. To a growth investor, the most obvious way to spot companies whose share price is likely to increase is to look for companies whose profit is likely to increase. A high dividend was, if anything, a bad sign, suggesting a management that lacked vision and/or investment opportunities.
Back in the days when phones were used almost exclusively for vocal communication, value vs. growth became a sometimes bitter clash of philosophies. Value investors were cynical pessimists who assumed mere competence in corporate management, expected foolish emotion in rival investors, and distrusted the madness of crowds. According to the value believers, the growth team were not investors but mere “speculators.”
From a growth point of view, value investors had an unhealthy obsession with the worst-case scenario and a tendency to buy bad stocks that were cheap for a good reason. Growth investors were thoughtful optimists who believed in talented corporate management, the wisdom of crowds, and the unstoppable march of technology and economic growth.
Inevitably, value and growth began to be considered not just different strategies but different asset classes. Stocks were divided into value and growth buckets, and “style” indexes began to be published, giving observers an easy way to see the relative success of the rival camps. Russell maintains excellent value and growth indexes, including the Russell 1000 Value and Russell 1000 Growth, which represent the division of the most extensive 1000 US stocks into two equal-sized indexes by capitalization. Data goes back to 1978.
For decades, the long-run returns of these two Russell-style indexes were close to the same. On an annualized total return basis, over 38 years from December 31, 1978, to December 31, 2016, value edged out growth from 12.18% to 10.94%. This reassured those of us who are skeptical that all you need to beat the market is a simple value or growth strategy.
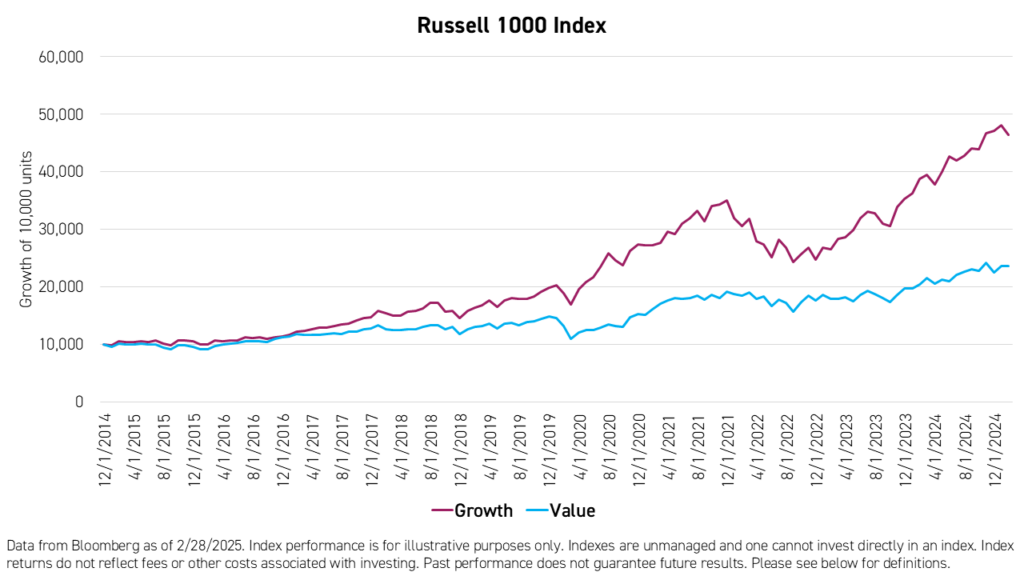
Then something changed. Over the eight years ending December 31, 2024, growth more than doubled value’s annualized return, 19.53% to 9.06%. It triumphed in seven calendar years, with 2022, when value declined less than growth in a down market, being the only exception.
To call this recent period unprecedented is an understatement. At the end of 2016, the price-to-earnings (P/E) ratios of the value and growth indexes were similar, 24.2 and 23.3, respectively. (Value is usually lower, of course. 2016 saw losses in the energy sector and a price run-up in the wake of Trump’s first election, which somewhat distorted the value calculations).1
At the end of 2024, the P/E ratios were 22.1 for value and 47.7 for growth.1 In other words, $100 invested in the value index will buy you $4.52 of annual corporate profits. The same investment in growth will get you $2.10 in profits.
As even the youngest investors will remember, the COVID-19 pandemic was the most significant macroeconomic event of these eight years. Generally, investors seek less risky havens, such as value stocks, in an uncertain crisis. In 2020, they sought safety in conservative stalwarts such as Alphabet, Meta, and Tesla.
Indeed, in 2025, the term growth can be a bit of a euphemism. The Magnificent Seven ended 2024, making up more than half (56%) of the Russell 1000 Growth Index. The market capitalizations of these stocks have become so large that they have crowded out more pedestrian companies from the index altogether. UnitedHealth Group, the 10th largest position (1.42%) in the growth index at the end of 2016, became the 4th largest position (1.77%) in the value index at the end of 2024.1
What is to be done now? Making the case that growth, which is to say the Magnificent Seven, is/are overpriced is not difficult. The wrinkle was that it was only a bit harder to make that case a year ago, two years ago, or even in 2016.
Still, with every relative success of growth over value, the growth profit you get for your $100 gets smaller. As the Magnificent Seven increasingly becomes its asset class, the rubber band becomes more stretched. The current situation may not have close historical parallels, but the logical conclusion that the rubber band must someday snap back is unavoidable.
An investor who foresaw a near-term catalyst for disaster might liquidate his positions and go to cash. In the absence of such a prediction, and remembering what COVID-19 taught about the predictability of market reactions to cataclysms, staying invested but reducing exposure to “growth” is likely more prudent.
KVLE: Have Your Cake & Eat It Too
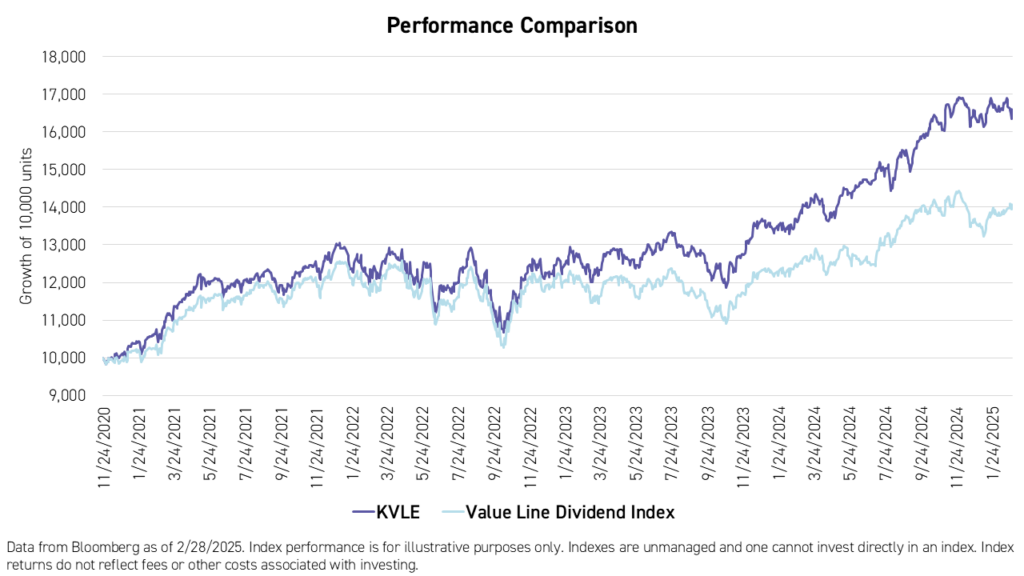
The KraneShares Value Line® Dynamic Dividend Equity ETF (Ticker: KVLE) is a value-oriented core fund that emphasizes higher dividends, stable stocks, and risk control. KVLE's methodology, which incorporates both Value Line®'s SafetyTM and TimelinessTM rankings, maintains meaningful exposure to growth stocks despite its value bias. This has led the Fund to outperform the Value Line Dividend Index, which considers only Value Line®'s Safety rankings, significantly since its inception in November, 2020.
The performance data quoted represents past performance. Past performance does not guarantee future results. The investment return and principal value of an investment will fluctuate so that an investor’s shares, when redeemed or sold, may be worth more or less than the original cost. Current performance may be lower or higher than the performance quoted. For performance data current to the last month-end, please visit www.kraneshares.com/etf/kvle.
KVLE is ranked in the top decile in the Morningstar US Fund Large Value peer group, which includes 1,124 ETFs and mutual funds, based on annualized returns for the past three years as of February 28, 2025.** KVLE also has a 5-star Overall Morningstar Rating.*
The Overall Morningstar RatingTM is based on the risk-adjusted returns out of 1,124 funds in the Morningstar category US Large Cap Value category as of 2/28/2025.
KVLE's approach also results in a significantly different sector distribution compared to the Value Line® Dividend Index, one which more closely mirrors that of the S&P 500 Index.
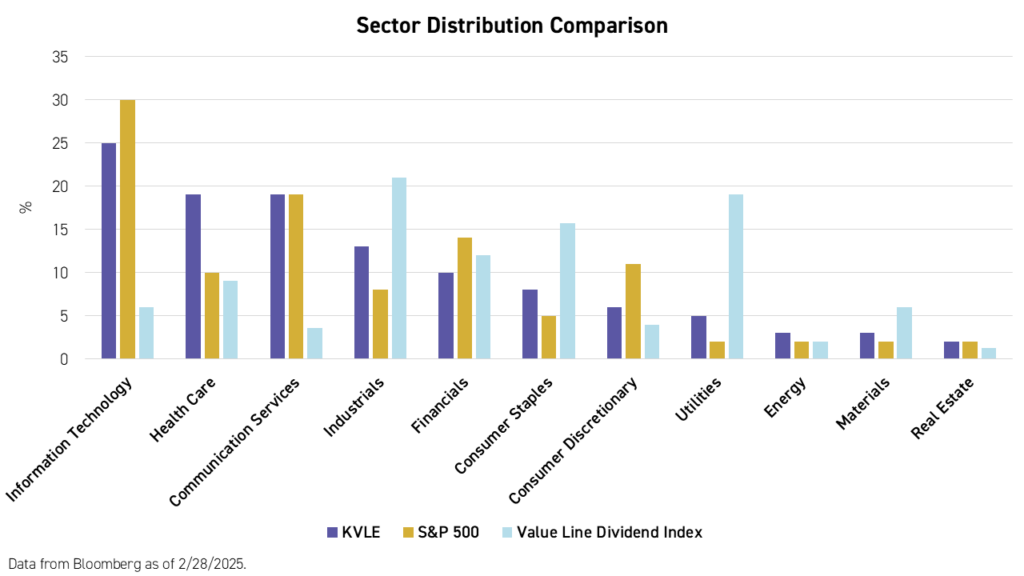
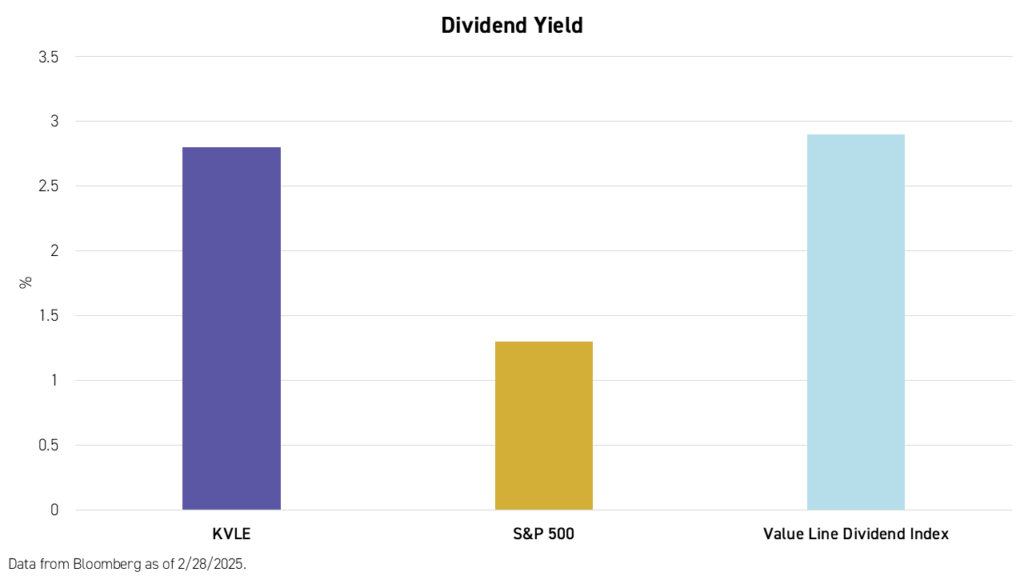
Despite a more growth-oriented sector distribution, KVLE maintains a dividend yield of 2.8% (30-day SEC yield is 2.16% as of 2/28/2025), which is higher than the S&P 500's 1.3%, and only slightly lower than the Value Line® Dividend Index's 2.9%.2
Conclusion
For most of the history of American stock markets, growth and value stock picking strategies had their respective roles to play. Today, they are considered two distinct asset classes that can be allocated to based on current market conditions, investment objectives, or current beliefs about the market. Although growth stocks have significantly outperformed value stocks since 2016, this has been unprecedented and is unlikely to continue to be the norm over the long-term. At the same time, we believe investors still risk missing out if they decide to overweight value. We believe the KraneShares Value Line® Dynamic Dividend Equity ETF (Ticker: KVLE) solves for this dilemma by always maintaining a meaningful exposure to growth stocks while still keeping a "ballast" of high dividend-paying, value-oriented stocks, the weight to which is adjusted based on Value Line's rankings for both SafetyTM and TimelinessTM.
For KVLE standard performance, top 10 holdings, risks, and other fund information, please click here.
The Value Line® SafetyTM Ranking is based on historical data and applies to the underlying securities of the fund, and not the fund itself. Past performance is no guarantee of future results. SafetyTM does not imply stocks cannot lose value. All investing involves risk including the potential loss of principal.
Citations:
- Data from Bloomberg.
- Data from Bloomberg as of 2/28/2025.
*The Morningstar RatingTM for funds, or "star rating," is calculated for managed products with at least a three year history and does not include the effect of sales charges. Exchange-traded funds and open-end mutual funds are considered a single population for comparative purposes. It is calculated based on a Morningstar Risk-Adjusted Return measure that accounts for variation in a managed product's monthly excess performance, placing more emphasis on downward variations and rewarding consistent performance. The top 10% of products in each product category receive 5 stars, the next 22.5% receive 4 stars, the next 35% receive 3 stars, the next 22.5% receive 2 stars, and the bottom 10% receive 1 star. The Overall Morningstar Rating is derived from a weighted average of the performance figures associated with its three-, five-, and 10-year (if applicable) Morningstar Rating metrics. The Morningstar RatingTM for funds, or "star rating,” is calculated for managed products (including mutual funds, variable annuity, variable life subaccounts, exchange-traded funds, closed-end funds, and separate accounts) with at least a three-year history. Exchange-traded funds and open-ended mutual funds are considered a single population for comparative purposes. It is calculated based on a Morningstar Risk-Adjusted Return measure that accounts for variation in a managed product's monthly excess performance, placing more emphasis on downward variations and rewarding consistent performance. The Morningstar Rating does not include any adjustment for sales load. The top 10% of products in each product category receive 5 stars, the next 22.5% receive 4 stars, the next 35% receive 3 stars, the next 22.5% receive 2 stars, and the bottom 10% receive 1 star. The Overall Morningstar Rating for a managed product is derived from a weighted average of the performance figures associated with its three-, five-, and 10-year (if applicable) Morningstar Rating metrics. The weights are: 100% three-year rating for 36-59 months of total returns, 60% five-year rating/40% three-year rating for 60-119 months of total returns, and 50% 10-year rating/30% five-year rating/20% three-year rating for 120 or more months of total returns. While the 10-year overall star rating formula seems to give the most weight to the 10-year period, the most recent three-year period actually has the greatest impact because it is included in all three rating periods.
The KraneShares Value Line Dynamic Dividend Equity Index ETF was rated against the following numbers of U.S.-domiciled US Large Cap Value Funds over the following time periods and received the following Morningstar Rating(s): For the three-year period, the fund was rated against 1,124 funds and received a Morningstar Rating of 5 stars. Past performance is no guarantee of future results.
**Morningstar Percentile Rankings are based on the Fund's annualized return (excluding sales charge) relative to all the funds in the same Morningstar category, where 1 is the highest and 100 is the lowest percentile rank. Ratings and rankings are one measure of performance. Past performance is no guarantee of future results. The KraneShares Dynamic Dividend Equity Index ETF was rated against 1,125 U.S.-domiciled US Fund Large Value funds based on annualized return over the following periods ending February 28, 2025: top 6% rank among 1,183 funds in the 1-year period, top 9% rank among 1,124 funds in the 3-year period
© 2025 Morningstar, Inc. All Rights Reserved. The information contained herein: (1) is proprietary to Morningstar and/or its content providers; (2) may not be copied or distributed; and (3) is not warranted to be accurate, complete, or timely. Neither Morningstar nor its content providers are responsible for any damages or losses arising from any use of this information. Past performance is no guarantee of future results.
Definitions:
Price-to-Earnings (P/E) Ratio: A measure of the degree to which a stock is undervalued or overvalued relative to its earnings per share (EPS). It is calculated by dividing the market price of the stock by its EPS.
Earnings Per Share (EPS): The amount of total profit a company receives from selling goods and/or services divided by the number of shares outstanding.
Dividend Yield: The total amount of dividends paid per year, based on the trailing twelve (12) months, expressed as a percentage of the current share price or index level.
S&P 500 Index: The S&P 500 Index is widely regarded as the best single gauge of large-cap U.S. equities. There is over USD 9.9 trillion indexed or benchmarked to the index, with indexed assets comprising approximately USD 3.4 trillion of this total. The index includes 500 leading companies and covers approximately 80% of available market capitalization. The index was launched on March 4, 1957.
Russell 1000 Value Index: The Russell 1000® Value Index measures the performance of the largecap
value segment of the US equity universe. It includes those Russell 1000 companies with relatively lower price-to-book ratios, lower I/B/E/S forecast medium term (2 year) growth and lower sales per share historical growth (5 years). The Russell 1000® Value Index is constructed to provide a comprehensive and unbiased barometer for the large-cap value segment. The index is completely reconstituted annually to ensure new and growing equities are included and that the represented companies continue to reflect value characteristics. The index was launched on January 1, 1984.
Russell 1000 Growth Index: The Russell 1000® Growth Index measures the performance of the large cap growth segment of the US equity universe. It includes those Russell 1000 companies with relatively higher price-to-book ratios, higher I/B/E/S forecast medium term (2 year) growth and higher sales per share historical growth (5 years). The Russell 1000® Growth Index is constructed to provide a comprehensive and unbiased barometer for the large-cap growth segment. The index is completely reconstituted annually to ensure new and growing equities are included and that the represented companies continue to reflect growth characteristics.
Value Line Dividend Index: The index begins with the universe of stocks that Value Line® gives a SafetyTM Ranking of #1 or #2 using the Value Line® SafetyTM Ranking System. All registered investment companies, limited partnerships and foreign securities not listed in the U.S. are removed from this universe. From those stocks, Value Line® selects those companies with a higher than average dividend yield, as compared to the indicated dividend yield of the Standard & Poor's 500 Composite Stock Price Index. Value Line® then eliminates those companies with an equity market capitalization of less than $1 billion. The index seeks to be equally weighted in each of the securities in the index. The index is rebalanced on the application of the above model on a monthly basis. The index methodology is periodically reviewed.
30-Day SEC Yield: A standard yield calculation developed by the U.S. Securities and Exchange Commission (SEC) that allows for fairer comparisons of funds. It reflects the fund's earnings from dividend and interest payments, minus expenses, annualized to present a percentage of the fund's net asset value (NAV).