Beyond The Buffer Boom: KSPY
By  Cole Wenner
Buffer strategies have experienced notable investor interest amid the 2025 bout of equity market volatility, as market participants adopt a more defensive stance. Assets in Structured Outcome ETFs are approaching $65 billion and a recent note from BlackRock projected growth to $650 billion by 2030.1 Despite this setup, some question the success, with AQR Capital Management recently highlighting that the majority of these allocation styles have underperformed vanilla portfolios over the past five years, labeling the space “an investment failure.”2
Against this backdrop, KraneShares partnered with Hedgeye Asset Management to launch the KraneShares Hedgeye Hedged Equity Index ETF (Ticker: KSPY). KSPY aims to enhance the strategies deployed by incumbent “Hedged” (KSPY's category) or “Buffered” (also known as "defined outcome") products through the dynamic adjustment of portfolio delta, as determined by a systematic framework based on Hedgeye’s Risk Range™ Signals.
Equity Market Uncertainty Has Re-emerged to Start 2025
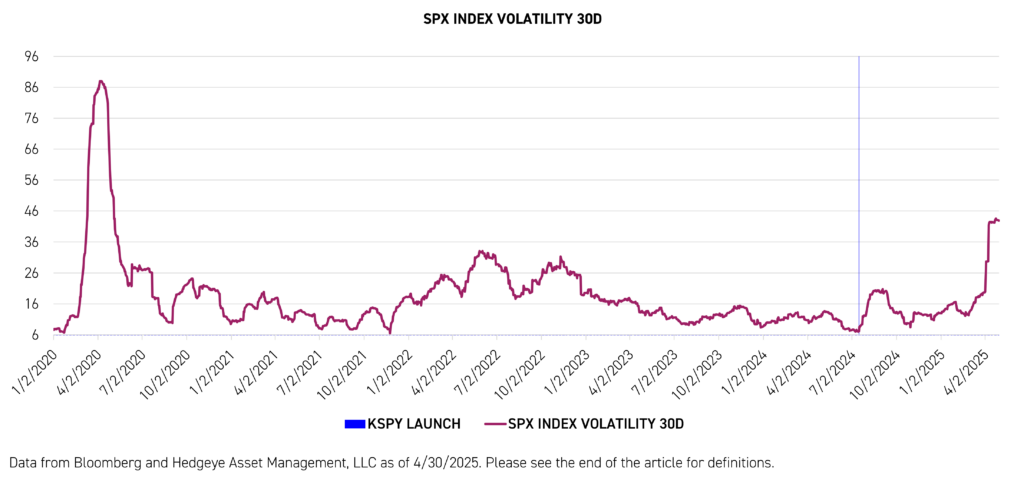
The month of April saw equity market volatility hit levels not seen since the first half of 2020, as uncertainty regarding tariffs, inflation, Fed policy and a potential economic slowdown weighed on investor confidence. The S&P 500 declined by -18.75%3 during its peak to trough drawdown from February 19th 2025 to April 8th 2025, while KSPY returned -11.67%3. Comparing volatility statistics during the same period, the S&P 500’s annualized volatility was 26.47%, while KSPY’s was 18.99%.4 “The strategy clearly accomplished its goals of actively reducing volatility and providing downside risk management during this highly volatile period,” said John McNamara, CIO of Hedgeye Asset Management, “as uncertainty persists, process rather than narrative must dictate decisions, and Hedgeye’s Risk Range™ Signals allow the strategy to do exactly that.”
The performance data quoted represents past performance. Past performance does not guarantee future results. The investment return and principal value of an investment will fluctuate so that an investor’s shares, when redeemed or sold, may be worth more or less than the original cost. Current performance may be lower or higher than the performance quoted. For performance data current to the last month-end, please visit kraneshares.com/etf/kspy.
Are Buffered ETFs the Solution?
While buffer ETFs have gained popularity, given their ability to tailor risk vs reward for particular tolerances over a defined time period, they come with several disadvantages. “Clients currently utilizing buffer strategies often express frustration regarding being 'capped out' during periods of significant market advances,” said John McNamara, “other investors considering buffer strategies indicate that similar returns are achievable through allocating a portion of equity holdings to cash or T-bills.”
These investors are not alone in highlighting these limitations. Recently AQR Capital Management presented data that 72% of funds in the Morningstar Equity Hedged (Global Category Options Trading), Defined Outcome, or Derivative Income categories with returns available from January 1, 2020, to January 31, 2025 produced worse cumulative returns as well as drawdowns when compared to a portfolio holding the S&P 500 and T-bills.2
Timing also presents an issue, as most buffer ETFs operate on a set 12-month 'outcome period', with buffers and caps set at the beginning then only reset annually. Investors who don’t buy at the start of the outcome period or who sell before its conclusion may experience differing results to those described in fund documents, sometimes receiving less downside protection or lower upside participation.
What Makes KSPY Different?
Despite the limitations discussed in this article as well as others, buffered ETFs continue to see asset growth and investor interest. This raises the question: Is there a better way to participate in equity market upside while avoiding or cushioning the degree of drawdowns? KSPY offers an alternative.
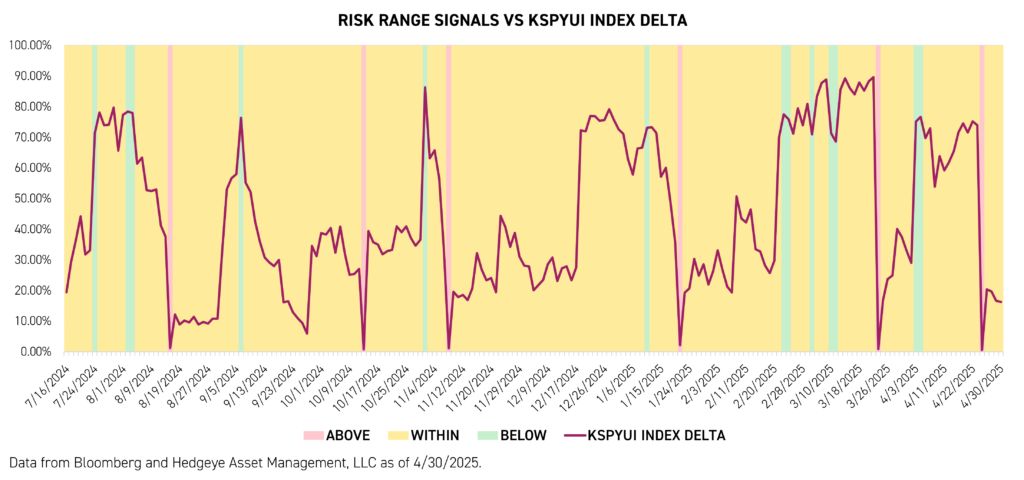
KSPY’s alternative approach is driven by its utilization of Hedgeye’s Risk Range™ Signals, ability to toggle between three unique options strategies and systematic implementation. Hedgeye’s Risk Range™ Signals are based on a model that analyzes price, volume and volatility, with the goal of identifying price entry and exit points. Since publication began in 2015, the S&P 500 has closed within its daily published Risk Range™ 83% of the time. KSPY’s options strategy is determined by the S&P 500’s position relative to these Risk Range™ Signals, with the ability to adjust as frequently as daily and no less than once every three weeks.
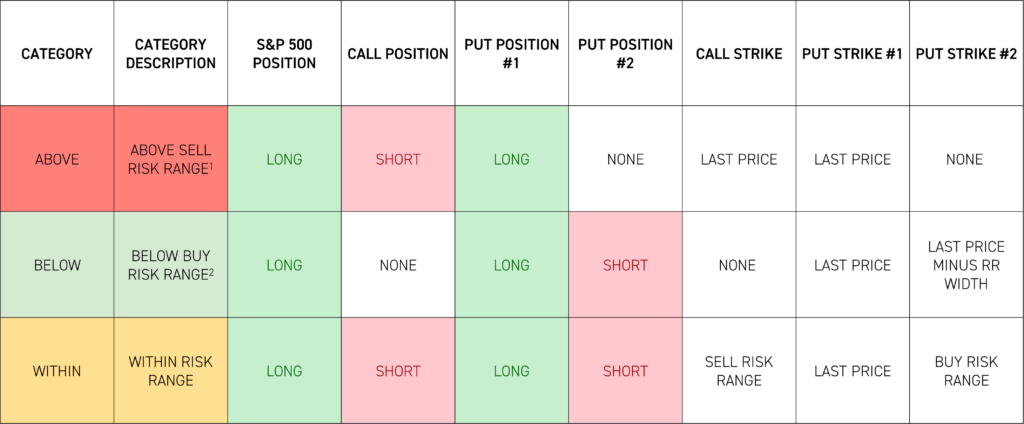
This allows KSPY to systematically adjust portfolio delta, moving towards full equity exposure when market conditions are favorable and reducing exposure when adverse.
- When the S&P 500 is near or below the buy Risk Range™, KSPY’s portfolio delta moves toward 100%, maximizing upside participation.
- When the S&P 500 is near or above the sell Risk Range™, the delta moves toward 0%, prioritizing downside protection.
Unlike traditional buffer ETFs, which require investors to monitor outcome periods and accept static buffers and caps, KSPY does the work for you. KSPY automatically responds to changing market conditions, seeking to maximize upside participation when appropriate and to minimize downside capture when conditions are adverse. This flexibility is particularly valuable in today’s fast-moving markets, where risks and opportunities can shift rapidly.
Performance and Risk Management
By leveraging Hedgeye’s proprietary Risk Range™ Signals and adjusting exposure dynamically, KSPY provides a more responsive and adaptive solution. This helps investors stay invested in U.S. equities over the long term while proactively managing risk in real time.
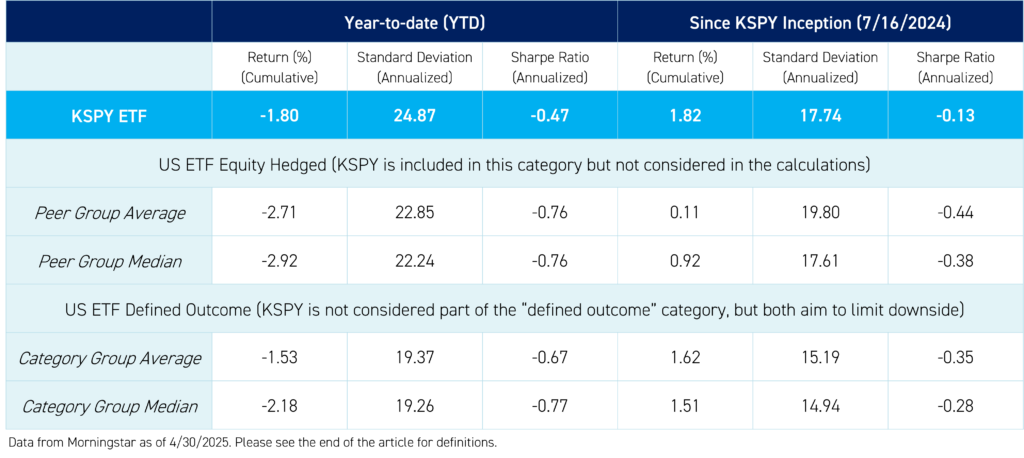
Since its inception on 7/16/24, KSPY has returned 2.00%, compared to the S&P 500 Index’s drop of -0.73% over the same period.4 KSPY has not only outperformed the index but also achieved its goal of reducing volatility, with annualized volatility of 14.06% versus 22.05% for SPY.4 The fund has also demonstrated effective downside risk management, with a downside capture of 53.73%, while still maintaining an upside capture of 55.93% relative to SPY (data from Morningstar and Hedgeye Asset Management LLC as of 4/30/2025).4
Conclusion
The KraneShares Hedgeye Hedged Equity Index ETF (Ticker: KSPY) provides a differentiated approach for investors seeking to deploy capital in U.S. equities, participate in market upside, and manage downside risk. Its systematic, dynamic adjustment of portfolio delta, guided by Hedgeye’s Risk Range™ Signals, offers a more flexible alternative to traditional buffered ETFs, which are often constrained by periodic rebalancing and capped gains. We believe KSPY is a potential solution for investors navigating today’s volatile markets and may serve as a valuable tool for balancing growth potential with risk management.
For KSPY top 10 holdings, risks, and other fund information, please click kraneshares.com/etf/kspy.
Citations:
- Data from "BlackRock Sees Outcome ETFs Jumping to $650 Billion by 2030," Bloomberg, as of 3/27/2025.
- Data from AQR Capital Management and Bloomberg as of 3/25/2025.
- Data from Bloomberg as of 4/30/2025.
- Data from Bloomberg and Hedgeye Asset Management, LLC as of 4/30/2024.
Index definitions:
Hedgeye Hedged Equity Index (Ticker: KSPYUI Index): The Hedgeye Hedged Equity Index provides exposure to the S&P 500 while actively reducing volatility and providing downside risk management. The Index is managed by Hedgeye Asset Management, LLC and utilizes a model based on Hedgeye’s proprietary Risk Range™ Signals that analyze the daily trading range of the S&P 500. The Index toggles between three options strategies based on where the S&P 500 falls within these ranges. These options strategies are intended to provide downside risk management, option income, and potential compensation for the loss of upside. Depending on market conditions, the Index can change options strategies as frequently as daily.
S&P 500 Index (Ticker: SPX Index): The S&P 500 is a stock market index that tracks the stock performance of 500 of the largest companies listed on stock exchanges in the United States.
SPX Index Volatility 30d: The 30-day volatility of the S&P 500 Index (SPX), often measured as the annualized standard deviation of daily returns over the past 30 days.
Definitions:
Portfolio delta: A measure of how sensitive a portfolio's value is to changes in the price of the underlying assets. It's a key tool for managing risk and assessing portfolio performance in different market conditions.
Standard deviation: Standard deviation is a statistical measure of the dispersion or variability of a set of values relative to their mean. In finance, it is commonly used to quantify the risk or volatility of an asset or portfolio—higher standard deviation indicates greater variability in returns, while lower standard deviation means returns are more consistent.
Sharpe ratio: The Sharpe ratio is a measure of risk-adjusted return. It compares the excess return of an investment (the return above a risk-free rate) to its standard deviation (volatility).
US ETF Hedged Equity: A US ETF equity hedged strategy involves an exchange-traded fund (ETF) that invests in US equities (stocks) while also employing hedging techniques to reduce downside risk.
US ETF Defined Outcome: A US ETF defined outcome is an ETF structured to provide investors with a predetermined range of potential returns (both upside and downside) over a specific period, such as one year.