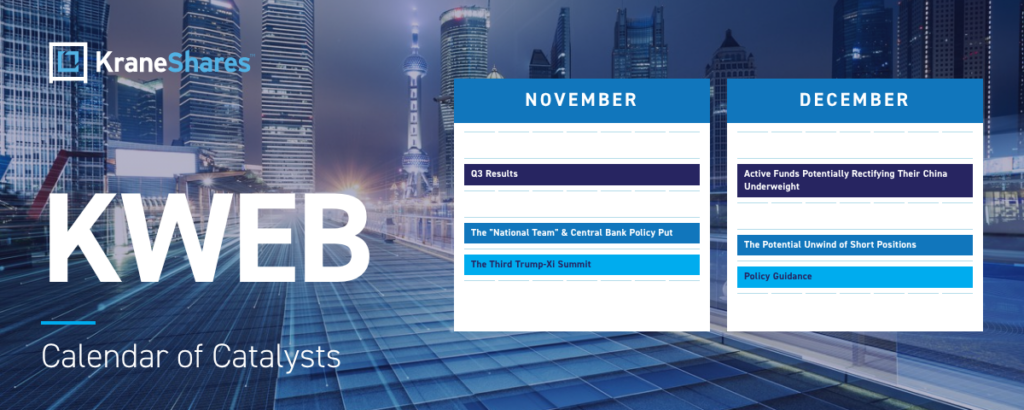
KWEB: A Calendar of Catalysts
By  Brendan Ahern
Executive Summary
- We believe Hong Kong-listed internet stocks may benefit from a series of catalysts that could unfold over the next three months and support the rotation out of AI supply-chain heavy markets like Korea and Taiwan.
- Strong Q3 financial results, expected to be reported this month with favorable base effects, and broad stock market support efforts by state-controlled investment firms and China's central bank are the most immediate catalysts.
- Positioning in China remains low, and positive geopolitical signals, including a third meeting between Presidents Trump and Xi later this month, may also help support a rotation back into China through Hong Kong stocks.
- Looking forward into next year, potential spin offs of subsidiaries of Alibaba, Baidu, and Kuaishou through IPOs could also contribute to a re-rating of China's internet ecosystem.
Catalyst Summary
- November:
- Internet Stocks' Q3 Financial Results, Driven by Strong Year-over-year (YoY) Comparisons
- The "National Team" & Central Bank Policy Put
- The Third Trump-Xi Summit
- December:
- Active Funds Potentially Rectifying Their China Underweight
- The Potential Unwind of Short Positions.
- Policy Guidance
- Q1 2027:
- Potential Spin-offs From Alibaba, Baidu, & Kuaishou
- Ongoing:
- The Potential End of The 17-Year Outperformance of US Equities
Introduction
We believe a rotation out of the hardware-heavy markets of Japan, Taiwan, and Korea could propel Hong Kong-listed internet stocks higher.
While we are believers in artificial intelligence as a transformational technology, investors remain significantly overweight to the AI supply chain. This led to highly concentrated positions in Korea, Taiwan, and Japan. The crowded positioning, despite the strong potential of AI, became problematic in the recent market sell-off.
Hong Kong-listed internet stocks, on the other hand, have been significant underweights for investors lately. As such, we believe we are beginning to see a rotation into these stocks, which are well represented within our China Internet ETF the KraneShares CSI China Internet ETF (Ticker: KWEB).
We believe there are 8 key potential catalysts for KWEB, many of which could take place over the next three months:
1. November: Internet Stocks Q3 Financial Results, Driven by Strong Year-over-year (YoY) Comparisons
The first catalyst is a year-over-year recovery in E-Commerce companies' net income and earnings per share (EPS). As falling property prices strained Chinese household balance sheets, companies competed for market share in a shrinking market, fueling a costly, subsidy-driven war for high-spending urban customers. To compete, E-Commerce firms battled each other with shorter delivery times for merchandise and food, at ever increasing costs.
As a result of the fierce competitive landscape, the previously profitable Meituan, which had always been focused on food delivery and so-called "quick commerce" posted losses for three consecutive quarters as it battled JD.com's new competitive and super-fast service and, to a lesser extent, Alibaba's Ele.me food delivery and local services app. Regulators intervened to protect restaurant owners, as delivery subsidies began to reduce in-restaurant dining, restaurant earnings, and employment.
Since regulatory intervention ended the delivery war earlier this year, we believe Meituan and JD.com could see significant year-over-year improvements in net income and EPS in their Q3 earnings.
EPS & Estimates: Meituan & JD.com
Data from Bloomberg as of 9/30/2026. Estimates through 12/31/2027 are sourced from Bloomberg. Estimates for 2028 are calculated by KraneShares using certain market assumptions. Visual created by KraneShares. EPS growth uses year-over-year comparisons of quarterly periods. Figures are adjusted (non-GAAP). Holdings are subject to change. See below for KWEB top 10 holdings as of 10/31/2026. Please see below for definitions. Estimates are forward-looking, are not guaranteed, and actual results may differ materially.
Meanwhile, we believe Q3 earnings for Tencent and Alibaba could include some positive and unexpected announcements. In our opinion, few companies are better positioned to launch a product similar to Meta's vastly popular Muse AI agent than Alibaba and Tencent due to their significant audience of platform users. Tencent has been beta testing its Muse-like Xiaowei AI agent and Alibaba has likewise been testing its Qwen Intelligence product for more agentic use cases. Such a release may support their share prices. Meta's stock gained 9% on September 9th,1 the day after it released Muse.
Ultimately, over the past year, investors have focused mainly on the companies directly benefiting from hyperscalers' demand for chips. Funding the investment in these companies has come at the expense of non-AI supply chain markets, such as Hong Kong and India. Investors have therefore given little credence to the role of cloud computing in China's AI monetization model. Globally, we believe markets have punished high-spending hyperscalers like Meta and Alibaba, while owning the recipients of that capital expenditure. The Hong Kong-listed Alibaba, Tencent, and Baidu, along with the privately-held Huawei, control most of China's cloud computing market.2
2. November: The "National Team" & Central Bank Policy Put
We recently released our take on China's Renewed Stock Market Support, discussing the efforts by the "National Team", i.e. investment firms associated with China's sovereign wealth, and the central bank to support the stock market.
Historically, these onshore efforts have led to rallies in KWEB and other China ETFs.
China ETF Performance
Starting February 6, 2024, Following Huijin Adding to Holdings Announcement
| Performance (%) | |||||
|---|---|---|---|---|---|
| Ticker | Fund | 1 Mo | 3 Mo | 6 Mo | 12 Mo |
| Date Range2/6/24 to: | 2/6/2024 – 3/6/20243/6/24 | 2/6/2024 – 5/6/20245/6/24 | 2/6/2024 – 8/6/20248/6/24 | 2/6/2024 – 2/6/20252/6/25 | |
| KWEBChina Internet | China Internet | 1.66% | 23.36% | 5.47% | 33.71% |
| KSTRChina Semiconductor & Technology | China Semiconductor & Technology | 12.98% | 8.82% | -0.97% | 29.55% |
| KBATop 50 A Shares | Top 50 A Shares | 6.17% | 13.75% | 6.57% | 17.97% |
Starting September 24, 2024, Following RMB 500 Billion Swap Facility & RMB 300 Billion Re-Lending Facility
| Performance (%) | |||||
|---|---|---|---|---|---|
| Ticker | Fund | 1 Mo | 3 Mo | 6 Mo | 12 Mo |
| Date Range9/24/24 to: | 9/24/2024 – 10/24/202410/24/24 | 9/24/2024 – 12/24/202412/24/24 | 9/24/2024 – 3/24/20253/24/25 | 9/24/2024 – 9/24/20259/24/25 | |
| KWEBChina Internet | China Internet | 10.48% | 7.62% | 29.00% | 67.11% |
| KSTRChina Semiconductor & Technology | China Semiconductor & Technology | 37.08% | 39.34% | 45.62% | 113.39% |
| KBATop 50 A Shares | Top 50 A Shares | 12.46% | 9.11% | 9.02% | 19.02% |
Data from Bloomberg was retrieved on 11/12/2026. Performance measured from 2/6/2024 and 9/24/2024, respectively. Performance shown is total return using closing price. KSTR performance from 9/24/2024 to 9/24/2025 is unusually high and was driven by significant financial support from the government. These conditions are not guaranteed to be sustained over any period. Visual created by KraneShares.
The performance data quoted represents past performance. Past performance does not guarantee future results. The investment return and principal value of an investment will fluctuate so that an investor’s shares, when redeemed or sold, may be worth more or less than the original cost. Current performance may be lower or higher than the performance quoted. For KWEB performance data current to the most recent month-end, please visit kraneshares.com/etf/kweb. For KSTR performance data current to the most recent month-end, please visit kraneshares.com/etf/kstr. For KBA performance current to the most recent month-end, please visit kraneshares.com/etf/kba.
3. November: The Third Trump-Xi Summit
We have observed an improvement in U.S.-China relations following two summits earlier this year. Presidents Trump and Xi may also have an opportunity to meet at the Asia-Pacific Economic Cooperation conference in Shenzhen on November 18th and 19th.6 We believe additional dialogue or trade developments between the two countries could support investor sentiment. The G-20 Leaders Summit in Miami on December 14th and 15th may provide another opportunity for the two leaders to meet.7
Despite the recent US mid-term elections, President Trump and the Executive Branch exert significant control over trade policy. We believe further trade deals could be announced between the two countries, forming a powerful potential catalyst for sentiment.
4. December: Active Funds Potentially Rectifying Their China Underweight
We believe US-based active global fund managers might be taking losses in China this year to offset gains in other parts of their portfolios. The majority of US mutual funds have a tax year that ends in October. This may help explain some of the exacerbated pressure on Hong Kong-listed stocks in recent months. However, in our opinion, the majority of tax loss-driven selling pressure may have concluded in October, removing a significant headwind for the Hong Kong market. At the same time, some funds may choose to reallocate if they see momentum, given that many already had their China exposure at all-time lows.
According to Copley Fund Research, actively-managed global funds currently have an average weight to China of 2.5%, as of the end of October.8 That has improved from March 2024's weight of 2.0%, but remains below the high of 5.3% in October of 2020.8 Shockingly, nearly one-fifth of global funds have no exposure whatsoever to the world's second largest economy.8 Even active managers focused on emerging markets (EM) have their China exposure at all-time lows. Active EM funds' exposure to Greater China at the end of October was at only 18.8%, its lowest level since 2014.8 We can compare that to the all-time high level of 37.4%, which was reached in October of 2020.8
Global Funds’ Current China Allocations
Data from Copley Fund Research as of 10/31/2026. Funds invested % indicates the share of funds in the scope of this survey that are invested in China. The average weight versus the index represents how over- or underweight the fund group is relative to their stated benchmark index. Please see the end of the presentation for definitions. Visual created by KraneShares using data from Copley Fund Research.
5. December: The Potential Unwind of Short Positions.
With investors focused on the AI supply chain, Hong Kong's market has seen a significant uptake in short selling activity. Low ownership has only exacerbated the issue, leading mechanical short-selling strategies to target Hong Kong-listed stocks. Short selling is reported daily in Hong Kong. As such, we can monitor changes in the levele of shorting in the market. Below are the average short-selling, as percentages of turnover, for KWEB's top eight Hong Kong-listed holdings.
Average Short Sell Turnover % (1-Year)
| Ticker | Name | 1-Yr Avg Short Sell Turnover % |
|---|---|---|
| 992 HK Equity | Lenovo Group | 27.86% |
| 9618 HK Equity | JD.com | 27.50% |
| 2423 HK Equity | KE Holdings | 26.47% |
| 9999 HK Equity | NetEase | 22.96% |
| 3690 HK Equity | Meituan | 22.90% |
| 9961 HK Equity | Trip.com | 20.09% |
| 9988 HK Equity | Alibaba | 16.19% |
| 700 HK Equity | Tencent | 12.55% |
Source: Data from Bloomberg as of 11/2/2026. Average short sell turnover % for the one-year period ended 11/2/2026. Visual created by KraneShares using Bloomberg data. Holdings are subject to change. Please see below for KWEB top 10 holdings as of October 31, 2026.
Over the past several months, aggregate short selling as a percentage of Hong Kong turnover has also increased, further validating our thesis.
Data from Bloomberg as of 10/31/2026. Data shown daily from November 2025 to October 2026.
6. December: Policy Guidance
China's Politburo, a key faction of top-level government ministers, is expected to meet in early December. This gathering will be followed by the Central Economic Work Conference (CEWC) later on that month. The CEWC could signal further economic policy support and may provide a clearer picture as to how the government intends to handle housing and domestic consumption.
We believe China's government is currently seeking to stabilize housing prices without reigniting another boom. At the same time, they could be trying to balance export-driven high value manufacturing with domestic consumption. After pivoting more to high-value manufacturing starting in 2021, we believe the government may seek to raise domestic consumption to offset the high export levels that have caused concerns in developed economies.
7. Q1 2027: Potential Spin-offs From Alibaba, Baidu, & Kuaishou
Alibaba vs T-Head (US$ bn)
Kuaishou vs Kling (US$ bn)
Baidu vs Kunlunxin (US$ bn)
- Parent company
- Subsidiary
Data from Bloomberg and KraneShares as of 11/10/2026. Visual created by KraneShares. KraneShares performed calculations and valuation estimates to produce these figures. Valuations are subject to change. It is not guaranteed that a company will ever reach a valuation assigned by the private markets in the public markets. Valuations in US$ billions as of 11/10/2026. Parent figures are market capitalization; subsidiary figures are reported or implied private valuations. For illustrative purposes only. Kunlunxin as a share of Baidu's valuatuion is calculated as Kunlinxin Valuation divided by Baidu Valuation. T-Head as share of Alibaba's valuation is calculated as T-Head valuation divided by Alibaba valuation. Kling as a share of Kuaishou's valuation is calculated as Kling valuation divided by Kuaishou valuation. Private-company valuations are estimates based on reported or implied values and may not be directly comparable to publicly traded companies’ market capitalizations. Actual valuations at the time of an IPO or other transaction may differ materially.
With all three stocks near 52-week lows,4 any clarity in the timeline for the listings would be a positive catalyst for the companies. Kuaishou had indicated a spin-off of their Kling AI video unit could occur in Q1 2027, which we believe is a reasonable timeline for the others as well. All three spin offs could force investors to use a sum of the parts (SOTP) analysis. In our opinion, this would provide a significant catalyst because the privately-held subsidiaries are valued so highly. Kling and Kunlunxin are considered by the private markets to be worth more than their parent companies are worth in the public markets.
8. Ongoing: The Potential End of The 17-Year Outperformance of US Equities
Since the Global Financial Crisis' US market low on March 9, 2009, US equities have outperformed non-US equities by an extraordinary percentage.
Data from Bloomberg as of 11/9/2026. Cumulative total return from 3/9/2009 to 11/9/2026.
Past performance does not guarantee future results. Index returns are for illustrative purposes only and do not represent the performance of any fund. Indexes are unmanaged and one cannot invest directly in an index. Please see below for index definitions. Index performance does not reflect management fees or other costs associated with investing.
17 years of quarterly brokerage statements and investment committee reviews have undoubtedly tested many investors' commitment to non-US equities. How long can they retain diversifying holdings that consistently lag?
At the same time, strong EPS growth has helped drive US equity performance, while the market has become increasingly concentrated in growth stocks and sectors such as technology. Many foreign markets, by contrast, have large allocations to slower-growing, value-oriented financial stocks, particularly banks.
We believe many investors' US equity exposure is at an all-time high. Nasdaq recently reported that foreign ownership increased 3.8% in the past seven years.5
Other holders
- Other
- Rest of World
- Corporates
- Domestic Hedge Funds
- Other ETF Holders
Households direct + indirect
- Life Insurance
- Pensions
- Active Mutual Funds
- Passive Mutual Funds
- Active ETFs
- Passive ETFs
- Advised Non-HNW
- Advised High Net Worth (HNW)
- Direct Household
Note: Direct holdings include REITs. Other includes federal, state and local governments, the central bank, US-chartered depository institutions, foreign banking offices in the US, property-casualty insurance companies, closed-end funds, security brokers and dealers, other financial businesses, and the following excluding households' indirect holdings: private and government pensions, mutual funds and life insurance. HNW = high net worth.
Source: Federal Reserve Z.1, FactSet, ICI, Nasdaq Economic Institute.
Conclusion
We believe Hong Kong-listed internet stocks may benefit from a series of catalysts that could unfold over the next three months and support the rotation out of AI supply-chain heavy markets like Korea and Taiwan. Strong Q3 financial results, expected to be reported this month with favorable base effects, broad stock market support efforts by state-controlled investment firms, low positioning in China, spin-offs of valuable private subsidiaries, and positive geopolitical developments may all help support a rotation back into China through Hong Kong-listed stocks.
Citations:
- Data from Bloomberg as of 9/30/2026.
- KraneShares estimates based on IDC, Omdia, and company-reported data as of 9/30/2026. Market-share estimates depend on the stated market definition and are subject to change. AI cloud market defined as enterprise cloud computing services.
- Copley Fund Research as of 9/30/2026.
- Data from Bloomberg as of 11/10/2026.
- Mackintosh, Phil. "Who Really Owns U.S. Equities?" Nasdaq. November 5, 2026.
- Lawder, David. "Trump Thinks He Will Meet Xi and Putin at China APEC Summit," Reuters. November 9, 2026.
- "Media Logistics for the G20 Leaders' Summit in Miam, Florida," U.S. Department of State. October 29, 2026.
- Data from Copley Fund Research as of 10/31/2026.
Definitions:
MSCI All Country World Index (ACWI): A global equity benchmark tracking large- and mid-cap companies across developed and emerging markets, including the United States. Launched May 31, 1990.
MSCI ACWI ex US Index: A global equity benchmark tracking large- and mid-cap companies across developed and emerging markets outside the United States, covering approximately 85% of the investable equity market outside the U.S. Launched January 1, 2001.
S&P 500 Index: A float-adjusted, market-capitalization-weighted index measuring the performance of 500 leading large-cap U.S. companies. Launched March 4, 1957.
Earnings per Share (EPS): The amount a company earns in a given period for each share held. It is calculated as net income divided by shares outstanding.
"National Team" ETFs: These are five China-listed domestic equity ETFs that we believe tend to be favored by the National Team" with the tickers 510300, 510310, 159915, 588000, and 510050.
KWEB Top 10 Holdings as of October 31, 2026:
| Company Name | % of Net Assets |
|---|---|
| TENCENT HOLDINGS LTD | 9.92% |
| PDD HOLDINGS INC | 8.68% |
| ALIBABA GROUP HOLDING LTD | 8.64% |
| MEITUAN-CLASS B | 7.53% |
| NETEASE INC | 6.64% |
| KE HOLDINGS INC-CL A | 5.01% |
| JD.COM INC-CLASS A | 4.22% |
| LENOVO GROUP LTD | 4.01% |
| TRIP.COM GROUP LTD | 3.80% |
| FULL TRUCK ALLIANCE -SPN ADR | 3.15% |
| Total | 61.60% |
Holdings are subject to change.