Our market update is a collaboration between the KraneShares internal research department and our industry-leading subadvisors and partners. Our research covers global growth themes in both public and private markets.
KraneShares China Technology & Semiconductor STAR 50 Index ETFkstr0.89%US5007676944
KSTR
KraneShares China Technology & Semiconductor STAR 50 Index ETF
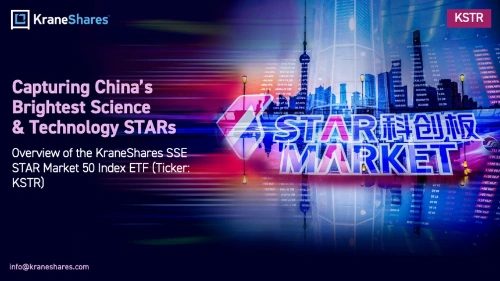
KSTR is a China semiconductor ETF that seeks to track the performance of the Shanghai Stock Exchange (SSE) Science and Technology Innovation Board 50 Index (STAR 50 Index). The Index is comprised of the 50 largest companies listed on the SSE Science and Technology Innovation Board (STAR Market) as determined by market capitalization and liquidity.
Exposure to companies poised to be China’s future leaders across industries that could represent the growth engine of China for decades to come.
Innovation-driven science and technology companies in China that offer a potential source of uncorrelated, long-term growth.
Includes companies from industries such as new-generation information technology, biomedicine, new energy, and environmental protection.
STAR Market Highlights:
Facilitates the fast-tracking of private science and technology companies to an initial public offering (IPO).
Since its establishment in July 2019, the STAR Market has become one of the largest IPO markets globally1 and a premier listing venue for prominent Chinese unicorns (privately held startup companies valued at over $1 billion).
Recent increases in fundraising activity on Chinese exchanges can largely be attributed to the STAR Market, which accounted for approximately 62% of total capital raised through new IPOs across China’s Mainland A-Share market in 2025.2
Potential inclusion in the SSE Composite Index and Shanghai-Hong Kong Stock Connect could result in greater flows for STAR Market securities.
1. YiCai Global, “China’s Year-Old Star Market Outshines the Venerable Nasdaq”, retrieved 12/31/2025.
2. Deloitte China, “2025 Review & 2026 Outlook For Chinese Mainland & HK IPO Markets”, Dec 18, 2025.
Fund Details
Data as of 09/22/2026
Ticker
KSTR
Primary Exchange
NYSE Arca, Inc.
CUSIP
500767694
ISIN
US5007676944
Net Assets
$411,181,993
Shares Outstanding
16,950,000
Total Annual Fund Operating Expense (Gross)
0.89%
Total Annual Fund Operating Expense (Net)
0.65%*
Inception Date
1/26/2021
Distribution Frequency
Annual
Underlying Index
SSE Science and Technology Innovation Board 50 Index
The ETF’s 30 Day Median Bid-Ask Spread is calculated by identifying the ETF’s national best bid and national best offer ("NBBO") as of the end of each 10 second interval during each trading day of the last 30 calendar days and dividing the difference between each such bid and offer by the midpoint of the NBBO. The median of those values is identified and that value is expressed as a percentage rounded to the nearest hundredth.
The Premium/Discount History chart demonstrates the difference between the daily market price of shares of the Fund and the Fund’s net asset value (NAV). The vertical axis of the chart shows the premium or discount of the daily market price as a percentage of the NAV. The horizontal axis shows each trading day in the time period, and each data point in the chart represents the Premium/Discount on that day. The data presented in the chart and table above represent past performance and cannot be used to predict future results.
Performance History
Cumulative %
Data as of: 08/31/2026
Fund NAV
Closing Price
Underlying Index
1 Month
3.43%
2.97%
3.40%
3 Month
-3.10%
-3.43%
-2.97%
6 Month
15.25%
14.29%
15.73%
YTD
31.59%
30.25%
30.59%
Since Inception
-2.36%
-3.04%
12.80%
Avg Annualized %
Data as of month end: 08/31/2026
Fund NAV
Closing Price
Underlying Index
1 Year
32.38%
30.11%
33.66%
3 Year
21.68%
21.63%
25.31%
5 Year
-0.36%
-0.42%
2.87%
Since Inception
-0.43%
-0.55%
2.17%
Avg Annualized %
Data as of quarter end: 06/30/2026
Fund NAV
Closing Price
Underlying Index
1 Year
131.80%
134.08%
132.87%
3 Year
29.49%
30.28%
33.58%
5 Year
3.10%
3.32%
6.25%
Since Inception
4.56%
4.86%
7.25%
*The Adviser has voluntarily agreed to waive its advisory fee by 0.24% of the Fund’s average
daily net assets. This voluntary waiver may be modified or terminated at any time without notice.
The performance data quoted represents past performance. Past performance does not guarantee future results. The investment return and principal value of an investment will fluctuate so that an investor's shares, when sold or redeemed, may be worth more or less than their original cost and current performance may be lower or higher than the performance quoted.
Distribution History
2024 Distributions
Ex-Date
Record Date
Payable Date
Amount
12/17/2024
12/17/2024
12/18/2024
0.000000
Future calendar dates are subject to change. There is no guarantee that dividends will be paid. Past distributions are not indicative of future trends. This material is provided for educational purposes only and does not constitute investment advice.
Distributions are issued to brokers on the payable date, and are subject to broker payment schedules.
The Growth of $10,000 chart reflects an initial investment of $10,000 on the day prior to the selected time period and assumes reinvestment of dividends and capital gains. For the growth of $10,000 chart since inception, the initial investment of $10,000 is instead made on the inception date of the Fund. Fund expenses, including management fees and other expenses were deducted. The growth of a $10,000 investment in the fund is hypothetical and for illustration purposes only. Fund performance data used in this chart is based on Fund NAV and represents past performance. Past performance does not guarantee future results.
The KraneShares China Technology & Semiconductor STAR 50 Index ETF launched on January 26, 2021.
The KraneShares China Technology & Semiconductor STAR 50 Index ETF trades on the New York Stock Exchange (NYSE Arca, Inc.) under the ticker symbol KSTR.
The expense ratio, or total annual fund operating expense, for the KraneShares China Technology & Semiconductor STAR 50 Index ETF is 0.89% (Gross) / 0.65% (Net)*.
KSTR can have distributions depending on factors such as capital gains, dividends, and unrealized gains in passive foreign investment corporations (PFICs). To view KSTR's historical distributions, you can visit the Distributions section on this page. Learn more about distributions by reading our capital gains FAQ. Please consult a financial advisor or tax professional for distribution advice relevant to your particular situation.
You are now leaving KraneShares.com
Hyperlinks on this website are provided as a convenience and we disclaim any responsibility for information, services or products found on the websites linked hereto.
You are now leaving KraneShares.com. Hyperlinks on these websites are provided as a convenience and we disclaim any responsibility for information, services or products found on the websites linked hereto.
For questions on how to invest in KraneShares ETFs, please refer to ETF Trading 101.