KURE: China Healthcare, A Bright Spot in Q1 2020
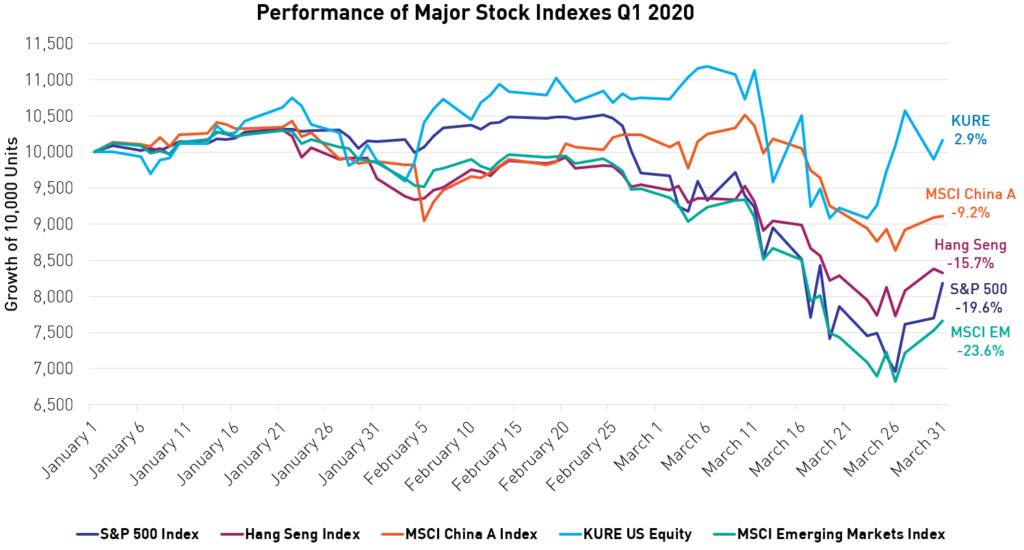
The coronavirus pandemic spread across the world indiscriminately, disrupting lives, and gripping global markets. In the first quarter of 2020, US equities experienced substantial losses not felt since the financial crisis of 2008. Yet, amid all the volatility, many China stocks and ETFs were resilient, and the China healthcare sector even saw positive returns. In particular, the KraneShares MSCI All China Healthcare ETF (KURE) was up 2.9% for Q1 2020; by comparison, the S&P 500 fell 19.6% over that same period.1
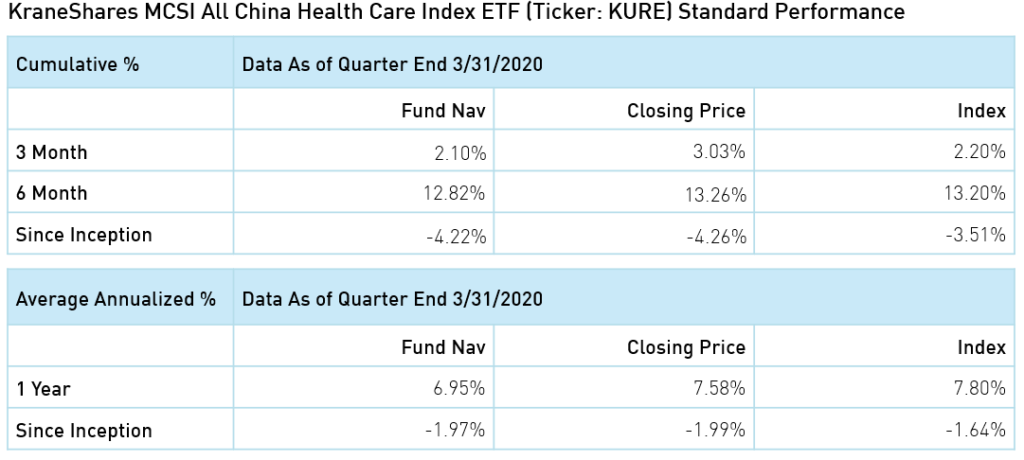

Click here to view KURE’s standard performance.
Much of KURE's recent performance stems from the coronavirus outbreak, which catalyzed growth within China's healthcare sector. Companies involved in healthcare IT, equipment manufacturing and distribution, pharmaceuticals, and traditional Chinese medicine were vital in aiding coronavirus efforts.
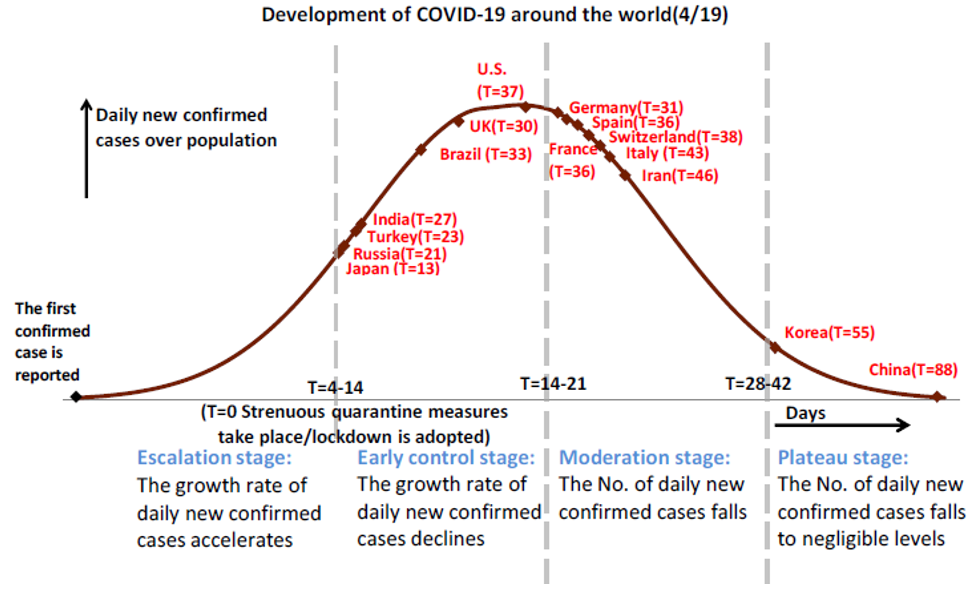
As the severity of the outbreak wanes in China, with a negligible number of new cases reported in recent weeks, we believe elevated demand for Chinese healthcare companies' products and services could continue. With many countries nearing the apex of their coronavirus outbreak, extensive drug and medical supply shortages are emerging elsewhere in the world. China healthcare companies have stepped up to support areas most affected by the virus.
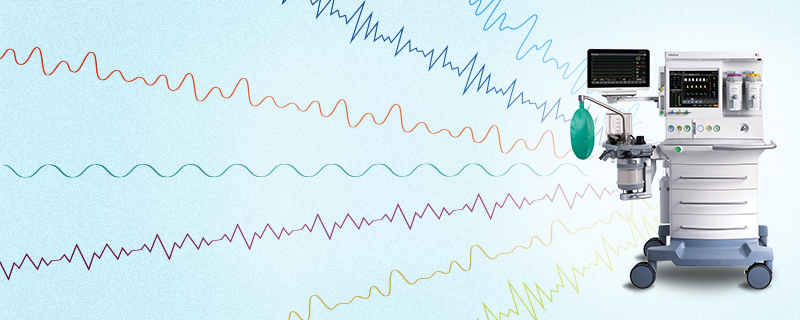
Notable among these Chinese companies are medical equipment suppliers, such as Shenzhen Mindray (SSE: 300760, 6.11% of KURE net assets as of 3/31/2020) and Jiangsu Yuyue (SSE: 002223, 0.81 % of KURE net assets as of 3/31/2020), which were quick to shift distribution overseas. Mindray is a leading ventilator manufacturer that quickly expanded its global reach due to COVID-19 shortages, entering the US market last month after obtaining FDA authorization. The company produces an impressive 3,000 ventilators a month. Jiangsu Yuyue also recently received FDA authorization to sell its ventilators to the US on April 1st.2 In addition to ventilators, the company is a significant supplier of forehead thermometers and nebulizers.
The founders of Alibaba have made considerable donations of personal protective equipment (PPE), test kits, and ventilators to New York and elsewhere. More generally, China is mass-producing 116 million masks a day3 and with the recent approval of KN-95 masks by the United States Food and Drug Administration (FDA), large shipments of these masks are now on their way to the US.4
China Healthcare Sector’s Post-Coronavirus Appeal
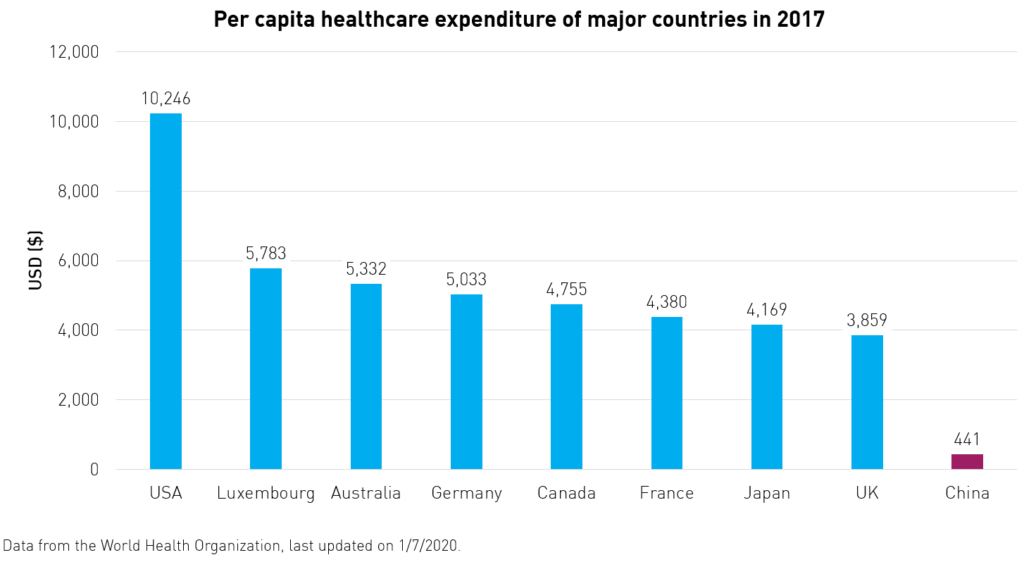
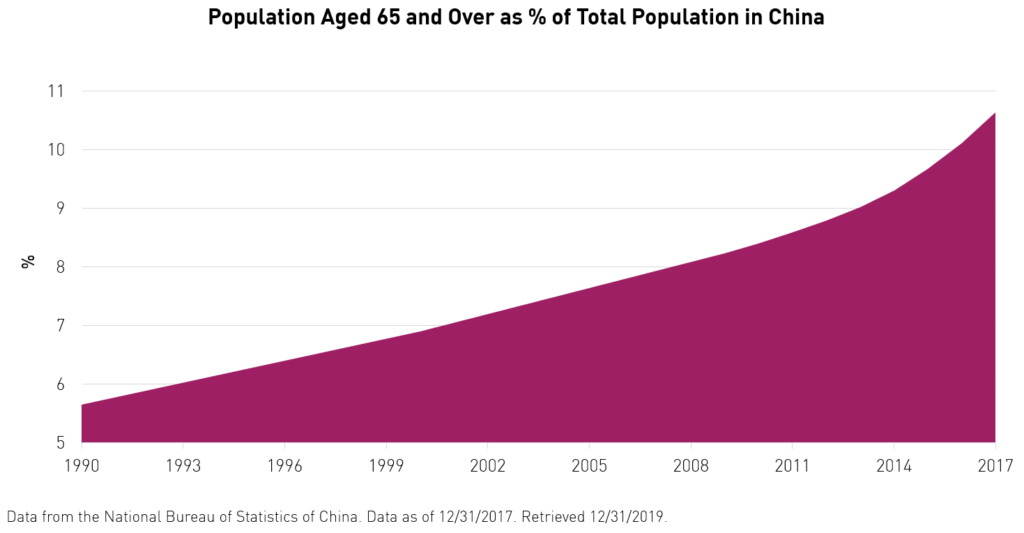
Beyond the coronavirus, we believe China’s healthcare sector is poised to grow further. China has historically underspent on healthcare, with significantly lower per capita spending compared to both other major economies and emerging markets. More healthcare spending is necessary to support the country’s aging population, which is projected to increase the burden of chronic disease by 40% by the year 2030.5
China Pharmaceutical Sales
Despite having significantly lower healthcare per capita spending, China has continued to break historical pharmaceutical sales records.
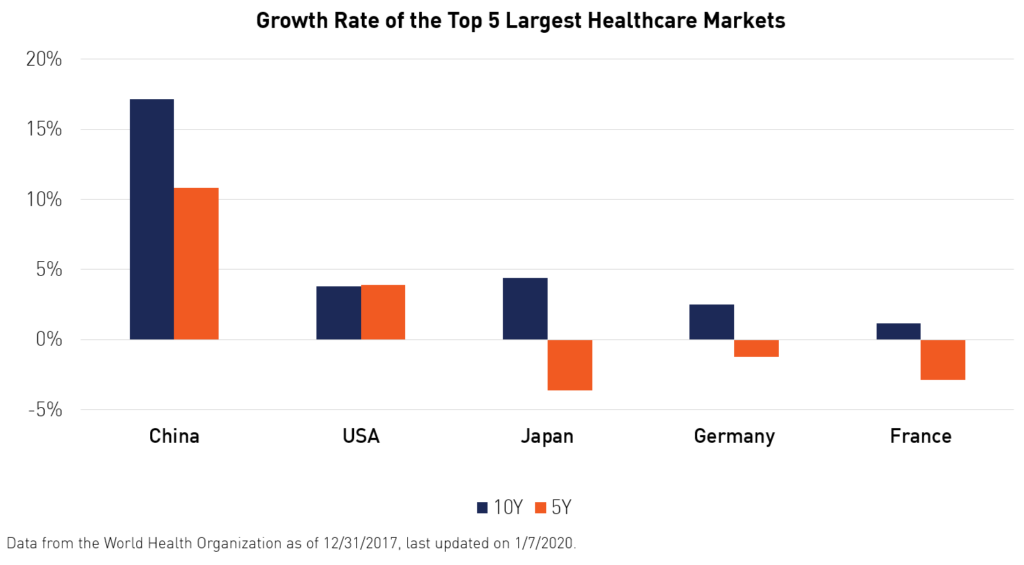
China’s pharmaceutical sales reached $122.6 billion in 2017. This number is projected to grow to $175 billion by 2022, according to healthcare information company, IQVIA.6 China has emerged as the world’s second-largest pharmaceutical market and is one of the fastest-growing major healthcare markets in the world with a ten-year compound annual growth rate of 13%, compared to just 3% in the United States.7
Contract Organizations
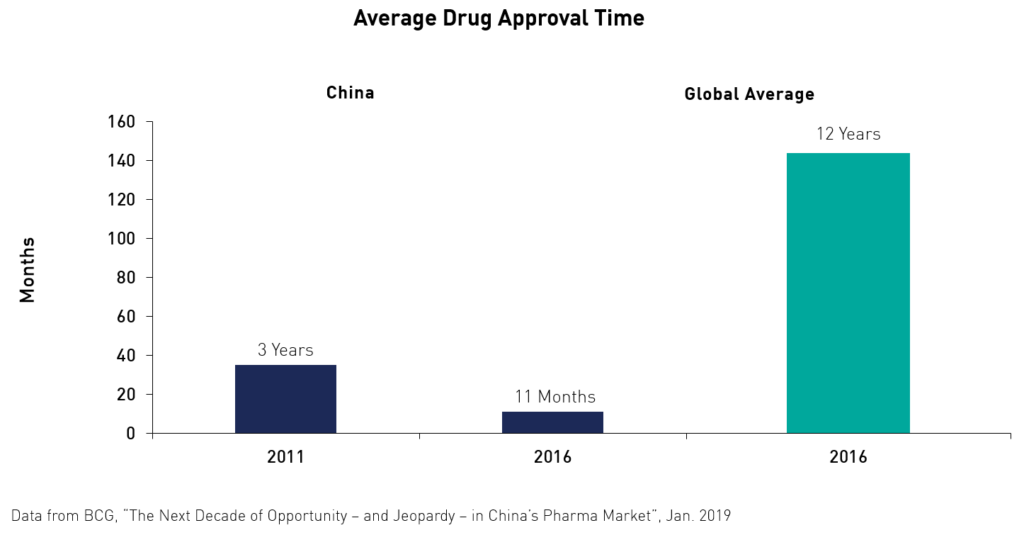
Another source of growth can be found through China’s ever-expanding market for contract research and manufacturing organizations (CROs and CMOs). Both domestic and foreign pharmaceutical, biotech, and medical device companies outsource to these contract organizations, which provide support ranging from drug development to clinical trial services to commercialization. Equipped with state of the art lab and manufacturing facilities for new product development, China's contract organizations are time and cost-effective for their clients.
Chinese contract organizations hold a special allure in that research and development (R&D) costs are significantly lower in China. On average, it costs $3 to $4 billion to develop a new drug in the US, while comparable drug development in China costs about $30 to $40 million.8
At present, China is the largest and sometimes only global supplier of the active ingredient found in a number of vital medications. Chinese pharmaceutical manufacturers have captured 97% of the US market for antibiotics and 90% of the market for vitamin C.9 China’s largest pharma company, Jiangsu Hengrui Medicine (SSE: 600276, 9.21% of KURE net assets as of 3/31/2020), is a major supplier of antibiotics.10 CSPC Pharmaceutical Group (HKG: 1093, 5.04% of KURE net assets as of 3/31/2020) is the world’s largest supplier of vitamin C and supplies a range of drug products including antibiotics.11
In addition to its role as a leading global pharmaceutical supplier, China has emerged as the largest medical device supplier to the US. 12 In recent years, China moved up the value chain, accelerating production of predominately medium- to high-tech therapeutic devices and diagnostic equipment.13 With its growing global market share and competitive edge, we believe that China is well poised to maintain a strong foothold in the pharmaceutical and medical supply space, especially in the wake of coronavirus pandemic.
International Expansion
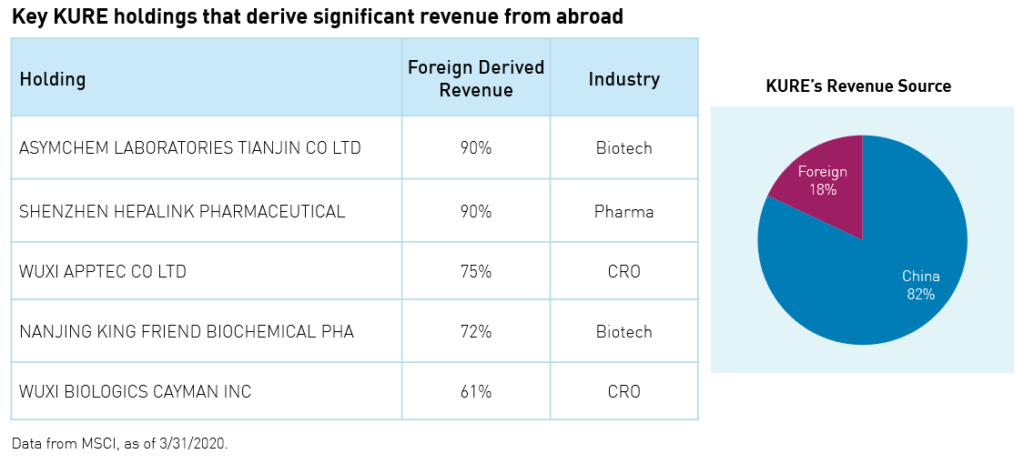
Chinese healthcare companies are quickly capturing greater global market share. Currently, 18% of revenue from KURE's holdings comes from abroad. For several of KURE's holdings, nearly all revenue is foreign-derived. Industry leader, Wuxi Apptec (SSE: 2359, 1.03% of KURE net assets as of 3/31/2020) constitutes 10% of the Chinese CRO market and is among the top 10 CRO players worldwide.15 We believe that contract organizations, like Wuxi Apptec, will be growth drivers within the China healthcare sector and are particularly apt to see more business from abroad in the coming years.
Conclusion
China healthcare was among the few areas that saw net positive returns amid recent market volatility during Q1 2020, with the sector as a whole being one of the best performing asset classes.16 Looking beyond the coronavirus, several ongoing developments, such as aging demographics, rising middle-class, increased spending per capita, and, most importantly, technological innovation and development, reinforce the sector’s long-term structural growth potential. Investors can gain exposure to this fast-growing industry through the KraneShares MSCI All China Healthcare ETF (KURE).
Citations:
- Bloomberg, total returns for Q1 2020.
- Bloomberg, “World Ventilator Demand Now 10 Times What’s Available, Says Maker”, 3/25/2020.
- Reuters, “Jiangsu Yuyue Medical Equipment's Unit Obtains Emergency Use Authorization From U.S. FDA For Ventilator Product”, 4/1/2020.
- SCMP, “Coronavirus: China’s mask-making juggernaut cranks into gear, sparking fears of over-reliance on world’s workshop”, March 12, 2020.
- Data from the World Health Organization as of 12/31/2017, last updated on 1/7/2020.
- CNBC. “China's pharmaceutical industry is poised for major growth” 4/19/2018. Retrieved on 12/31/2019. SCMP, “Coronavirus: China’s mask-making juggernaut cranks into gear, sparking fears of over-reliance on world’s workshop”, March 12, 2020.
- Data from the World Health Organization as of 12/31/2017, last updated on 1/7/2020.
- Fortune, “Why China Is Having A Healthcare Boom”, 1/18/2018. Retrieved 3/31/2020.
- Council on Foreign Relations, “The Coronavirus Outbreak Could Disrupt the U.S. Drug Supply”, 3/5/2020.
- Pharma Boardroom, “Top 10 Chinese Pharma Companies”, 8/11/2019.
- OkChem, “An Overview of China’s Vitamin C Export in 2014-2018”, 2/25/2019.
- Global BioDefense, “The Silent Threat of COVID-19: America’s Dependence on Chinese Pharmaceuticals”, 2/11/2020.
- United States International Trade Commission, “China’s Changing Medical Device Exports”, 1/2018.
- Global BioDefense, “The Silent Threat of COVID-19: America’s Dependence on Chinese Pharmaceuticals”, 2/11/2020.
- “China Contract Research Organization (CRO) Industry Report, 2019-2025”, 3/2019.
- KraneShares calculations, as of 3/31/2020.
Index Definitions:
S&P 500 Index: The Index is widely regarded as the best single gauge of large-cap U.S. equities. There is over USD 9.9 trillion indexed or benchmarked to the index, with indexed assets comprising approximately USD 3.4 trillion of this total. The index includes 500 leading companies and covers approximately 80% of available market capitalization. The index was launched on March 4, 1957.
Hang Seng Index: The Index is a free-float capitalization-weighted index of a selection of companies from the Stock Exchange of Hong Kong. The components of the index are divided into four sub-indices: Commerce and Industry, Finance, Utilities, and Properties. The index was developed with a base level of 100 as of July 31, 1964.
MSCI China A Index: The Index captures large and mid-cap representation across China securities listed on the Shanghai and Shenzhen exchanges.
MSCI China All Shares Health Care 10/40 Index: The Index captures large and mid-cap representation across China A‐shares, B‐shares, H‐ shares, Red‐chips, P‐ chips and foreign listings (e.g. ADRs). The index aims to reflect the opportunity set of China share classes listed in Hong Kong, Shanghai, Shenzhen and outside of China. It is based on the concept of the integrated MSCI China equity universe with China A-shares included. All securities in the index are classified in the Health Care sector according to the Global Industry Classification Standard (GICS®). The 10/40 concentration constraints apply investment limits where the weight of each group entity in the index is capped at 10% and the cumulative weight of all group entities with a weight in excess of 5% does not exceed 40% of the Index by weight.
MSCI Emerging Markets Index: The Index is a free-float weighted equity index that captures large and mid-cap representation across Emerging Market (EM) countries. The index covers approximately 85% of the free-float adjusted market capitalization in each country. All performance quoted is in USD. The index was launched on January 1, 2001.
R_US_KS_SEI


