What Happened in August?
The effect of China’s shifting economy on global investors
As market volatility erupted in mid-August the resulting negative global investor sentiment was exacerbated by news reports out of China. Superficially the reports seemed less than stellar, with many in the press heralding China’s lower than expected August manufacturing numbers as certain proof of a major slowdown. In the past, China’s manufacturing numbers may have been a reliable gauge of the country’s economic health, however we believe they no longer take into account the full picture of China’s diversified economy.
If – as we believe – China is still developing according to plan, than what did happen in August? And what impact does China’s shifting economy have on global investors?
In mid-August global investors vigorously exited riskier asset classes in advance of the Federal Reserve’s pending announcement on the U.S. interest rate hike. For investors in the United States, Europe, and Japan, 2015 has been a relatively uneventful year outside of Greek exit woes. This prolonged period of calm stoked August’s drama as investors eagerly moved to preserve gains. Outside of these three regions, all is not well. The dollar’s strength combined with declines in energy and commodity prices wreaked havoc on emerging market economies and stock markets. Zero interest rate policies by Central banks in developed markets have had a positive effect domestically while shifting the pain to others beyond their borders, mainly emerging market countries. In August, we believe the pressures created by this environment simply came due.
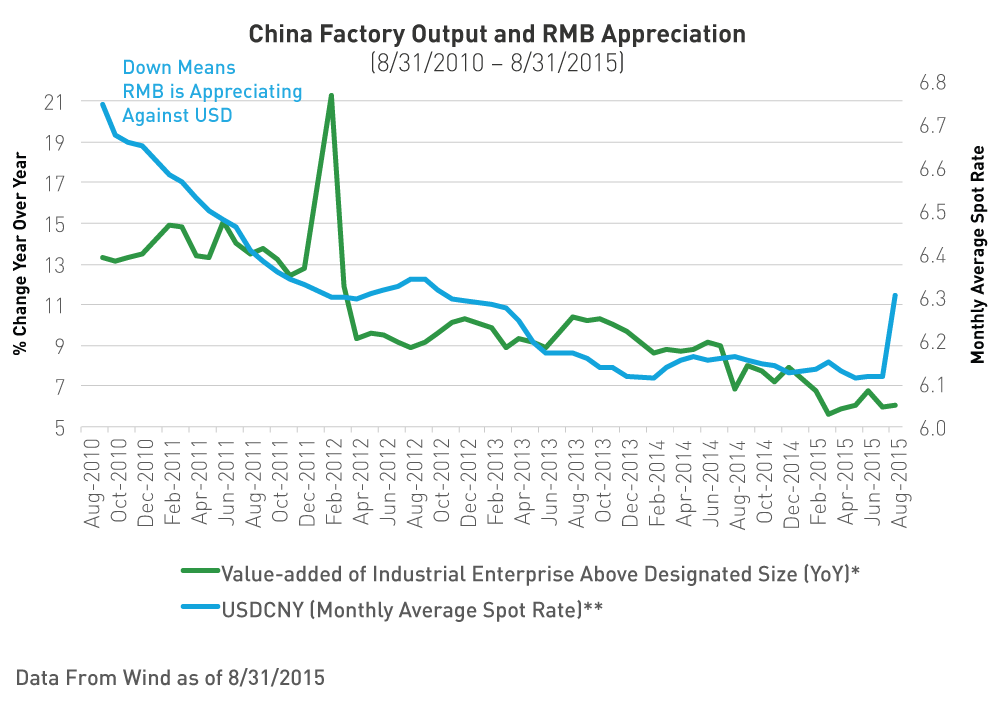
In China, factory output rose a weaker than expected 6.1 percent in August from a year earlier. Markets had expected a 6.4 percent increase1. While these numbers made headlines, declining factory output has been a long-term trend in China. One reason for the decline is that relative to most other countries China has kept its interest rates high and its currency, the renminbi (RMB), strong. We believe these policies have caused China’s manufacturing numbers to decline because as other countries’ currencies depreciate it becomes more expensive to buy Chinese exports. While the U.S. dollar has also been strong, compared to the RMB it has lost nearly 7% over the past five years ended August 31, 20152. This means weaker demand for Chinese exports from even a strong currency nation such as the United States. Instead of weakening its currency to boost exports China is pursuing a policy of RMB internationalization, which has resulted in a strong RMB.
One way China may have indirectly contributed to August’s volatility is through the effect of its recent policy changes on foreign exchange speculators. China’s recent move to liberalize the way it values its currency was relatively minor for the majority of investors but it had an enormous impact on levered carry trade investors. The carry trade is a strategy that has become increasingly popular in recent years amongst currency traders. The strategy works by borrowing money in a low interest rate country and investing in a high interest rate country. The loaned money is often levered through additional borrowing from a broker similar to buying stock on margin. We believe investors from Japan and Europe, which have very low interest rates, were implementing the carry trade through borrowing locally and investing in China’s bond market, which has comparatively high interest rates. The ease of trading RMB internationally from these two regions has increased recently with the opening of RMB offshore trading hubs in London, Paris, and Luxembourg as well as in Tokyo.
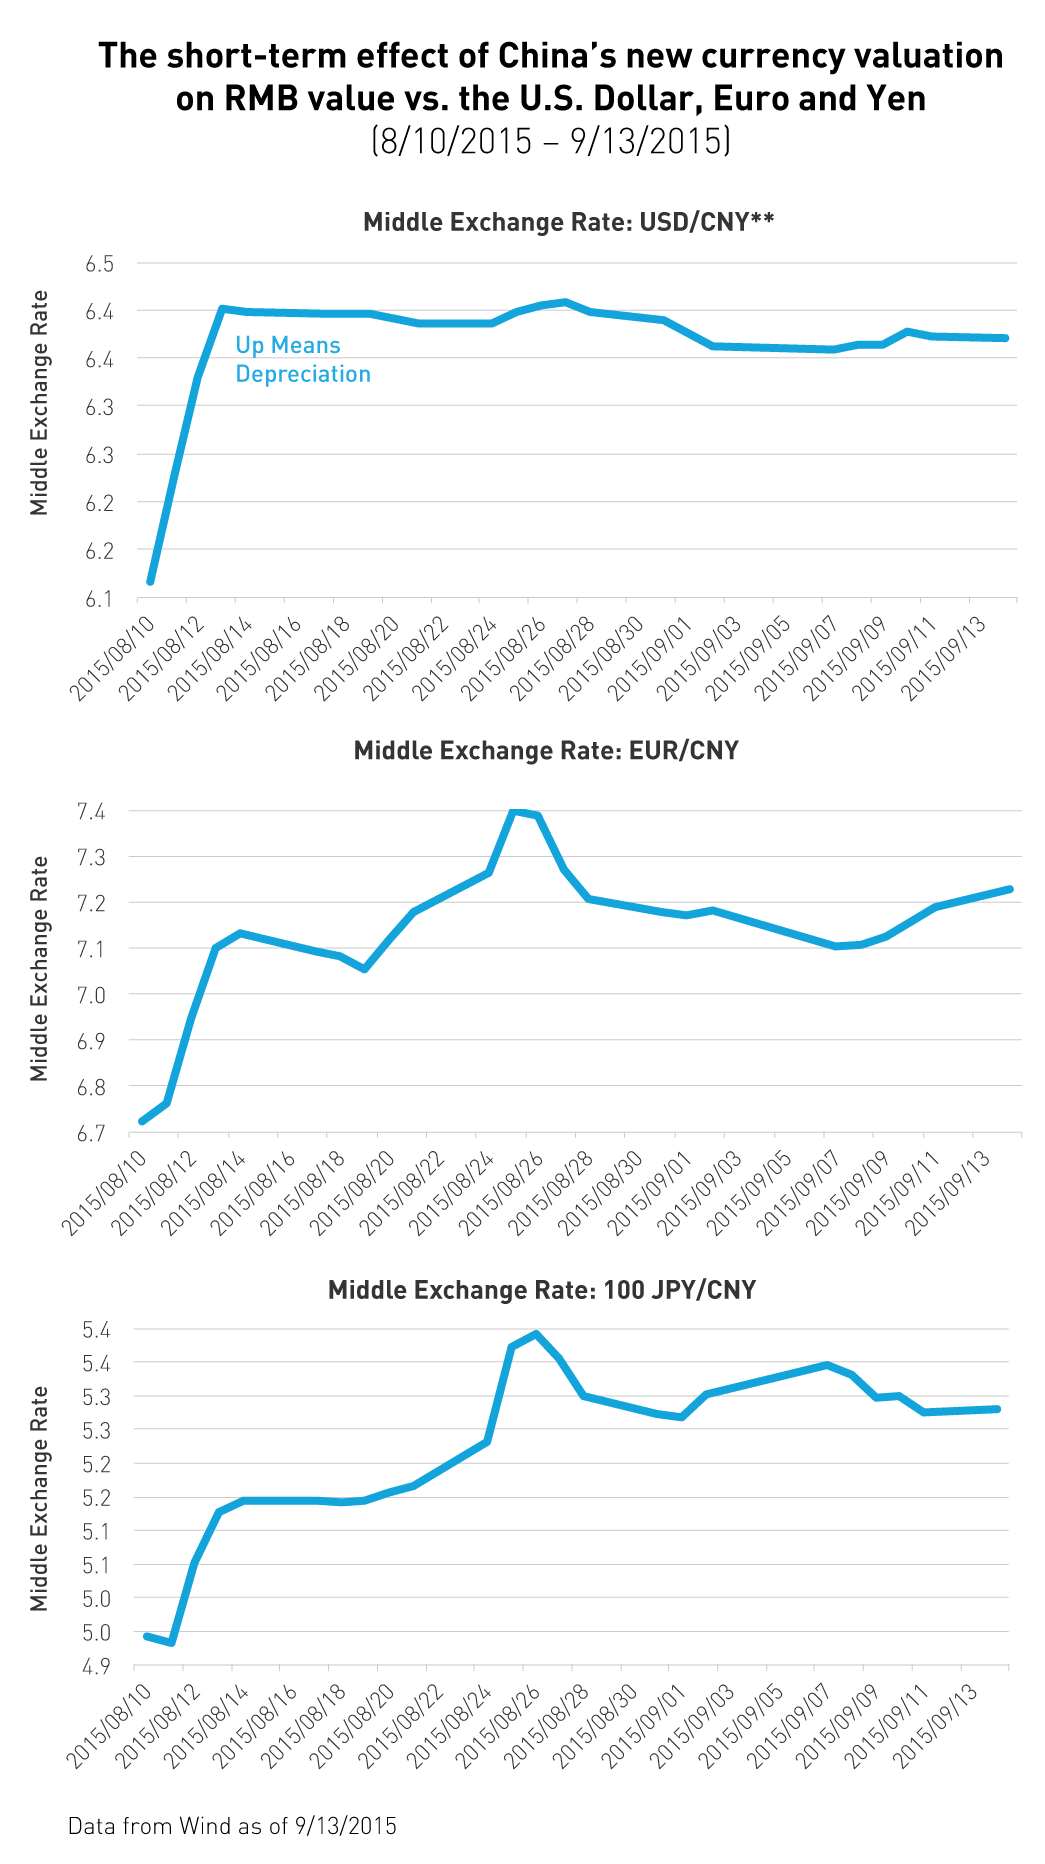
On August 11th China’s new currency valuation methodology caused RMB devaluation. The new methodology, which was enacted under the guidance of the International Monetary Fund, allows greater market force in determining the value of the RMB through calculating an average daily price or "midpoint" set by a group of foreign and domestic market makers. The midpoint is subsequently allowed to float up or down in a 2% band the following day. For most investors, the effect of the new methodology was minor, for levered carry trade investors the effect was was amplified considerably. This potentially pressured many such investors to liquidate their positions. This would have entailed selling RMB and bringing money back to Japan and Europe. Immediately following China’s devaluation, the RMB fell versus major currencies though versus the Euro and Yen it fell substantially more.
Beyond its effect on levered carry trade investors in the near-term, we believe China’s shifting economy impacts certain emerging market countries in the long-term. We believe China’s slowing exports mean there is a less demand for it to buy the manufacturing inputs it once relied on. This may be negatively affecting countries abundant in natural resources, many of which are in the emerging markets. We created the KraneShares FTSE Emerging Market Plus ETF (ticker KEMP) in February 2015 based on these trends. Through KEMP, Emerging market investors can underweight natural resource countries via the fund’s GDP country weighting methodology. We believe slowing exports will continue to be problematic for global multi-national companies who have sold the inputs and machinery used in manufacturing processes.
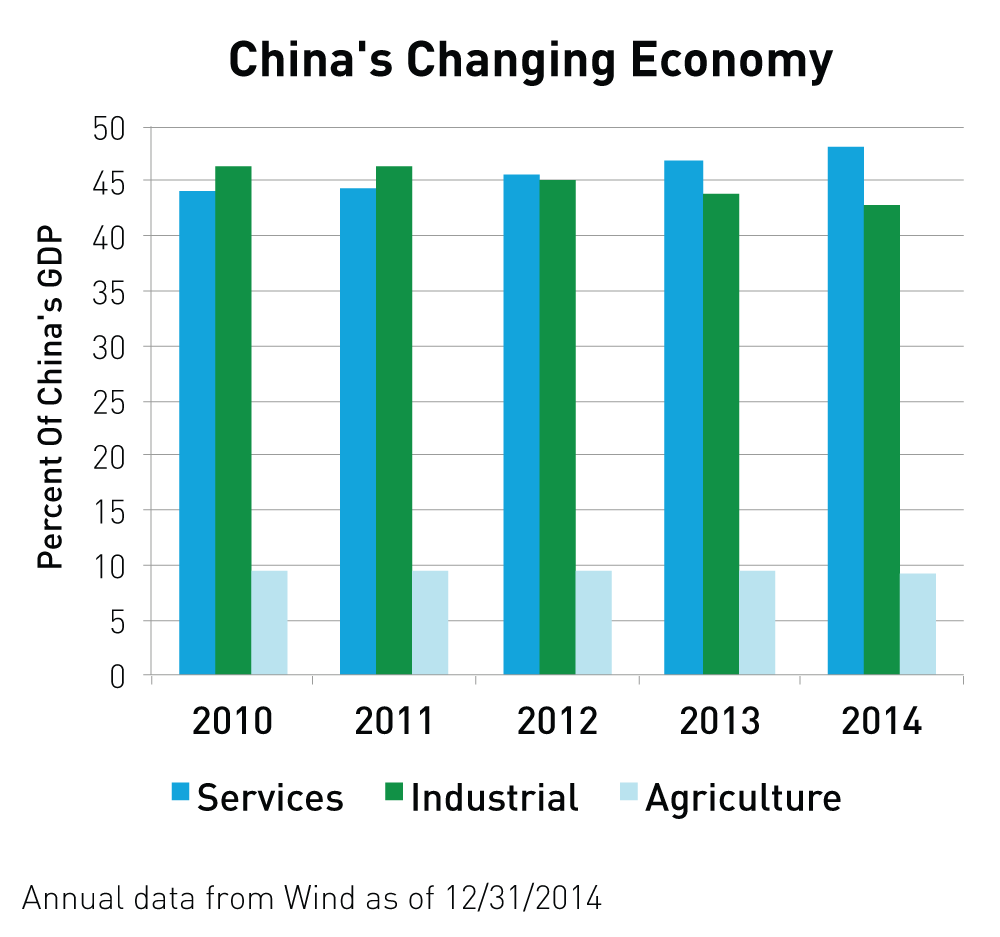
Much like how our emerging market investment philosophy mitigates exposure to commodity dependent countries, we believe investors should take an equally discerning approach to their exposure within China itself. Chinese policy makers are attempting to raise domestic consumption to counterbalance the effect of the decline in manufactured exports on the economy. Many investors might be surprised to learn that in 2012 China’s services sector surpassed the industrial / manufacturing sector as the largest portion of the Chinese economy. China’s GDP is now composed of 48% Services, 43% Industrial and 9% Agriculture as of 12/31/2014.
Many global index providers have not updated their definition of China to reflect this new service sector dominated reality and instead have heavy weights to China’s traditionally larger industrial sector. These definitions affect a large number of investors with international exposure, whether they realize it or not. Index providers, such as MSCI, determine the investment universe for trillions of dollars of both active and passive funds. The MSCI China Index is heavily weighted to traditional sectors of the economy and has less exposure to domestic consumption. Additionally, many investors who do not allocate to China as a standalone position are also affected by this definition. The MSCI China Index’s investment universe rolls up into the China segment of the broader MSCI Emerging Markets Index and the MSCI All Country World Index as well.
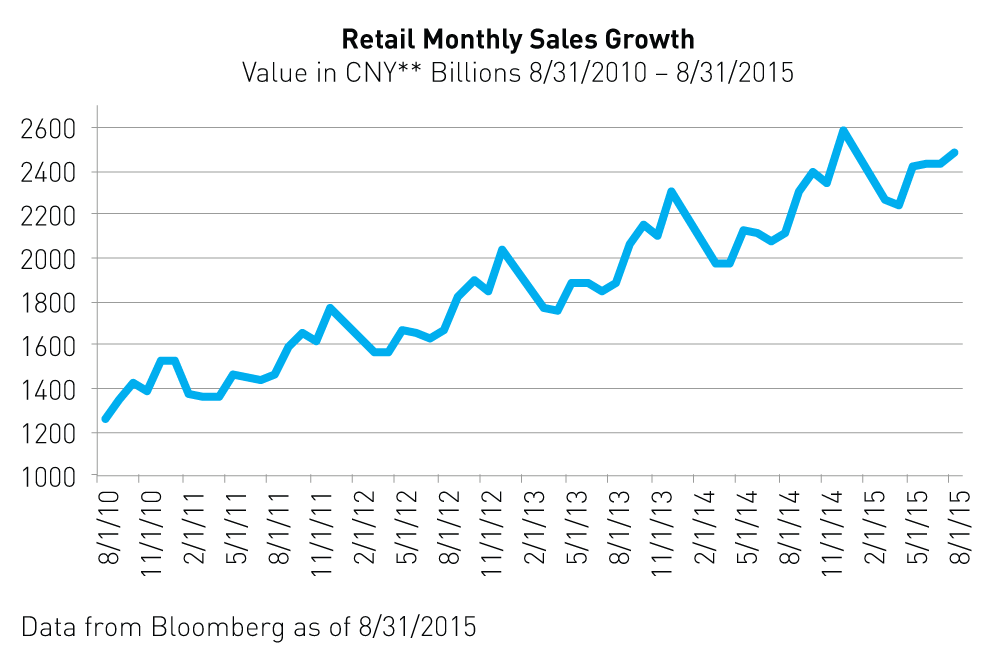
The areas where we believe investors should be focused are those that the government has targeted for growth through policy support. The shift toward domestic consumption is a major priority for China’s leadership. This shift has been showing signs of success as China’s retail sales growth has been consistently strong. In August retail sales reached 10.8% year over year following July’s gain of 10.5%3.
China’s domestic market is becoming increasingly lucrative for international retailers as well. On August 25th 2015, Alibaba4 reported having over 1,000 of the world’s top fashion retailers including Burberry, Hugo Boss, Ports, Lacoste, Calvin Klein, and Zara participate in an apparel promotion on their T-mall Business to Consumer platform5. Heritage66, the company in charge of selling Taylor Swift’s merchandise globally recently inked a deal with JD.com6 to sell the singer’s t-shirt line in China in anticipation of her nationwide tour there. On September 12th Apple reported that pre-order sales for its new iPhone sold out in 12 hours. Apple’s CEO Tim Cook stated that “I get updates on our performance in China every day, including this morning, and I can tell you that we have continued to experience strong growth for our business in China through July and August… I continue to believe that China represents an unprecedented opportunity over the long term as LTE penetration is very low and most importantly the growth of the middle class over the next several years will be huge.”
We listed the KraneShares CSI China Internet ETF (ticker KWEB) two years ago to provide investors with exposure to the growing services industry and increased domestic consumption trend in China. As domestic consumption grows in China it is increasingly taking place online. KWEB offers diversified exposure to some of the most dynamic and growing companies in this field.
As of August 31, 82% of KWEB’s holdings trade in the United States with the remainder trading on the Hong Kong Stock Exchange. For investors looking for a currency hedged China exposure, KWEB’s overweight to U.S. listed and U.S. dollar denominated stocks may provide protection against currency volatility. Many other China indices are heavily weighted toward sectors tied to China’s manufacturing sector, which could be under pressure until global growth rebounds. Additionally MSCI has announced that the top sixteen U.S.–listed Chinese companies (China N-shares) will be added to their indices starting on December 1st, 2015. This will cause a significant increase in N-share market cap that could be beneficial to KWEB.
We encourage investors to take a second look at their China investment universe within their international and emerging market portfolio allocation. We believe those who have an overweight to China’s industrial and manufacturing sector may want to consider choosing a fund with a greater allocation to China’s consumer sector. In the near-term China N-shares may be a favorable tactical play as investors can potentially benefit from any increase in market cap that will result from MSCI’s December inclusion.
*Value-added of Industrial Enterprise Above Designated Size: Reflects the amount of change in the volume of industrial production over time.
**CNY is a term for RMB traded within onshore China. Spot Rate is the rate of a foreign-exchange contract for immediate delivery. Also known as "benchmark rates", "straightforward rates" or "outright rates", spot rates represent the price that a buyer expects to pay for a foreign currency in another currency. The USDCNY monthly average spot rate is the total average for the month of daily spot rates.
- KEVIN YAO AND LEI WANG, "China unveils details of state-firm reforms as growth sputters" REUTERS/CHINA DAILY, 9/13/2015
- Data from Wind as of 8/31/2015
- Data from Wind as of 8/31/2015
- Alibaba was 0.70% of KEMP and 9.61% of KWEB holdings as of 8/31/2015
- Susan Wang, "1,000 Fashion Brands Join Tmall Seasonal Apparel Promotion" Alizilla, 8/25/2015
- JD.com was 0.22% of KEMP and 6.28% of KWEB holdings as of 8/31/2015