The Total Portfolio Approach in 2026: Construction, Risk, and the Role of KMLM
The opening weeks of 2026 have already challenged assumptions about market stability. Geopolitical developments, shifting policy signals, and abrupt changes in risk sentiment have emerged early in the year, as stocks and bonds declined in tandem1, underscoring how quickly correlations can converge and diversification can break down.*
These dynamics highlight an enduring challenge for investors: portfolios optimized for a narrow set of economic outcomes often struggle when conditions change. The traditional 60/40 stock-bond framework, long viewed as a balanced solution, has shown meaningful limitations in environments characterized by inflation shocks, rising rates, and macro volatility.
Some of the world's largest institutional investors have been evolving their thinking beyond the 60/40.** The Total Portfolio Approach, championed by pension giants like California Public Employees’ Retirement System (CalPERS) and the California State Teachers’ Retirement System (CalSTRS), offers a different way to think about risk and return, creating compelling opportunities for diversifying strategies like managed futures, including the KraneShares Mount Lucas Managed Futures Index Strategy ETF (KMLM).
Within this framework, strategies like KMLM are not designed to compete with equities or bonds on a year-by-year basis. Instead, KMLM plays a specific role: providing exposure to macro trends, price volatility, and environments where traditional assets struggle.
But here's the thing: for this approach to actually work, each portfolio element needs to do its job. And we need to stop judging them all by the same yardstick.
What Is the Total Portfolio Approach?
The Total Portfolio Approach (TPA) represents a fundamental shift in how institutional investors think about asset allocation. Rather than optimizing individual asset classes in silos, TPA focuses on managing risk and return at the total portfolio level.
CalPERS, managing over $450 billion in assets2, has been at the forefront of this evolution since implementing their framework in the mid-2010s. That's real money with real obligations to real retirees. They can't afford to get this wrong.
Here's how it works: TPA identifies risk factors (equity risk, interest rate risk, credit risk, and inflation risk) that drive returns across the entire portfolio. Instead of thinking "I need 60% stocks and 40% bonds," the framework asks "what mix of risk factors will help me meet my long-term obligations?"
This is different from traditional strategic asset allocation, which sets target weights for asset classes and rebalances back to those weights. TPA is more dynamic. It doesn’t care if your asset class is public equity or private equity; it focuses on the underlying economic drivers of returns and how those risks interact across the entire portfolio. It's about understanding what risks you're actually taking, not just what labels you're putting on your holdings.
CalSTRS, with approximately $330 billion in assets3, has similarly adopted this approach. They explicitly recognize that traditional diversification often breaks down precisely when you need it most. Their framework emphasizes risk factor diversification and seeks exposures that perform differently across various economic environments.
The key insight? Different portfolio elements, like equities, fixed income, and alternatives, should play different roles.
Some are there for growth. Some for income. Some for inflation protection. And some (like managed futures) for crisis diversification and macro volatility exposure. It's like building a team where everyone has a specific position to play.
Here's something worth noting: over the past decade, "alternatives" allocations in institutional portfolios have grown substantially, but they've been dominated by private equity, private credit, and real estate. These are valuable investments, but they're primarily adding to growth risk, not diversifying away from it. They're correlated with public markets, just with a lag and less frequent pricing. What's often missing is true diversification. Strategies that zig when traditional growth assets zag. That's where we believe liquid alternatives like managed futures come in.
Why Diversification Actually Matters
The beauty of TPA is that it forces honest conversations about what diversification really means.
2022 provided a stark reminder that stocks and bonds don't always provide the diversification we assume. When inflation showed up uninvited to the party, both the S&P 500 and the Bloomberg Aggregate Bond Index fell together—stocks down 18%, bonds down 13%.4 The traditional balanced portfolio offered little balance. If you were in a typical 60/40 portfolio, there was nowhere to hide.
And 2022 wasn't just a theoretical problem. It was the year that showed why you hold things that aren't correlated. Managed futures delivered exactly when traditional allocations struggled. For example, KMLM returned 29.50%, while the S&P 500 returned -18.64%, and the US Aggregate Bond Index returned -15.68% in 2022.5 KMLM offered exposure to both the long and short sides of return distributions. Long commodities during the Ukraine War, short bonds as yields spiked. In 2022, at least, few other asset classes brought that kind of hedging protection. Not gold, not TIPS, not Bitcoin.
The performance data quoted represents past performance. Past performance does not guarantee future results. The investment return and principal value of an investment will fluctuate so that an investor’s shares, when redeemed or sold, may be worth more or less than the original cost. Current performance may be lower or higher than the performance quoted. For performance data current to the most recent month end, please click here.
But then came 2023 and 2024-2025—more challenging years for managed futures amid strong stock market results. And right on cue, the naysayers returned. We've seen this pattern before. Traditional portfolios love stability and steady growth and struggle in periods of macro uncertainty and volatility.
This is where diversifying strategies create value in a TPA framework. By adding exposures that respond differently to macro dislocations, investors can help reduce their dependence on any single economic scenario. The goal isn't just lower volatility for its own sake. It's building a portfolio that can help weather multiple economic regimes and deliver on long-term obligations regardless of the environment.
Enter Managed Futures
Managed futures sit at an interesting intersection within the TPA framework.
Unlike stocks and bonds, which primarily capture growth and credit risk premiums, managed futures seek to capture a fundamentally different return stream: the price risk premium that comes from systematic trend-following across global markets.
Think about it this way. Futures markets exist to allow commercial enterprises to transfer price risk to investors willing to accept it. When an ethanol producer needs to lock in corn costs, or a grain elevator operator needs to hedge falling prices, someone needs to be on the other side of those transactions.
Managed futures investors, particularly trend followers, systematically accept this price risk and volatility. They provide price certainty to businesses and may earn a premium for doing so. We believe this dynamic is akin to being the insurance company rather than the policyholder.
The risk doesn't disappear when hedgers transfer it, but they may be compensated for taking it on.
This creates a return profile that could be uncorrelated with traditional growth assets. More importantly, that correlation historically has turned negative during periods of price shocks (both positive and negative) as trends extend over longer time periods of stress that cause traditional markets pain.
Fitting Into the Framework
Within TPA, managed futures address several critical objectives.
First, they provide crisis alpha—gains when macro uncertainty spikes and traditional assets struggle. As pictured in the table below, during the Global Financial Crisis (Nov 2007 to Feb 2009), the COVID crisis of early 2020 (Jan 2020 to Mar 2020), and the inflation shock of 2022 (Jan 2022 to Dec 2022), managed futures consistently delivered positive returns during equity drawdowns.
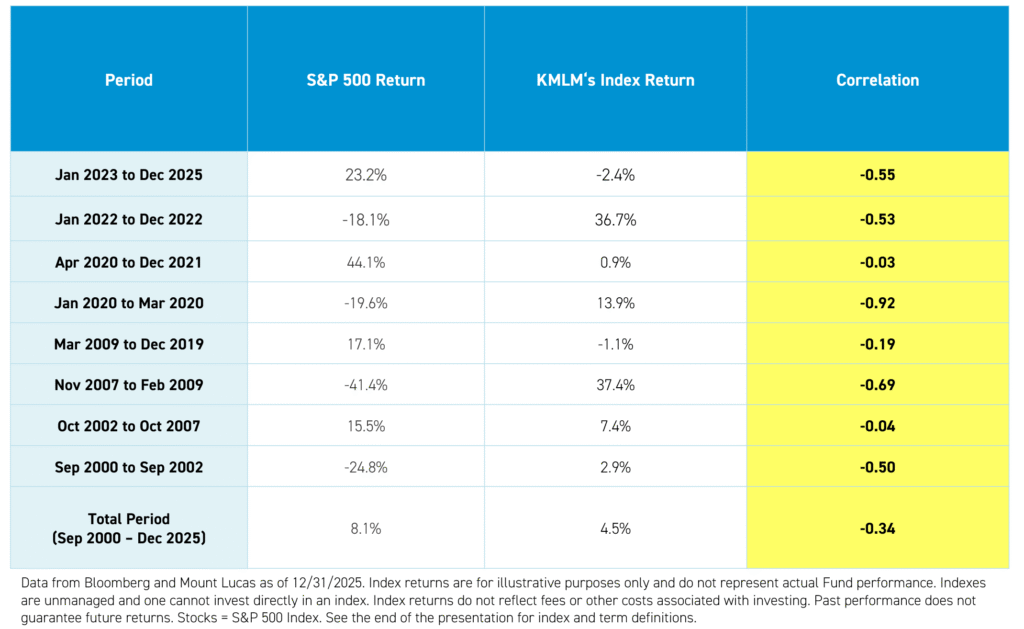
Again, this references past performance, which is no guarantee of future results, but it shows a consistent track record: when there's panic in the markets, holding managed futures can benefit a portfolio. Like a high-leverage relief pitcher in baseball, he comes in during periods of peak stress to try and put out fires and keep his team in the game.
Second, they're naturally dynamic. Unlike static long positions in stocks or bonds, trend-following strategies can profit from both rising and falling markets. Strong performance often comes partly from going short bonds as yields rise (something a long-only bond allocation obviously cannot do) or from capturing moves in currencies and commodities in either direction. From the offensive side, managed‑futures strategies can function like a switch hitter—able to participate in different market environments depending on prevailing trends.
Third, they help manage tail risk without the negative carry of options strategies. You're not paying a premium that bleeds away; you're accepting price risk that historically earns a positive return, with the added benefit of convexity when you need it most. The veteran clutch player who has seen a range of market conditions and stays steady under pressure without adding significant cost.
For allocators thinking in terms of total portfolio risk factors, managed futures represent exposure to macro volatility and price uncertainty—factors that are negatively correlated with the growth and stability factors that drive stocks and bonds. This makes them particularly valuable in a regime-agnostic framework designed to perform across multiple economic environments. You don't have to predict the future correctly. You just need to be positioned for multiple versions of it.
The Challenge of Comparing Apples to Oranges
Here's where things get tricky, and where a lot of well-intentioned portfolios go off the rails.
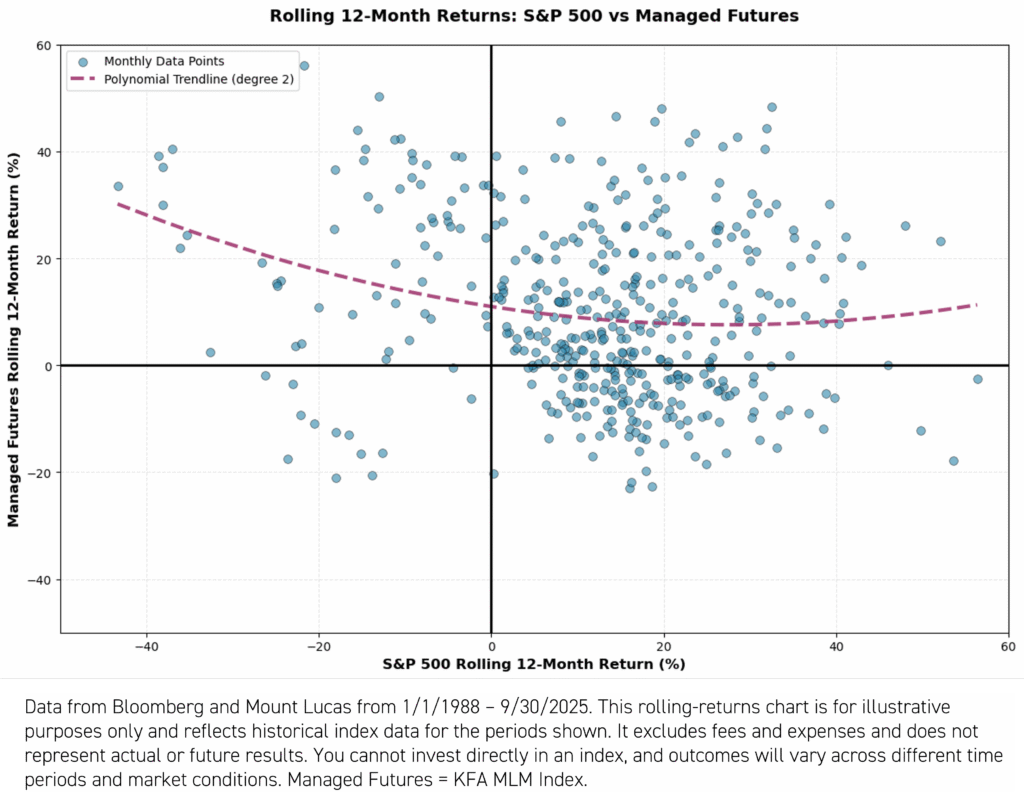
Most investment committees still evaluate all their managers using the same traditional metrics: one-year returns, three-year returns, five-year returns, Sharpe ratios. Everyone lines up in the same performance table, and the bottom performers get questioned. We've all been in those meetings. Just take a look at managed futures returns (batting average) against stocks in the below chart.
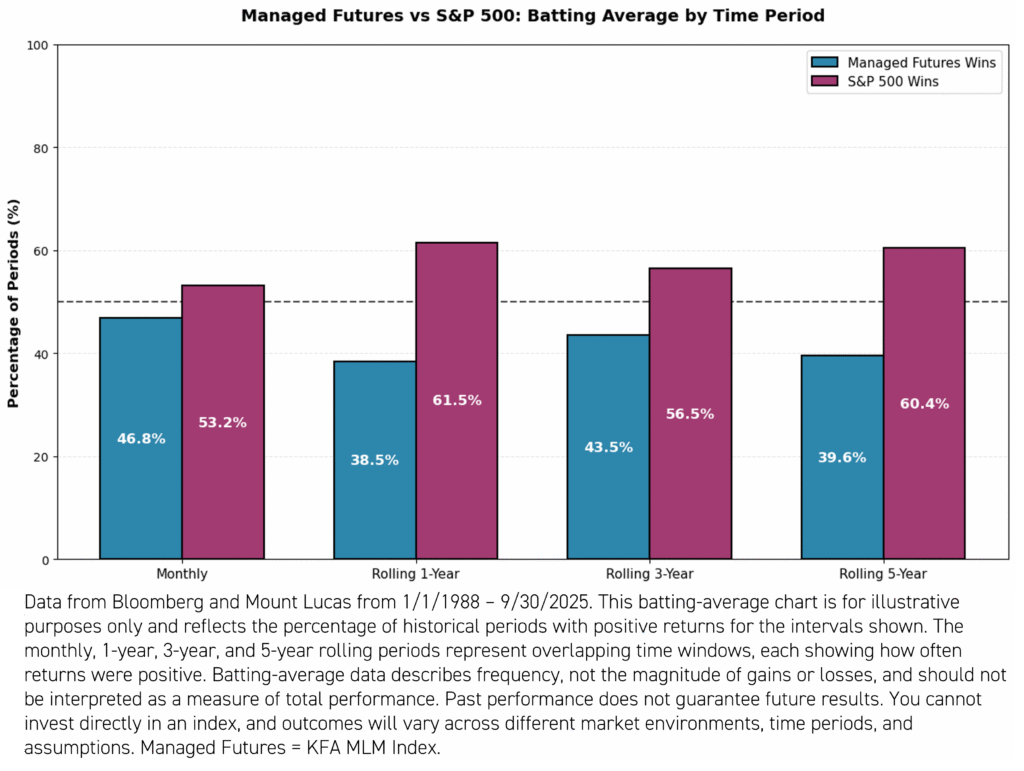
More often than not, stocks, and other growth assets that look like stocks, beat managed futures in a side-by-side comparison.
But let’s consider the statistical reality: stocks and bonds are negatively skewed. Using the S&P 500 and the Bloomberg US Aggregate as proxies, they have skewness of -0.55 and -0.24, respectively, over January 1988 – September 2025. They can go up in small, steady increments and crash down in dramatic moves. They're built for stable growth environments. Managed futures, by contrast, are positively skewed. Using the KFA MLM Index as a proxy, using the same time period as stocks and bonds, they have a skewness of +0.15. They can have lots of small losses (like paying insurance premiums) with occasional big gains, often exactly when stocks crash.6
These are fundamentally different return profiles designed to perform in fundamentally different environments. Evaluating them on a single performance table can be misleading because their purpose within a portfolio is not the same, like comparing your homeowner's insurance premium to your investment returns. Some strategies are designed to provide diversification benefits during certain market conditions rather than to outperform traditional assets in all periods. Did your homeowner's insurance "underperform" this year because your house didn't burn down? Of course not. It did its job by being there in case you needed it.
So what does this mean in a total portfolio context? Let’s view it through an efficient frontier lens.
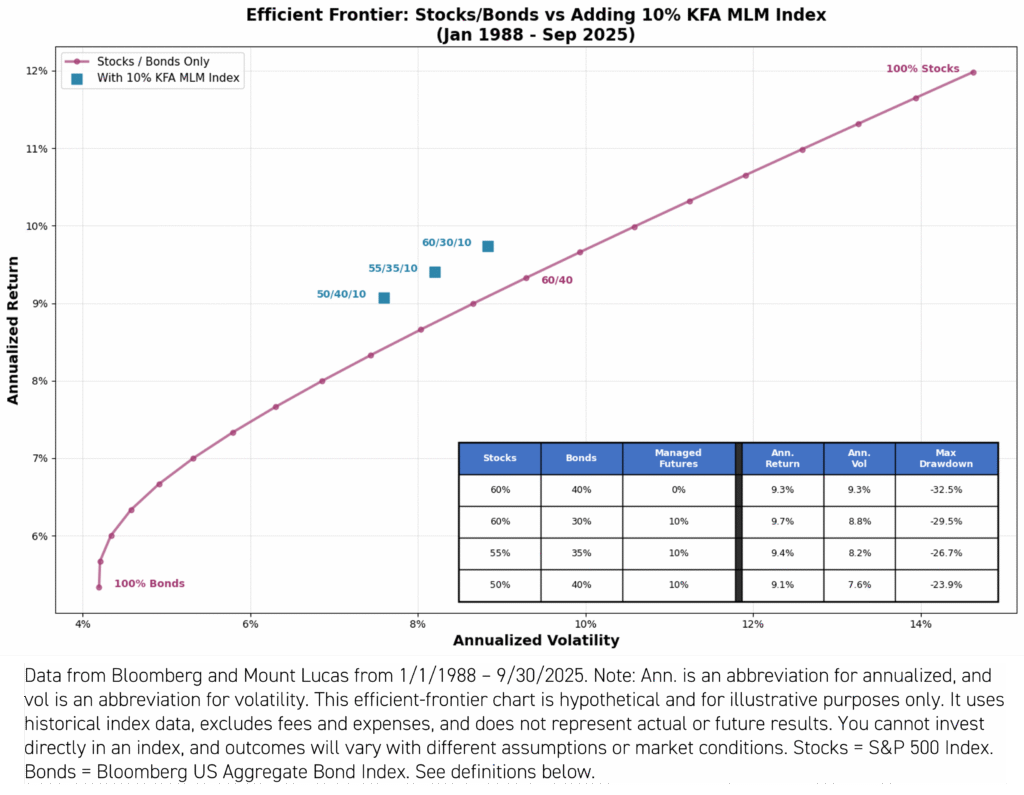
The chart above shows that a managed futures allocation of just 10% to a 60/40 portfolio improves annualized return, lowers standard deviation, and reduces maximum drawdown.
How can managed futures, given its underperformance in batting average, be such a contributor to the total portfolio?
The above chart shows this “smile”, created by historically having positive outcomes in both extreme positive and negative periods in stocks. This illustrates the portfolio outcome that managed futures are designed to provide, and attempting to over-optimize batting average may risk reducing the smile.
Why Role Discipline Matters (And Why It's So Hard)
The biggest threat to a well-designed total portfolio isn't market volatility. It's behavioral drift.
And it happens so gradually you barely notice. Your diversifying allocation underperforms for a couple years during a calm market environment. It sits at the bottom of the performance table. Someone asks why you're paying for something that's losing money. It's a fair question, honestly.
Maybe you trim it a bit. Just to 15% instead of 20%. Then a bit more the next year.
Before you know it, your "diversified" portfolio looks an awful lot like everyone else's: heavily concentrated in growth assets, all hoping for the same benign environment. You've drifted from your plan without really meaning to.
This is exactly what happened to many portfolios pre-2008. Energy stocks, emerging markets, commodities, and currency carry trades all did well together throughout the mid-2000s. If you looked at your portfolio in 2006, you felt like a genius. Everything was working.
But the common factor was narrowing, and it wasn't obvious until everything unwound simultaneously in 2008. Those who had trimmed their diversifying strategies during the good times, when they looked "unnecessary," were left overexposed when it mattered most.
For TPA to work, each element needs to stick to its role. Managed futures need to stay managed futures, maintaining exposure during both quiet periods and chaotic ones. This requires viewing performance through a different lens. Instead of asking "did this manager beat the S&P 500 this year?" the question should be "is this allocation fulfilling its role in the total portfolio context?"
Putting It All Together
As we look ahead to 2026, the case for thoughtful, disciplined diversification remains compelling. Inflation dynamics, geopolitical tensions, shifting central bank policy, and unexpected market dislocations continue to remind investors that relying on a single economic outcome can be a fragile strategy. The Total Portfolio Approach reframes the challenge: the goal isn’t to predict what will happen next, but to construct a portfolio that can adapt across a range of environments.
Institutional investors leading with this framework have embraced a critical insight, optimize for the whole, not the parts. That means allocating to strategies based on the role they play in the portfolio and evaluating them accordingly. In this context, a managed futures strategy like KMLM, which provides systematic exposure to global commodities, currencies, and fixed income futures, serves as a tool for accessing macro volatility and price uncertainty, risk factors that tend to behave very differently from traditional growth assets.
KMLM isn’t meant to replace stocks or bonds, nor is it expected to outperform them during extended periods of market calm. Its value lies in complementing them, offering positive skew, the ability to go long and short across markets, and historically strong performance during periods of stress when diversification matters most. When viewed through a total portfolio lens, that contribution can potentially improve resilience, reduce drawdowns, and help portfolios stay aligned with long-term objectives.
Whether you call it a Total Portfolio Approach or simply thoughtful diversification, the principle is the same: build portfolios with complementary parts, judge each part by how it contributes to the whole, and maintain the discipline to let each strategy do its part. That mindset, and the role clarity it enforces, can help portfolios to handle whatever 2026 brings.
For KMLM standard performance, top 10 holdings, risks, and other fund information, please click here.
*Diversification does not ensure a profit or guarantee against a loss. KMLM is a non-diversified fund. The statement regarding diversification refers to sector exposure, not regulatory diversification under the Investment Company Act of 1940.
**This material is intended for a retail audience and is for informational purposes only. It does not constitute investment advice or a recommendation to buy or sell any security.
References to institutional investors are included solely to describe the investment landscape and do not imply endorsement, validation, or suitability of any investment strategy for retail investors.
Please note:
- Institutional investors often have access to different investment terms, share classes, and due diligence resources that are not available to retail investors.
- Their participation in a fund or strategy does not guarantee performance, reduce risk, or ensure suitability for individual investors.
- Retail investors should not interpret institutional involvement as a signal of safety, quality, or future success.
A balanced evaluation of both risks and potential rewards is essential when considering any investment. This material does not constitute a forecast or guarantee of future performance.
Citations:
- “UBS House View Daily – Latest Market Insights,” UBS Global Wealth Management. January 21, 2026.
- Data from CalPERS as of 12/31/25.
- Data from CalSTRS as of 12/31/25.
- Data from Bloomberg as of 12/31/25.
- Data from Bloomberg as of 12/31/25.
- Data from Bloomberg as of 2/2/26.
Term Definitions:
Correlation: a statistical measure that shows how closely two investments move in relation to each other, indicating whether their returns tend to rise and fall together, move independently, or move in opposite directions.
Convexity: a return profile where a strategy tends to limit losses during normal conditions while having the potential to generate outsized gains during periods of market stress or sharp price moves.
Sharpe Ratio: a measure of risk-adjusted return that shows how much excess return an investment generates for each unit of total risk taken, as measured by volatility.
Annualized Return: the average yearly rate of return of an investment over a period longer than one year, adjusted for compounding.
Annualized Volatility: the annualized measure of how much an investment’s returns fluctuate around their average, indicating the level of risk.
Max Drawdown: the largest peak-to-trough decline in an investment’s value over a given period, representing the worst historical loss.
Polynomial: a return pattern that follows smoother, more predictable relationships under normal market conditions but can break down or fail to capture extreme outcomes when markets experience large, nonlinear shocks.
Index Definitions:
S&P 500 Index: The S&P 500 Index is widely regarded as the best single gauge of large-cap U.S. equities. There is over USD 9.9 trillion indexed or benchmarked to the index, with indexed assets comprising approximately USD 3.4 trillion of this total. The index includes 500 leading companies and covers approximately 80% of available market capitalization. The index was launched on March 4, 1957.
KFA MLM Index (“KMLM’s Index”): The KFA MLM Index is a diversified trend following portfolio of commodity, currency, and global fixed income futures contracts traded on US and foreign exchanges. The performance data for the index is a representation of the MLM Index from 1/1/1988 to 12/31/2004, the MLM Index EV (“EV”), with enhanced Execution and Volatility characteristics, from 1/1/2005 to 11/30/2020, and, using the same methodology as the “EV,” the KFA MLM Index from 12/1/2020 on.
Bloomberg Barclays US Aggregate Bond Total Return Index (“US Aggregate Bond Index”): Bloomberg Barclays US Aggregate Bond Index): The Bloomberg Barclays US Aggregate Bond Index is a broad-based flagship benchmark that measures the investment grade, US dollar-denominated, fixed-rate, taxable bond market in the United States. The index includes Treasuries, government-related, and corporate securities. The index was launched on January 1, 1976.