KMLM Managed Futures ETF Q3 2026 Review: Inflation, Rate Hikes, and the Return of 2022
By Mount Lucas
If Q1 was the shock and Q2 was the unwind, Q3 was the market deciding the shock was the right answer after all. The interim ceasefire with Iran collapsed on July 8, and the energy complex spent the rest of the quarter working higher. WTI Crude, which ended June near $69, traded above $92 by late July, pulled back to $75 in early August, then pushed above $95 in mid-September after a drone strike shut Saudi Arabia's East-West pipeline. Prices eased into quarter-end, finishing near $88, as the pipeline came back online and G7 governments agreed to a reserve release. The path was not clean, but it trended, and the Index was long the whole way.
Q3 Index and Sector Performance
The KraneShares Mount Lucas Managed Futures Index Strategy ETF (Ticker: KMLM) seeks to track Mount Lucas Management's KFA MLM Index. The Index finished the quarter up 13.3%. Commodity (+6.6%) and Global Fixed Income (+5.2%) markets contributed to results while Currency (-0.1%) markets detracted. Interest income added 1.1%. For the twelve months ending September 2026, the Index was up 22.2%. Year-to-date, the Index is up 20.3%. Sector contributions are arithmetic sums of daily returns and do not compound to the quarterly index return.
For KMLM standardized performance current to the most recent month end, click here. Past performance does not guarantee future results.
Index returns are for illustrative purposes only and do not represent actual Fund performance. Index returns do not reflect management fees, transaction costs, or expenses. Indexes are unmanaged, and one cannot invest directly in an index. Past performance does not guarantee future results. For KMLM standard performance, please click here.
Q3 Index and Sector Exposures
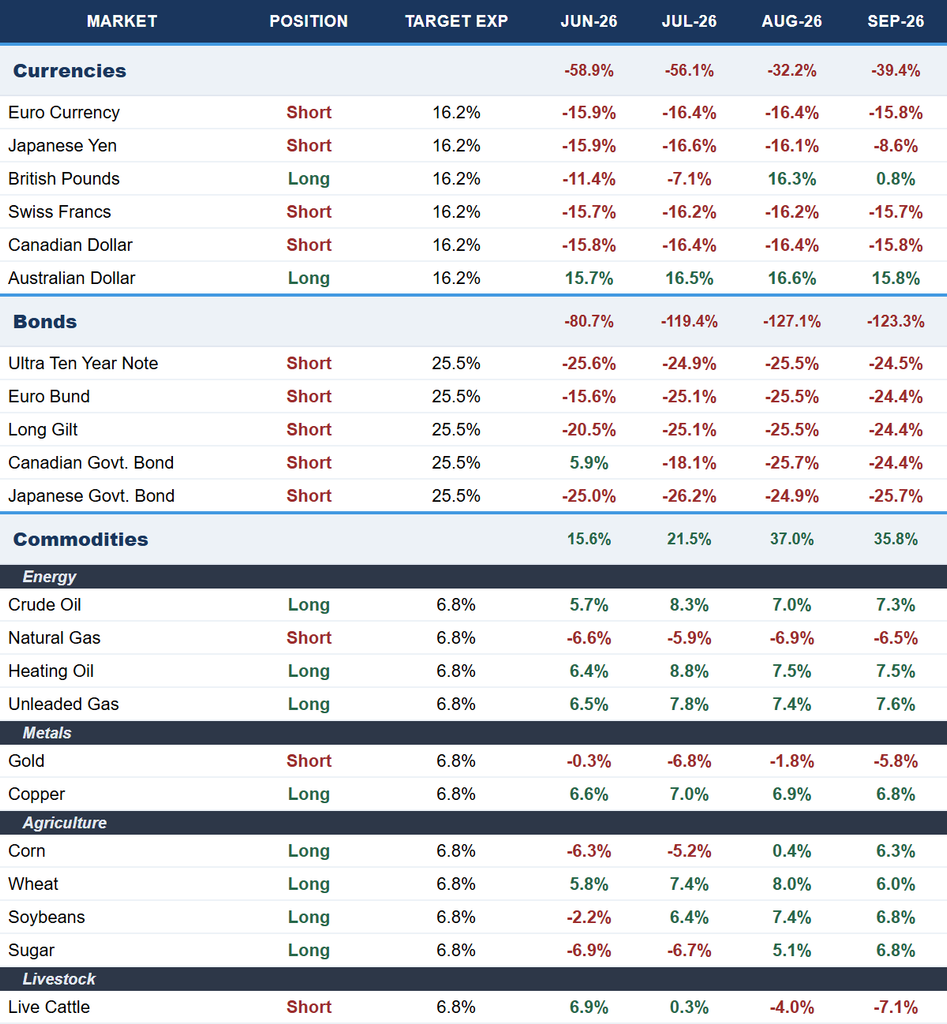
Over the course of the quarter, Commodity exposures went from net long 16% to net long 36%, Currency exposures went from net short 59% to net short 39%, and Global Fixed Income exposures went from net short 81% to net short 123%.
Q3 Review
The second story was central banks finishing the pivot that started in June. The Fed held in July on a 9-3 vote with three dissents in favor of a hike. Chair Warsh used Jackson Hole to say underlying inflation had not meaningfully improved, and on September 16, the FOMC voted 12-0 to raise rates 25bps from 3.75% to 4.00%, the first hike since 2023, with the dot plot pointing to one more this year. The Bank of Japan followed two days later, lifting its policy rate to 1.25%, the highest since 1995. Bond markets did the rest. The U.S. 10-year yield closed the quarter at 5.29%, above its 2007 closing high and the highest since 2002, pushed by energy-driven inflation and heavy Treasury and AI-related issuance. The Index extended its bond short from 81% to 123%, nearly all of it in the last week of July, and held it there.
Across three quarters, the Index is up 8.3%, down 2.0%, and up 13.3%, leaving it up 20.3% for the year. The Index now owns long energy, long grains, short global bonds, and a shrinking short in foreign currencies. These positions are four expressions of one idea: supply-driven inflation that central banks are addressing late. Pretty much a repeat of 2022, except stocks are still trading near highs as massive AI capex provides stimulus to the economy, though that same capex is now competing for capital in the bond market. For more on this, see our 2022 review here and our recent webinar replay here. With the President signaling the conflict could wind down after the midterms, or maybe not, the macro remains one headline away from either direction.
Commodity
In the commodity sector, the top three contributors were Heating Oil, Unleaded Gas, and Crude Oil, while the bottom three detractors were Corn, Sugar, and Live Cattle.
The energy complex carried the sector, with long positions in Crude Oil, Heating Oil, and Unleaded Gas held throughout the quarter and profitable in every month, even as prices eased off their mid-September highs into quarter-end. Natural Gas also added, with the short benefiting from a strong July.
In metals, Gold was the frustrating one. The Index held roughly 7% short through July and early August, watched Gold rally roughly 14% into late August, and cut the position to essentially flat by September. Following the Fed hike, Gold slid to a seven-week low, and the Index rebuilt its short to roughly 6% by quarter-end, recovering a small portion of the earlier loss. Copper was a small long and a small gain.
In grains, higher energy prices fed into input costs, particularly fertilizer, and prices firmed into early September. Corn and Soybeans both flipped from short to long during the quarter, with Corn taking losses on the transition and again on September 30, when the USDA Quarterly Grain Stocks report showed corn inventories at a seven-year high, and December Corn fell to $5.0075. The Wheat long, held since Q2, and the Soybean long, both contributed, though Wheat gave back part of its gain as prices fell to a six-week low in late September.
In agriculture, Sugar reversed from short to long in late August and gave back a full point in the process, and Live Cattle flipped from long to short as prices fell.
Major shifts in exposure during the quarter included Corn (short to long), Gold (short to essentially flat back to short), Live Cattle (long to short), Soybeans (short to long), and Sugar (short to long).
Currency
In the currency sector, the Swiss Franc, Euro, Australian Dollar, and Canadian Dollar were contributors, while the Japanese Yen and British Pound detracted.
Dollar strength, which had been the clear trend in Q2, became a two-way fight in Q3 as intervention and expectations of a Bank of Japan rate hike collided with the Fed's own hawkish turn. The Yen short was the largest detractor in the sector, caught by the July 31 intervention and again by the early September rally toward 155, before recovering some of those losses in late September as the Fed hike reasserted the Dollar and the Yen weakened back above 157.
The British Pound was the notable position change, reversing from short to long in early August, then cut back to essentially flat over the second half of September as Sterling slid, costing the Index on both turns.
The Canadian Dollar, Euro, and Swiss Franc shorts were held at full size all quarter, giving up ground through August before the post-Fed Dollar rally in September turned all three into contributors.
The Australian Dollar long, in place since Q2, was the steadiest contributor through August but gave back part of its gain late in the quarter. The net effect was a reduction in the sector's short foreign currency exposure, from net short 59% to net short 39%.
Major shifts in exposure during the quarter included the British Pound (short to long to essentially flat) and the Japanese Yen (reduced short).
Fixed-Income
In the global fixed income sector, all five markets contributed, led by the U.S. Ultra Ten Year, UK Long Gilts, and the Euro Bund.
Yields moved higher across the developed world as the energy shock pushed inflation expectations up and central banks moved from talking about hikes to delivering them. The U.S. 10-year yield crossed 5% for the first time since 2007 on September 15 and kept climbing into quarter-end, and Japanese borrowing costs rose as the Bank of Japan lifted rates to a three-decade high.
The Index extended shorts across the board in the last week of July, taking the Euro Bund and UK Long Gilt to full size and reversing Canadian Government Bonds from long to short, a switch that had cost the Index in Q2 and paid in Q3 as Canadian yields finally followed the U.S. higher.
The sector ended the quarter at its largest short exposure in several years. Major shifts in exposure included the CGB (long to short), Euro Bund (increased short), and UK Long Gilt (increased short).
Net Market Exposures
Data from Mount Lucas Management as of 10/7/2026.
Holdings are subject to change.
For KMLM standard performance, top 10 holdings, risks, and other fund information, please click here.
Index returns are for illustrative purposes only and do not represent actual Fund performance. Index returns do not reflect management fees, transaction costs, or expenses. Indexes are unmanaged, and one cannot invest directly in an index. Past performance does not guarantee future results.
Term Definitions:
Long / Short: A long position generally benefits when prices rise, while a short position generally benefits when prices fall.
Net Long/Short Exposure: A futures contract is an agreement to buy (long) or sell (short) an asset at a predetermined price at a specified future date. The exposure is calculated by the position size (negative if short) times the value of one contract.