KMLM Managed Futures ETF Q2 2026 Review: After the Shock, the Unwind
By Mount Lucas
Q2 was a study in reversal. The acute shock that defined the first quarter, the outbreak of the Iran war, the closure of the Strait of Hormuz, oil spiking, bonds selling off, gave way to a slower grind of de-escalation and repricing. Crude Oil, which hit highs north of $110 in early April on fears of a prolonged supply disruption, cracked hard in May and June as ceasefire negotiations progressed, tumbling roughly 20% off its highs even as sporadic strikes and diplomatic setbacks kept the outcome uncertain through quarter-end. Trend positioning, still bullish (long) on the energy complex coming out of Q1, gave back a portion of those gains as prices reversed.
Q2 Index and Sector Performance
The KraneShares Mount Lucas Managed Futures Index Strategy ETF (Ticker: KMLM) seeks to track Mount Lucas Management's KFA MLM Index. The Index finished the quarter down 2.0%. Currency (+0.7%) markets contributed to results while Commodity (-2.8%) and Global Fixed Income (-0.5%) markets detracted. Interest income added 0.9%. For the twelve months ending June 2026, the Index was up 10.5%. Year to date, the Index is up 6.2%.
Q2 Index and Sector Exposures
Over the course of the quarter, Commodity exposures went from net long 51% to net long 16%, Currency exposures went from bearish (short) by 12% to net short 59%, and Global Fixed Income exposures went from net short 75% to net short 81%.
Q2 Review
The other defining story of the quarter was a changing of the guard at the Federal Reserve (Fed). New Chair Kevin Warsh's first meeting in mid-June landed with a hawkish tone, as energy-driven inflation (May CPI ran at 4.2%, the hottest reading in years) collided with a still-resilient labor market. Rate-cut expectations that had prevailed for much of the past year flipped to rate-hike bets, and the Dollar rallied to a one-year high by quarter-end. That combination, elevated real yields and a firmer Dollar, proved too much for Gold, which reversed from its January all-time high above $5,500 to trade below $4,100 by late June.
This is the give-and-take often observed in a positively skewed strategy. Q1's trend followed the shock; Q2's trend followed the unwind. Managed Futures does not attempt to predict when a crisis will de-escalate any more than it predicts when one will begin, and instead relies on a systematic process that adjusts position sizing based on price movements. Commodity exposure was cut by roughly two-thirds over the quarter (net long 51% to net long 16%) as energy rebalanced Q1 gains and Gold long positions were pared back, while the strategy increased positions that benefit from declines in foreign currencies (net short 12% to net short 59%) to align with the newly resurgent Dollar. Global bond exposure grew modestly more short (net short 75% to net short 81%) as the market's hawkish repricing gave the Index's existing short additional room to work, though bond markets outside the U.S. were slower to follow, capping the sector's contribution.
Zooming out, the Index remains up 10.5% over the trailing twelve months and 6.2% year to date, a reminder that a single quarter's give-back does not undo the value trend following can add during a genuine macro shock. With OPEC facing internal strain, Iraq has reportedly threatened to follow the UAE out of the cartel, and the durability of the Iran ceasefire still very much in question, the set-up for the second half of the year remains fluid. The Index enters Q3 net long a shrinking commodity book (still long energy), net short foreign currencies, and net short global bonds.
In the commodity sector, the top three contributors were Copper, Sugar, and Live Cattle, while the bottom three detractors were Crude Oil, Gold, and Heating Oil.1 The energy complex remained the dominant story, Crude Oil, Heating Oil, and Unleaded Gas all still held long positions carried over from Q1's shock but gave back gains as prices reversed sharply on ceasefire optimism; Natural Gas's short position was essentially unchanged and roughly flat on the quarter. In metals, Gold's long position, profitable through most of the past year, was cut down to nearly flat by quarter-end as the metal reversed from its January highs on Fed hawkishness and Dollar strength. Copper remained slightly positioned for prices to rise and was a top contributor as prices held up better than the rest of the complex. In agriculture, the short Sugar position benefited from falling prices, while the Live Cattle long remained productive. Corn and Soybeans both flipped from long to short as grain prices gave back early-quarter gains. Notable shifts in exposure during the quarter included Corn (long to short), Gold (long to essentially flat), and Soybeans (long to short).
In the currency sector, the Japanese Yen, Swiss Franc, and Australian Dollar were the top contributors, while the British Pound was the primary detractor. The dominant theme was Dollar strength, which accelerated through the quarter as the Fed's hawkish June meeting under new Chair Kevin Warsh pushed the Dollar to a one-year high. The Index's currency book moved decisively in step, with net exposure shifting from net short 12% to net short 59% foreign currencies by quarter-end. The Canadian Dollar and Swiss Franc both flipped from long to short mid-quarter as the Dollar's advance gathered pace, while the Japanese Yen's short position, in place for some time, remained intact and was the top contributor as the currency continued lower. The British Pound's short position was increased over the quarter but was the lone detractor, lagging the move seen elsewhere in the sector. Major shifts in exposure during the quarter included the Canadian Dollar (long to short), Swiss Franc (long to short), and British Pound (increased short).
In the global fixed income sector, the primary contributors were the Japanese Government Bond (JGB) and the U.S. Ten Year, while the Euro Bund, UK Long Gilts, and Canadian Government Bonds (CGB) detracted. Global bond markets remained under pressure as the Fed's hawkish repricing and persistent energy-driven inflation pushed yields higher, and the Index's already-short book was extended further, from net short 75% to net short 81% over the quarter. The U.S. Ten Year short was increased meaningfully as rate-hike odds climbed following the June Federal Open Market Committee (FOMC) meeting. The Index reversed course in Canadian Government Bonds, moving from short to long mid-quarter, a position that ultimately detracted as Canadian yields did not follow the U.S. higher. Major shifts in exposure included the CGB (short to long), Euro Bund (reduced short), UK Long Gilts (increased short), and U.S. Ten Year (increased short).
Net Market Exposures
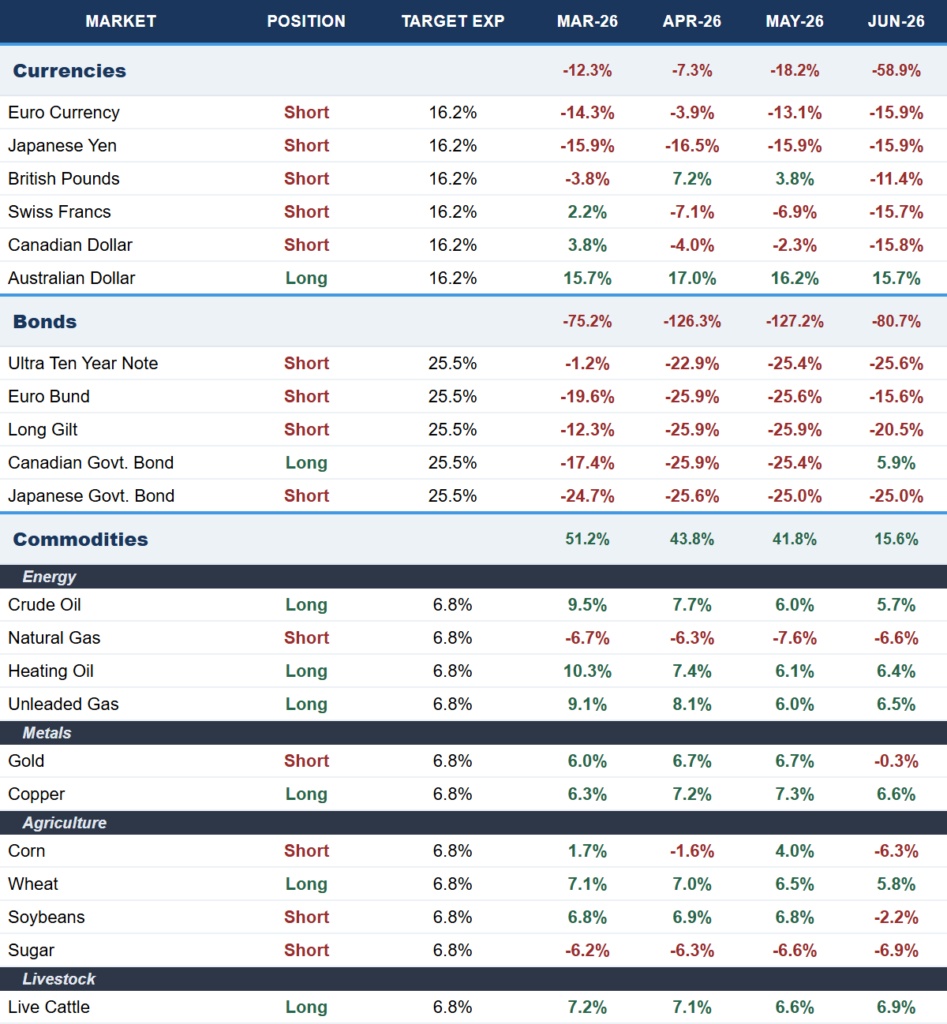
Data from Mount Lucas Management as of 7/10/2026. Data ranges from March 2026 to June 2026.
Holdings are subject to change.
For KMLM standard performance, top 10 holdings, risks, and other fund information, please click here.
Index returns are for illustrative purposes only and do not represent actual Fund performance. Index returns do not reflect management fees, transaction costs, or expenses. Indexes are unmanaged, and one cannot invest directly in an index. Past performance does not guarantee future results.
Citation:
- Data from Mount Lucas Management as of 7/10/2026.
Term Definitions:
Long/Short: A long position generally benefits when prices rise, while a short position generally benefits when prices fall.
Net Long/Short Exposure: A futures contract is an agreement to buy (long) or sell (short) an asset at a predetermined price at a specified future date. The exposure is calculated by the position size (negative if short) times the value of one contract.