How To Position For A Positive Path In US-China Trade Relations
By Brendan Ahern
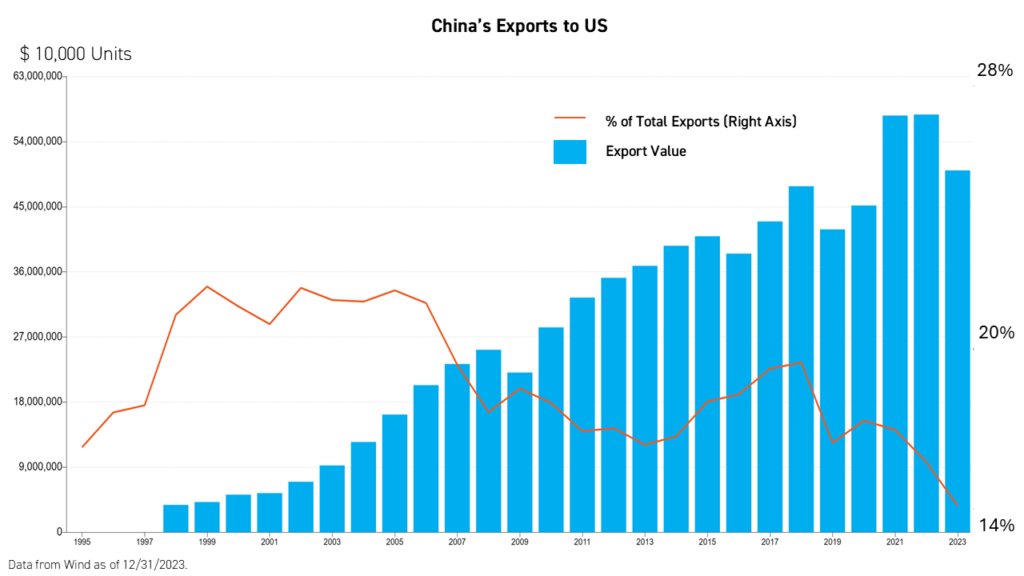
The announcement of a 90-day tariff truce between the US and China propelled global equities back to pre-Liberation Day levels. Investors appear to be convinced that trade negotiations will lead to increased certainty and stem damage to the global economy. Due to its dependence on consumption, imports are essential to the US economy, and we continue to believe that tariffs are meant to be a negotiation tactic, rather than a long-term policy. Meanwhile, China's hardline initial stance on tariffs caught many by surprise and was driven by the reality that exports to the US only represent about 14% of China's total exports.
We believe investors may be underestimating the potential for an improvement in US-China relations in the near term. The KraneShares CSI China Internet ETF (Ticker: KWEB) has historically been highly sensitive to trade news, despite low revenue exposure to the US. As such, we believe KWEB is a compelling investment vehicle to gain exposure to positive trade developments and a reallocation into China by US and global investors. Additionally, we have found that simple technical strategies, including rebalancing based on a Relative Strength Index (RSI), theoretically work well with KWEB and have the potential to mitigate volatility.
The Great Reallocation
Donald Trump wants a "big, beautiful deal" with China. His control over the Republican party could mean that the media and Congress change their tune dramatically on China once a deal is achieved, leading to reallocations by US investors and potential equity market gains as the geopolitical and trade overhang dissipates. Moreover, President Trump’s business background makes him receptive to the business community's views, as evidenced by pivots and the announcement of significant tariff exemptions after meeting with the CEOs of Apple, Walmart, the Home Depot, and Target, to name a few.
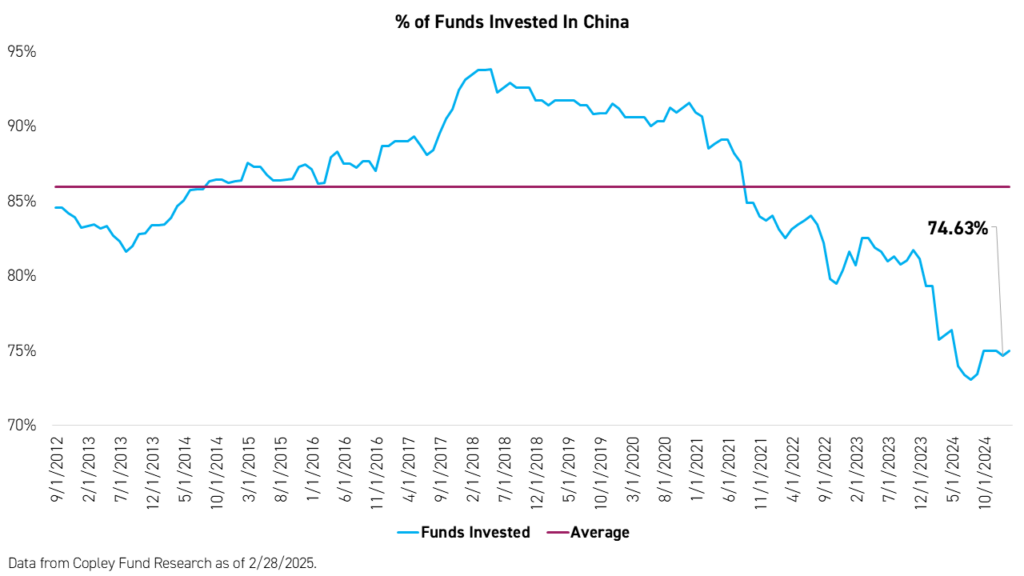
Copley Fund Management, a research firm focused on active mutual funds’ positioning, recently highlighted that over 25% of active mutual funds with a global mandate and benchmarked to MSCI’s All Country World Index (ACWI) have zero exposure to China.
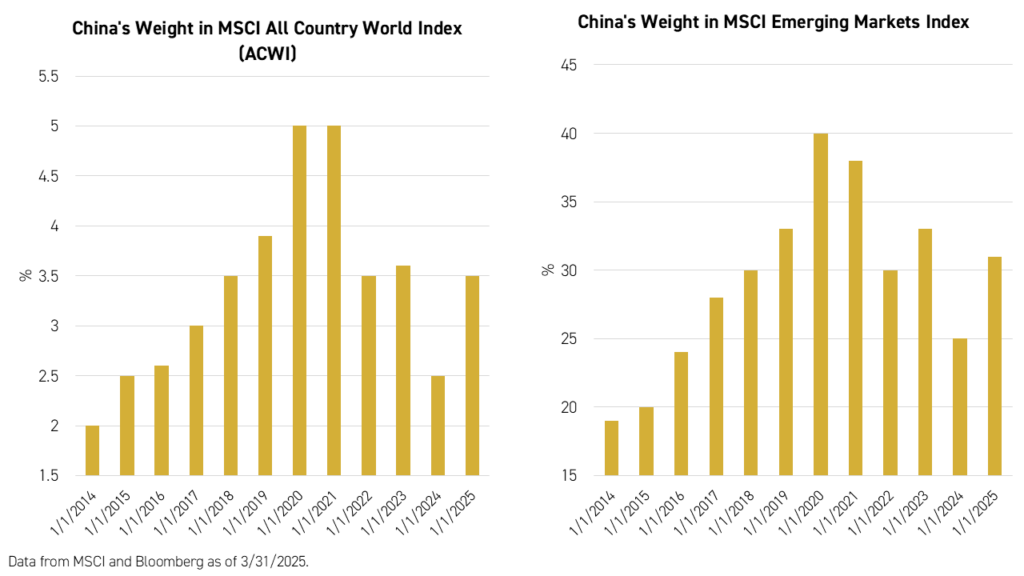
Meanwhile, China’s weight within the MSCI Emerging Markets and MSCI ACWI provides another clue of what a rerating could entail. China’s weight within the MSCI ACWI declined by half from 2020's high of 5% to just 2.5% in 2024, before rebounding significantly to 3.5% in 2025. A re-rating of China's equity market could mean a move back to previous index weights, implying a significant market move.
Rebalancing Using Simple Technical Signals
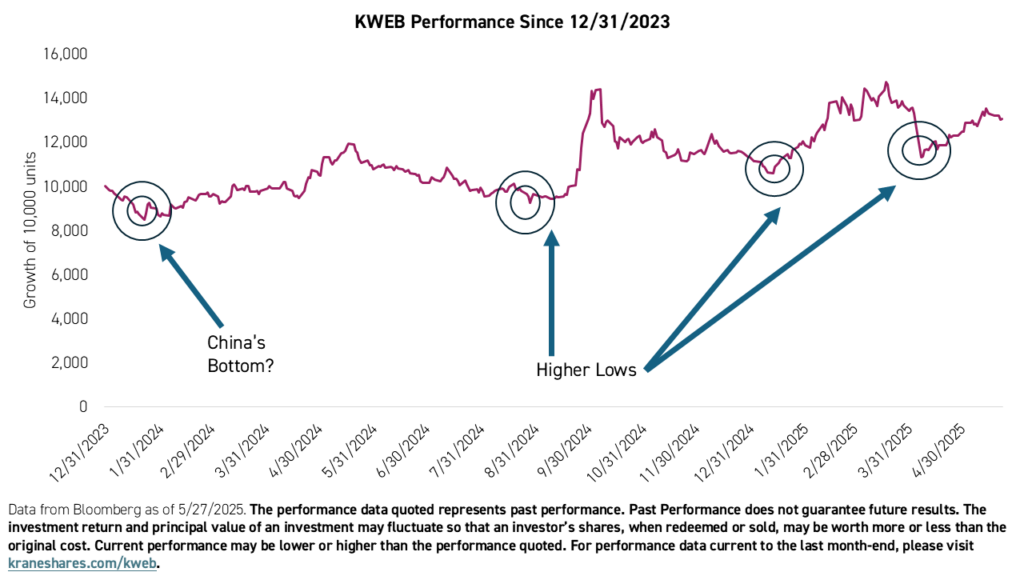
Although many investors would point to the release of DeepSeek AI as a market turning point, we believe January 2024 is a more appropriate date to pin as having potentially been the bottom in China stocks. Whatever the case, technical analysts would typically interpret a pattern of higher lows as indicative of a potential uptrend.
How can one mitigate the volatility inherent in the space? We offer several products as solutions, including the KraneShares KWEB Covered Call Strategy ETF (Ticker: KLIP), two KWEB defined outcome ETFs (The KraneShares 100% KWEB Defined Outcome January 2027 ETF Ticker: KPRO and the KraneShares 90% KWEB Defined Outcome January 2027 ETF Ticker: KBUF), and the KraneShares Emerging Markets Consumer Technology ETF (Ticker: KEMQ), which takes KWEB's internet consumption theme and applies it to broad emerging markets.
Another option is to trim one’s positions on the “rips” while buying the “dips” using a simple technical analysis. We believe maintaining a position and actively rebalancing can achieve strong, volatility-dampening results.
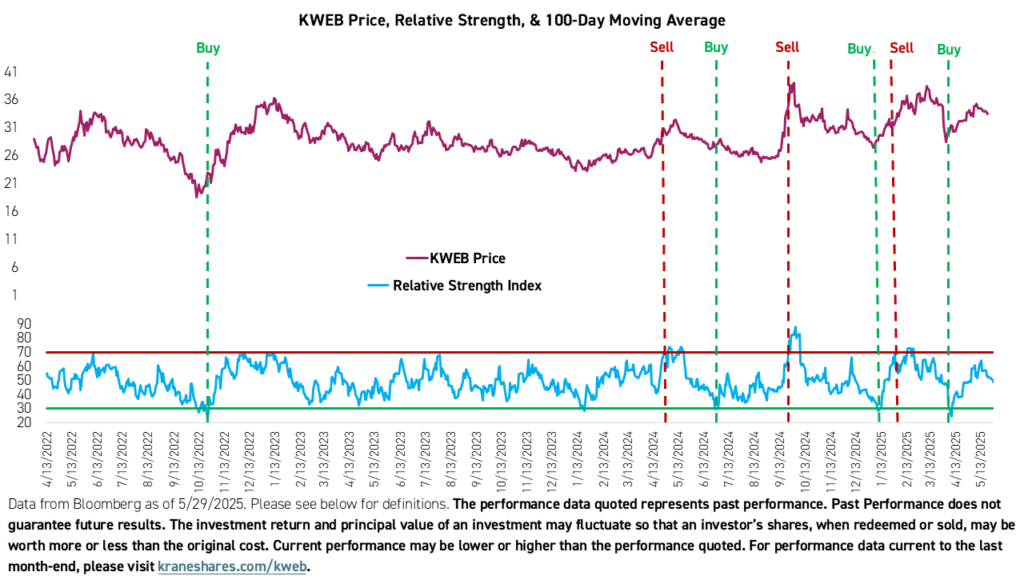
The relative strength index (RSI) is a momentum indicator used in technical analysis. It measures the speed and magnitude of a security's recent price changes to detect overbought or oversold conditions in its price.
For example, adding to a KWEB position when the Relative Strength Index closed below 30, an indication of an oversold condition, and then reducing a position when the RSI hit 70, an indication of an overbought condition, over the past three years, could have yielded a favorable result, hypothetically speaking.*
The RSI can be used in many different ways. The hypothetical success of such a rebalancing strategy may reflect the cyclical nature of KWEB's volatility.
Conclusion
After the much-anticipated, 90-minute phone call between President Trump and President Xi on June 5th, the US and China appear to be on the right path towards a deal and trade detente. The United States and China are highly intertwined economically, which is not going to change anytime soon, as the recent truce and the tariff exemptions that came before it demonstrate. We believe the KraneShares CSI China Internet ETF (Ticker: KWEB) and its derivative strategies are well positioned to benefit from a thaw in relations and that volatility can be managed with the appropiate strategy.
For KWEB standard performance, top 10 holdings, risks, and other fund information, please click here.
*Past performance, whether actual or hypothetical, is not indicative of future results. There is no assurance that any strategy, including those based on technical indicators such as the Relative Strength Index (RSI), will achieve its intended results under future market conditions.
Definitions:
Liberation Day: a day, often a public holiday, that marks the liberation of a place, similar to an independence day, but differing from it because it does not involve the original creation of statehood.
MSCI All Country World Index (ACWI): The MSCI ACWI captures large and mid-cap representation across 23 Developed Markets (DM) and 24 Emerging Markets (EM) countries*. With 2,558 constituents, the index covers approximately 85% of the global investable equity opportunity set. The index was launched on May 31, 1990.
MSCI Emerging Markets Index: The MSCI Emerging Markets Index is a free-float weighted equity index that captures large and mid cap representation across Emerging Market (EM) countries. The index covers approximately 85% of the free-float adjusted market capitalization in each country. The index was launched on January 1, 2001.